
Messari named Grass a core data provider within the emerging decentralized AI (DeAI) infrastructure. The report emphasized Grass’s role in delivering essential bandwidth and data to train AI models. It placed Grass alongside other leading DeAI projects such as Pluralis, Gensyn, and Nous, underscoring its strategic position in the tech stack.
Transitioning to May 27, 2025, analysts highlighted Grass as one of five altcoins poised for significant utility-led growth. They noted its strengths in tokenizing real-world assets and expanding its user base through bandwidth-sharing incentives.
Importantly, beyond recognition, Grass has delivered measurable network performance. The network achieved over 1 PB of daily data retrieval and scaled multimodal web scraping by more than 60× following its Sion upgrades. Moreover, Grayscale reported that Grass recorded tens of millions in annualized revenue from selling scraped web data to AI labs, reinforcing its practical relevance.
Grass Forms Descending Triangle and Breaks Down Sharply
On July 1, 2025, Grass (GRASS/USDT) confirmed a breakdown from a descending triangle pattern on the daily chart. The descending triangle is a bearish technical pattern formed by a horizontal support line and a descending resistance line. It typically signals that sellers are gaining control and may push the price lower after the pattern breaks.
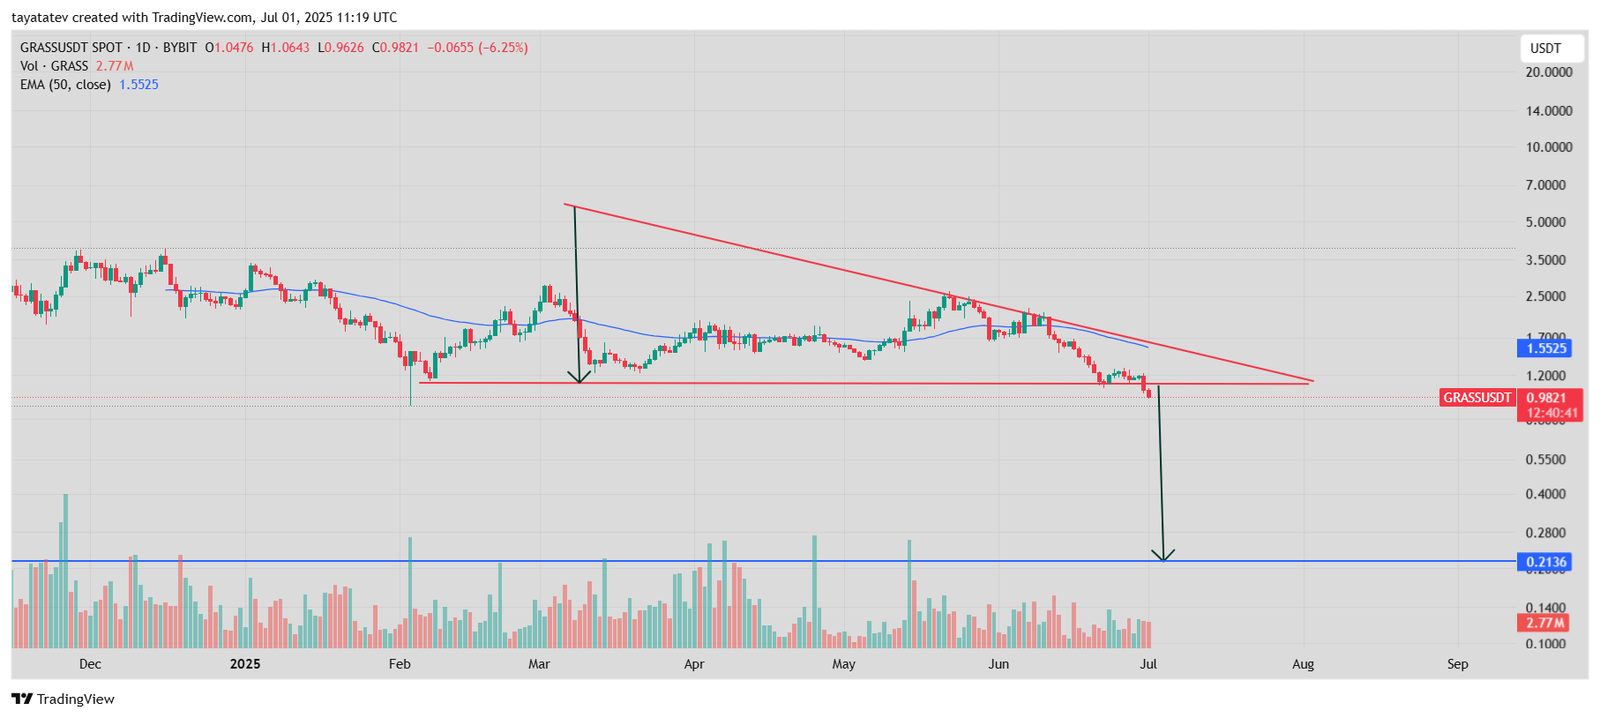
From the chart, the descending triangle formed between March and June 2025. The upper red trendline shows the descending resistance, while the flat red line indicates the horizontal support. The pattern broke to the downside, with GRASS falling sharply below support.
After the breakdown, the price has already dropped by about 19% from the breakout level. The triangle’s height—measured from the top to the base—suggests that GRASS could fall as much as 358% from the current level. If this full move plays out, the price target would be around $0.2136, marked by the blue horizontal line on the chart.
The price is now trading at $0.9821, far below the 50-day Exponential Moving Average (EMA), which currently stands at $1.5525. Volume also spiked during the drop, reaching 2.77 million GRASS, which adds strength to the breakdown signal.
If sellers continue to pressure the market, GRASS could keep moving toward the projected level of $0.2136.
Grass RSI Falls Below 30, Signals Oversold Condition
The 14-day Relative Strength Index (RSI) for Grass (GRASS/USDT) dropped to 29.31, moving below the key level of 30. The RSI is a momentum indicator that measures the speed and change of price movements. A reading below 30 usually signals that the asset has entered oversold territory, suggesting strong downward pressure.
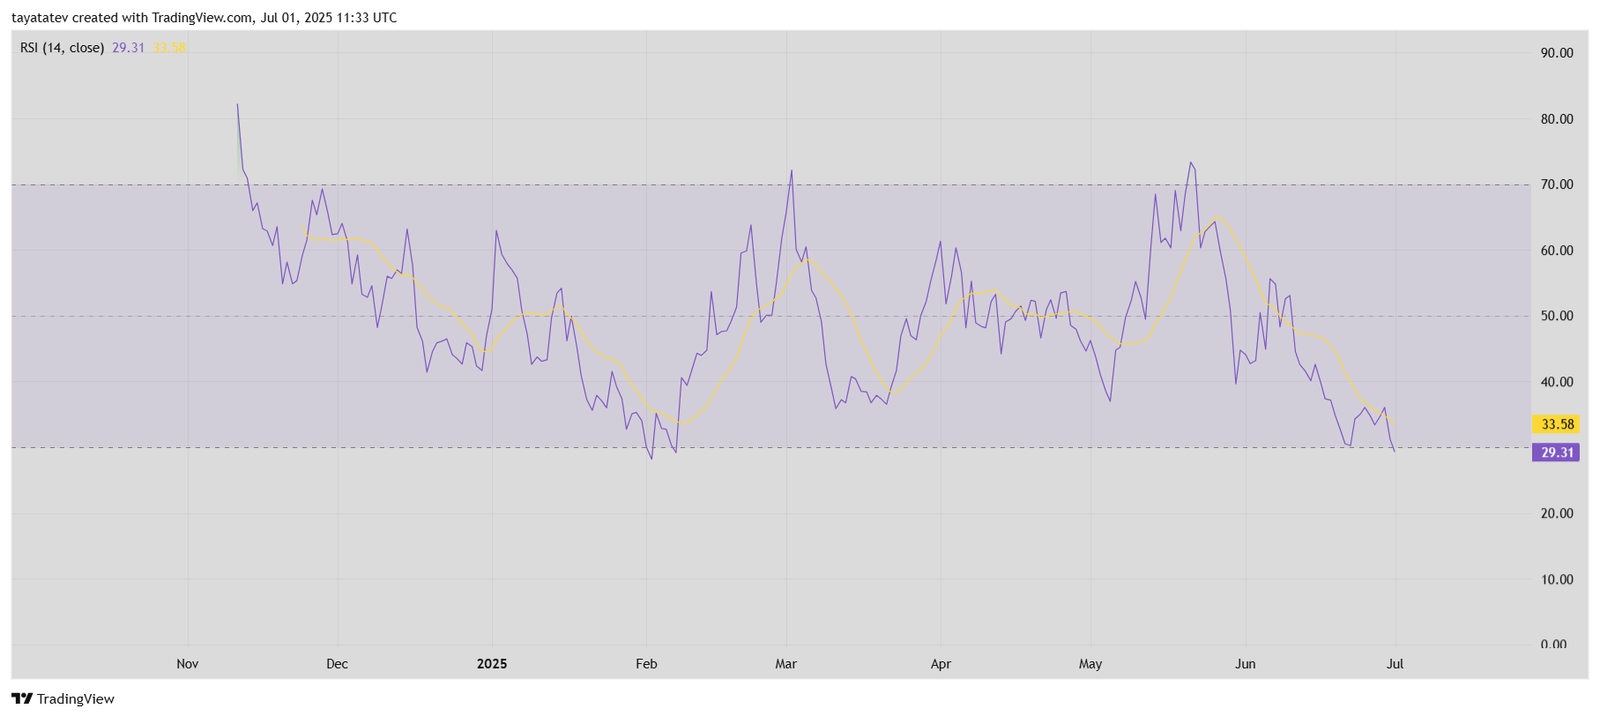
The yellow line on the chart represents the 14-period moving average of the RSI. It now stands at 33.58, still above the current RSI value. The gap between the two lines indicates sustained bearish momentum.
Throughout June, the RSI continued to fall, reflecting weakening strength in buyer interest. This aligns with the recent sharp price drop and descending triangle breakdown seen on the price chart.
With the RSI below 30, GRASS is now in a technical zone where short-term bounces can happen. However, the indicator alone does not confirm a reversal unless it climbs back above 30 with rising volume.
Balance of Power Turns Negative for Grass on July 1
On July 1, 2025, the Balance of Power (BoP) indicator for Grass (GRASS/USDT) dropped to -0.67, reflecting stronger selling pressure in the market. The Balance of Power measures the strength of buyers versus sellers by comparing the closing price relative to the trading range. When BoP falls below zero, it signals that sellers are dominating the session.
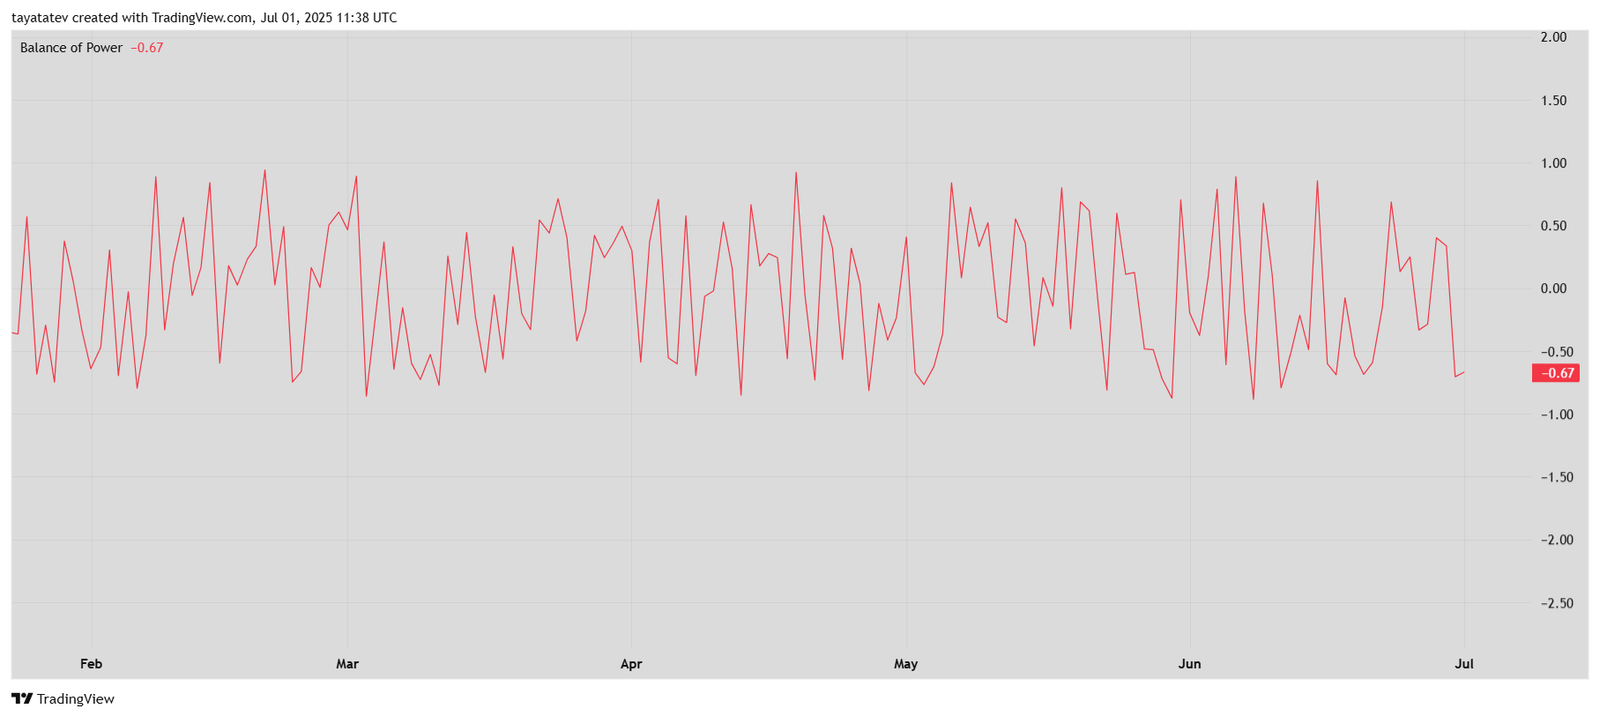
Throughout June, the BoP fluctuated but remained mostly negative. This consistent bearish reading aligns with the recent price breakdown from the descending triangle pattern and the drop below the key support level.
The current BoP level of -0.67 suggests that bears continue to control the price action. It also confirms what other technical indicators show, such as the Relative Strength Index (RSI) falling below 30 and the price slipping under the 50-day Exponential Moving Average (EMA).
Unless the BoP moves back toward zero or positive territory, pressure may stay on the downside.
Directional Movement Index Confirms Strong Downtrend for Grass on July 1
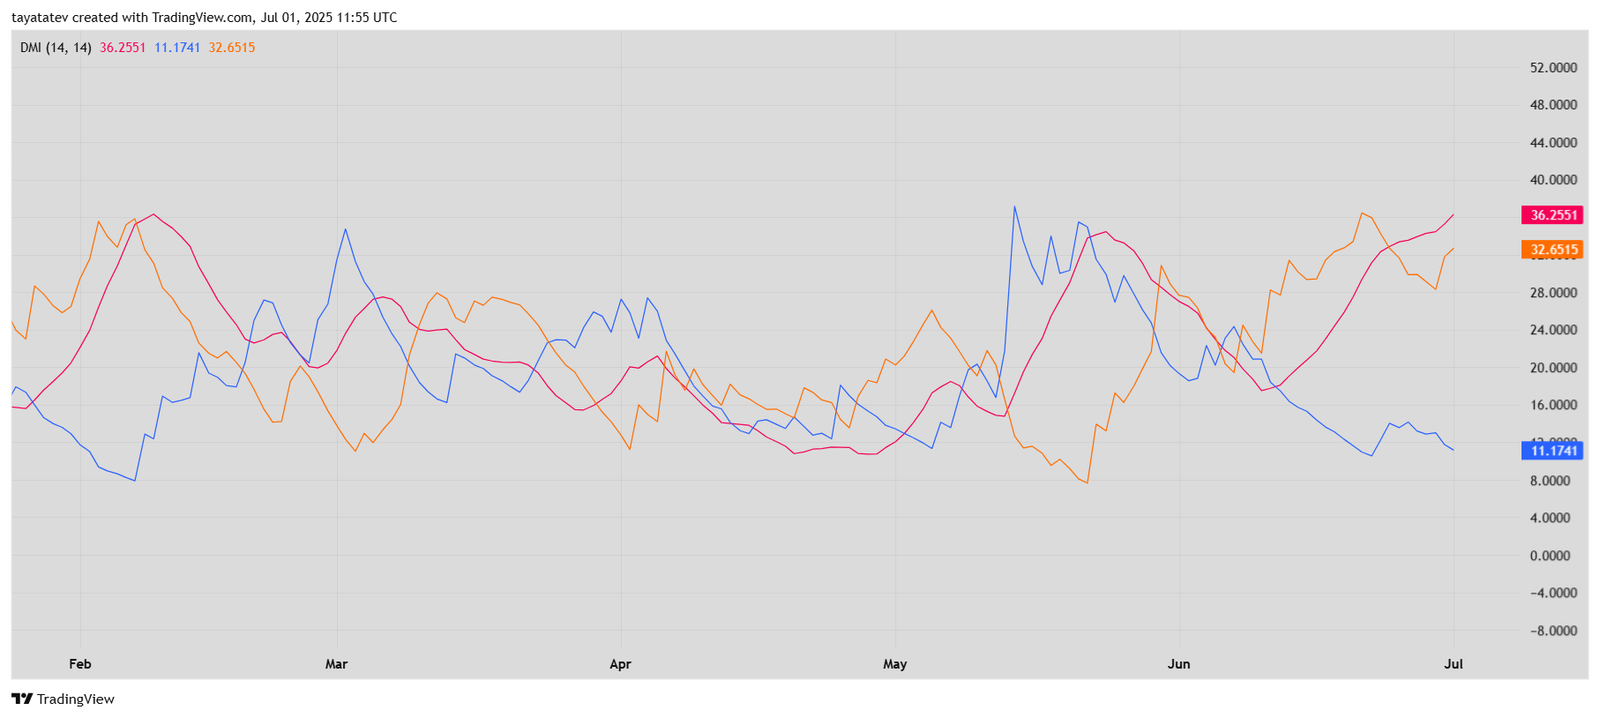
The Directional Movement Index (DMI) for Grass (GRASS/USDT) confirmed strong bearish momentum. The DMI consists of three lines:
+DI (blue): 11.17
–DI (orange): 32.65
ADX (red): 36.25
The –DI value is significantly higher than the +DI, showing that sellers are in control. Meanwhile, the Average Directional Index (ADX) at 36.25 signals a strong trend. The ADX measures the strength of the current trend but does not indicate direction. A reading above 25 usually confirms a solid trend, and in this case, the dominance is clearly on the downside.
Source: TradingView.com
Throughout June, the orange –DI line rose steadily while the blue +DI fell, marking a transition from neutral action to bearish dominance. The red ADX line followed by rising sharply, confirming that the downtrend was strengthening.
Together, these readings show that selling pressure has not only increased but also become more consistent. With the +DI far below the –DI and the ADX rising above 35, the indicator signals that the current downtrend remains firmly intact.
Stochastic Momentum Index Signals Bearish Momentum for Grass on July 1
Meanwhile, the Stochastic Momentum Index (SMI) for Grass (GRASS/USDT) stayed deep in negative territory. The blue line (SMI) printed –59.87, while the orange signal line stood at –54.30. Both values are below –40, confirming continued bearish momentum.

The Stochastic Momentum Index is an improved version of the traditional stochastic oscillator. It measures the closing price’s position relative to the midpoint of the high-low range over a selected period. When both SMI and signal lines are below –40, it often indicates strong downside pressure.
Since late June, the blue SMI line crossed back below the orange signal line while staying below the –40 threshold. This crossover in the negative zone suggests that sellers have regained control.
Throughout 2025, the SMI has moved in cycles. However, the current downturn appears sharp and consistent with other bearish signals like the Relative Strength Index (RSI) below 30 and Balance of Power (BoP) staying negative.
Unless the SMI line crosses back above the signal line and climbs toward neutral territory, short-term sentiment remains bearish.
