
Yerevan (CoinChapter.com) — Holo’s HOT [almost] reached the bullish target discussed in the previous follow-up outlook.
Read more: Holo (HOT) Follow Up 09: 50% Rise Expected Even After Bullish Wedge Invalidation
We had anticipated the HOT/USDT exchange rate to rise by 50 percent; it rose by a little over 40 percent before returning lower. Nonetheless, the entire trade setup stands intact, except bulls have given control back to bears, and now the market anticipates at least a 25 percent decline.
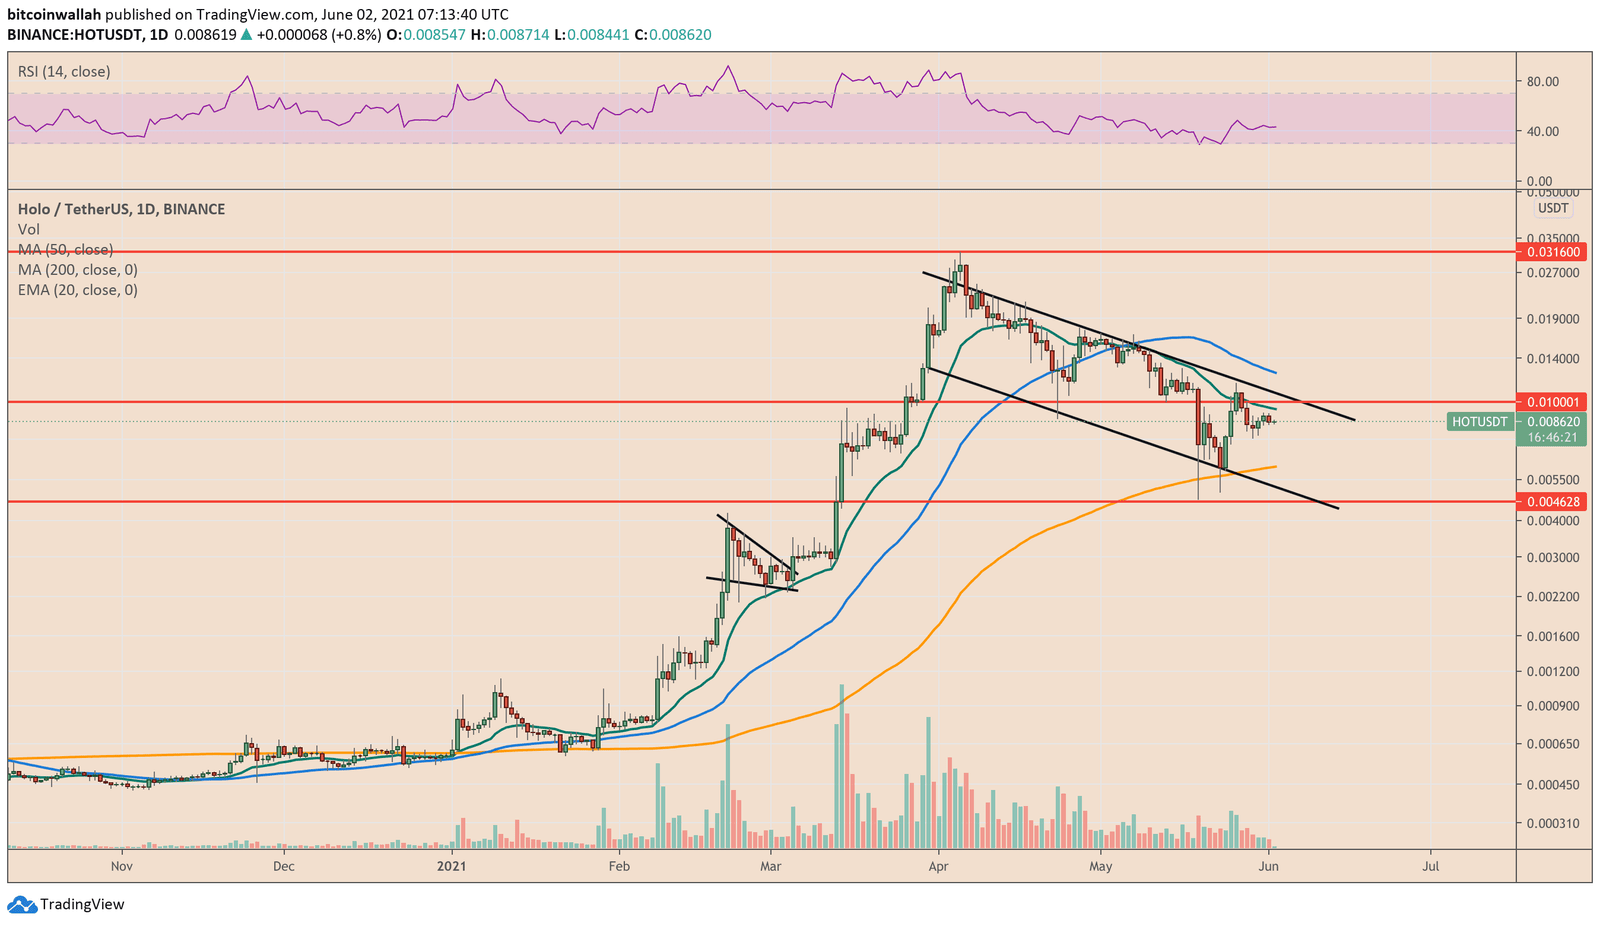
The reason why HOT/USDT looks short-term bearish is its latest retracement from its prevailing upside move. The said pullback appeared after the pair tested a falling trendline that constitutes a Descending Channel. HOT has lately managed to fluctuate inside the declining parallel structure, raising enough opportunities for both bears and bulls to secure interim profits from intra-range trades.
The same strategy holds valid as the Holo token experiences sell-off near the range resistance. It points to an extended bearish correction, with a sequence of downside levels posing as targets for short positions. However, the deepest level area appears anywhere between the 200-day simple moving average (200-day SMA; the orange wave) and the range support, which coincides with $0.0046.
Read more: Holo (HOT) Follow Up 08: Even Elon Musk Couldn’t Crash It
Interim downside targets to watch out for are between $0.006 and 0.008. The range has a history of trapping HOT prices during their uptrends and downtrends. That now serves as a low-risk short position target area.
Holo Bullish Setup, Meanwhile
Resistances look stronger on Holo daily charts.
The HOT/USD rate eyes a clear break above resistance confluence described by the 20-day exponential moving average (20-day EMA; the green wave) and the Descending Channel’s upper trendline. At best, a sustainable buying momentum could push the pair’s bids towards the 50-day simple moving average (50-day SMA; the blue wave), which sits around $0.012.

… [Trackback]
[…] Find More to that Topic: coinchapter.com/holo-hot-follow-up-10-bears-taking-charge-to-crash-prices-by-25/ […]
… [Trackback]
[…] Read More on to that Topic: coinchapter.com/holo-hot-follow-up-10-bears-taking-charge-to-crash-prices-by-25/ […]
… [Trackback]
[…] Read More on that Topic: coinchapter.com/holo-hot-follow-up-10-bears-taking-charge-to-crash-prices-by-25/ […]