
Key Holo takeaways
- Holo consolidates around a dangerous resistance area.
- But the altcoin is attempting to break bullish out of the zone albeit with weaker volumes and volatility.
- Its bias now depends on how Bitcoin performs.
YEREVAN (CoinChapter.com) — Holo (HOT) stood brave near a resistance area that has notoriously crashed prices lower repeatedly since early April.
The 70th-largest cryptocurrency by market cap steadily traded sideways, showing minimal volatility in the previous eight daily sessions. On Tuesday, it was changing hands for as high as $0.0062, up only 6.77% from its sessional low of $0.0058 from June 28.
Related: Holo Price Follow Up 14: HOT rebounds 37.67% but sticks to its bearish outlook
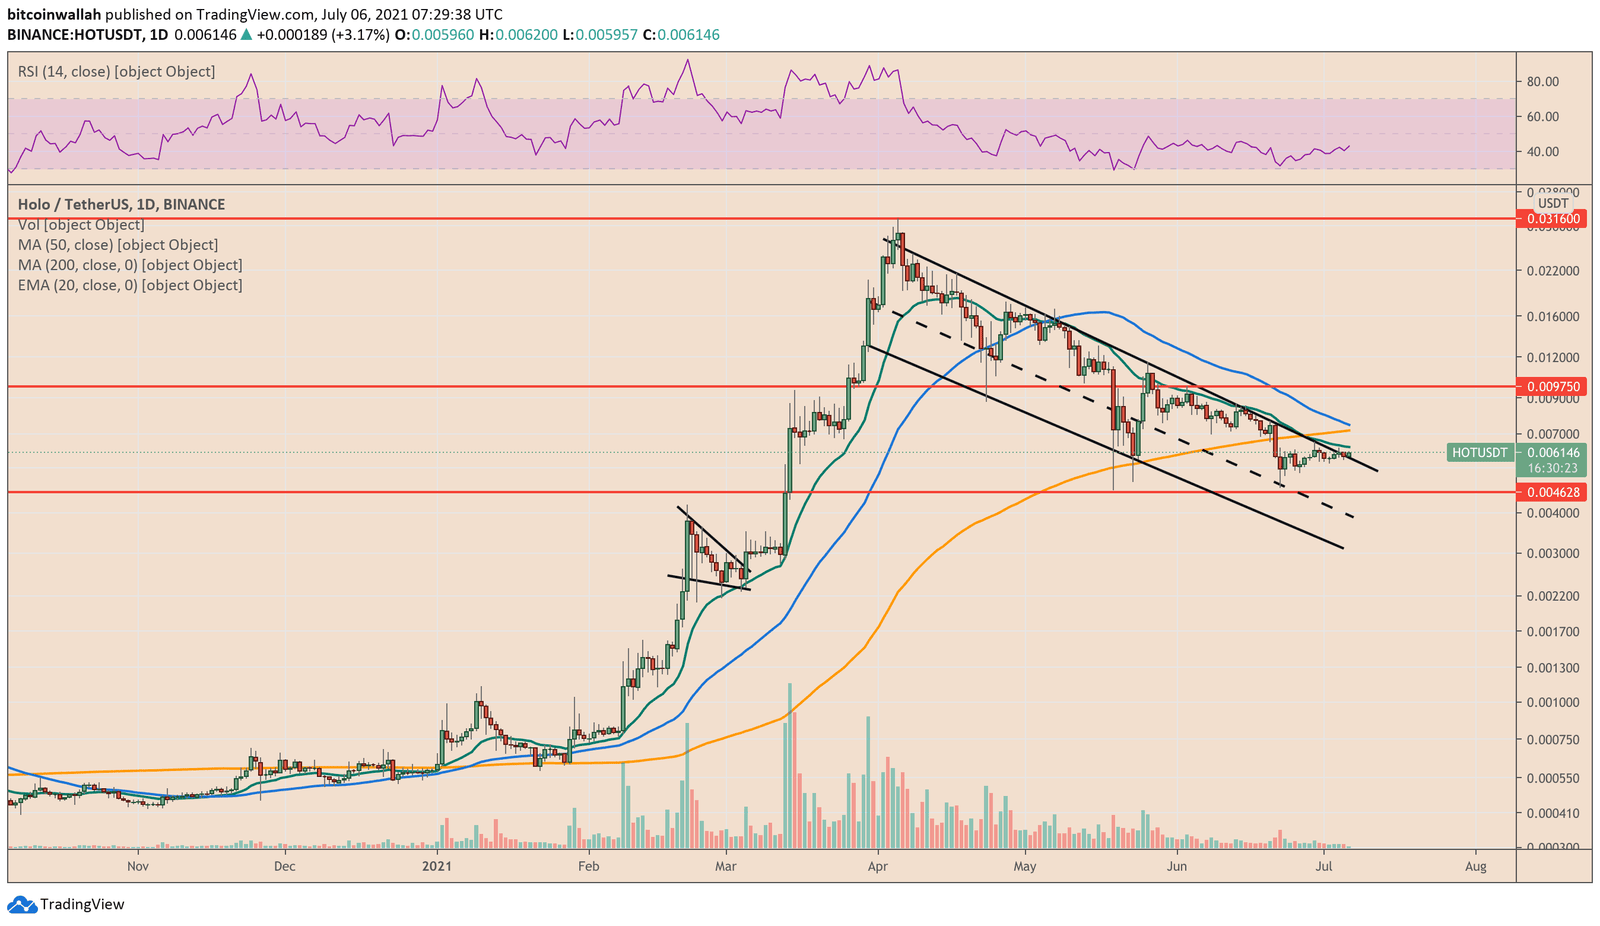
In doing so, the HOT/USD exchange rate attempted to break above a descending trendline resistance that comes as a part of a Falling Channel pattern. The said downward slope was instrumental in sending the pair’s bids lower. For example, HOT crashed 42% after consolidating near it between June 15 and June 21. The token declined by up to 34.68% only three days after testing the trendline as resistance on May 26.
It is visible that bulls go cold-feat near the pro-bearish Channel resistance. Meanwhile, they regain confidence as the HOT/USD rates correct to a suitable support level, i.e., the lower trendline of the Falling Channel pattern. So far, the pair’s rangebound price action has helped bulls capturing smaller profits after a bounce-off from the lower trendline and has assisted bears in securing gains on a pullback from the upper trendline.
But there needs to be a breakout somewhere down the road—a move that carries Holo rates outside the Channel provided with enough volatility and higher volumes. CoinChapter.com has been discussing the scenario across its previous Holo coverages.
Tailing Bitcoin
We have also discussed Holo’s tendency to tail Bitcoin price trends, noting that a major move in the flagship cryptocurrency’s market—be it bullish or bearish—could leave altcoins like HOT in a similar upside or downside trajectory.
Bitcoin prices have stabilized above $34,000 in the running week. On-chain projections provided by analyst Willy Woo notes that a Bitcoin supply shock is in play despite fears that the cryptocurrency would crash to $20,000.
Related: Bitcoin prices set to explode higher on 2020-like supply shock divergence
“The coins that were dumped by whales onto speculators are now being absorbed by long-term holders. We are now at supply shock levels last seen when the price was at $50k,” Woo wrote in his latest newsletter, adding:
“We seldom see these divergences where coins are removed from the market without price action reflecting this. It’s likely only a matter of time before the market figures out the coins are drying up. A great opportunity is at hand.”
Does that mean the same for Holo? Most likely.
Death cross
The HOT/USDT exchange rate has been attempting to break out as it consolidates near the descending trendline. On Tuesday, it managed to break above but lacked volumes that could guarantee a strong follow-through to the upside. Traders appear fearful about entering fresh long targets at the current entry levels. But an upside in the Bitcoin market can change sentiment across the Holo and the rest of the altcoin market.
On the flip side, the daily moving averages on the Holo chart are looking to form a Death Cross. Death Crosses appear when—typically—an asset’s 50-day simple moving average crosses below its 200-day simple moving average. The blue and the orange wave in the chart above hints at such a crossover in the coming daily sessions.
Related: Holo Price Follow Up 14: HOT/USDT charts say it’s a “buy”
But there is one catch. A 50-200 SMA death cross is generally a lagging indicator. So it might be possible that the market has already factored the bearish bias—and that the path of least risk is now to the upside.
Nevertheless, traders should place stop losses against the direction of their bias to minimize their losses, should there be a surprising bias reversal event.
That’s all for today, folks!

… [Trackback]
[…] Read More on that Topic: coinchapter.com/holo-price-follow-up-15-mini-bullish-breakout-appears-despite-bearish-cross-fears/ […]
… [Trackback]
[…] Find More to that Topic: coinchapter.com/holo-price-follow-up-15-mini-bullish-breakout-appears-despite-bearish-cross-fears/ […]
… [Trackback]
[…] Read More Info here on that Topic: coinchapter.com/holo-price-follow-up-15-mini-bullish-breakout-appears-despite-bearish-cross-fears/ […]
… [Trackback]
[…] There you can find 78861 more Info to that Topic: coinchapter.com/holo-price-follow-up-15-mini-bullish-breakout-appears-despite-bearish-cross-fears/ […]
… [Trackback]
[…] Read More on that Topic: coinchapter.com/holo-price-follow-up-15-mini-bullish-breakout-appears-despite-bearish-cross-fears/ […]
… [Trackback]
[…] Find More Information here on that Topic: coinchapter.com/holo-price-follow-up-15-mini-bullish-breakout-appears-despite-bearish-cross-fears/ […]
… [Trackback]
[…] Find More on on that Topic: coinchapter.com/holo-price-follow-up-15-mini-bullish-breakout-appears-despite-bearish-cross-fears/ […]