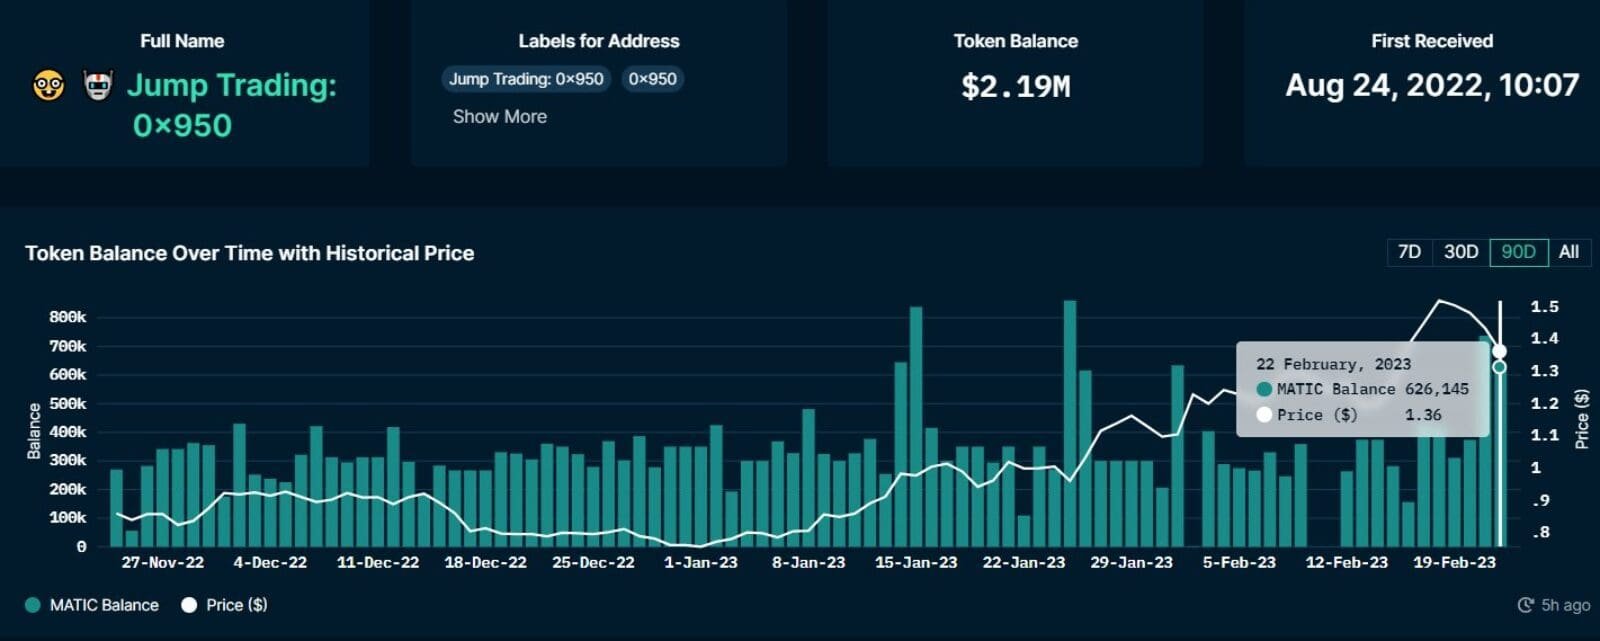
NEW DELHI (CoinChapter.com) — Jump Trading, a data, and research-driven trading firm, has increased its MATIC holdings over the past three months. Andrew T, an analyst at Nansen, shared the information in a tweet.
Andrew noted that Jump Trading’s crypto arm increased its MATIC position by nearly 400,000 tokens. The firm usually kept about 300,000 MATIC tokens for daily trading. However, on Feb 22, Jump’s MATIC wallet spiked to 740,000 tokens.
The Nansen analyst noted that the acquisition was very profitable for Jump Trading, with the firm gaining around $160,000 trading around the position.
Polygon has enjoyed increased investor interest in its developing ecosystem, rallying 80.5% YTD on Feb 23.
Polygon set the launch date of the beta mainnet of its zkEVM (zero knowledge Ethereum Virtual Machine) on Mar 27. The team noted that the zkEVM testnets attracted “unprecedented interest” from developers in the Polygon ecosystem.
Moreover, Polygon has witnessed increased NFT activity, with weekly volumes on Polygon marketplaces rising since Oct 2022. Recently, Shemaroo announced the launch of its NFT marketplace on the Polygon network.
Also Read: Russia Quits Nuclear Arms Control Treaty with United StatesMATIC price confirmed a bullish technical pattern earlier in February but is now moving into a bearish pattern.
MATIC Price Moving Inside Bearish Wedge Pattern
The chart below shows that the MATIC price moves inside a bearish pattern called the Rising wedge. In detail, two up-sloping converging trend lines that connect a price series’s respective highs and lows form a rising wedge pattern. A bearish pattern can be a continuation or a reversal pattern.
Unfortunately, MATIC’s rising wedge is a reversal pattern, sloping up with the prevailing trends.
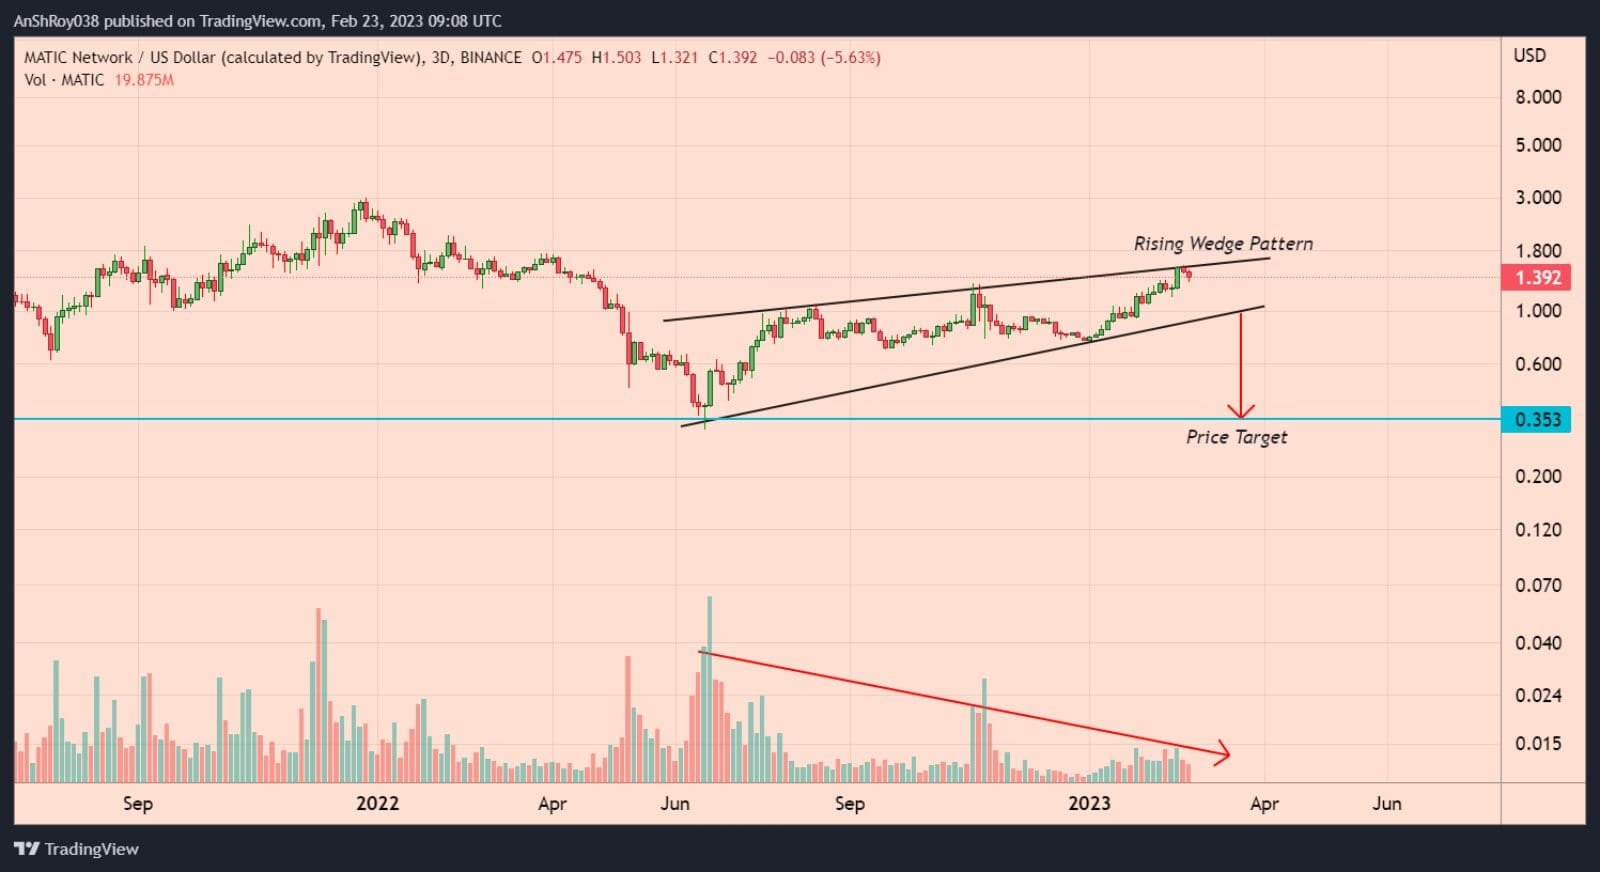
Declining trading volumes often accompany a breakdown below the pattern. The price target of the pattern is equal to the height of the back of the wedge. Therefore, MATIC’s price might fall 75% to $0.35 if Polygon confirms the pattern.
Momentum Oscillator Turns Bearish
The Polygon token price has been trending downwards since Feb 18, falling nearly 15% to form a daily low near $1.34 on Feb 23. Long upper wicks on consecutive daily candles highlight the bearish pressure against the MATIC/USD trading pair.
The momentum oscillator MACD charted a bearish crossover for the MATIC token on Feb 23. The pattern forms when the MACD line (between 12-day and 26-day EMA) moves below the MACD signal line (9-day EMA of MACD).
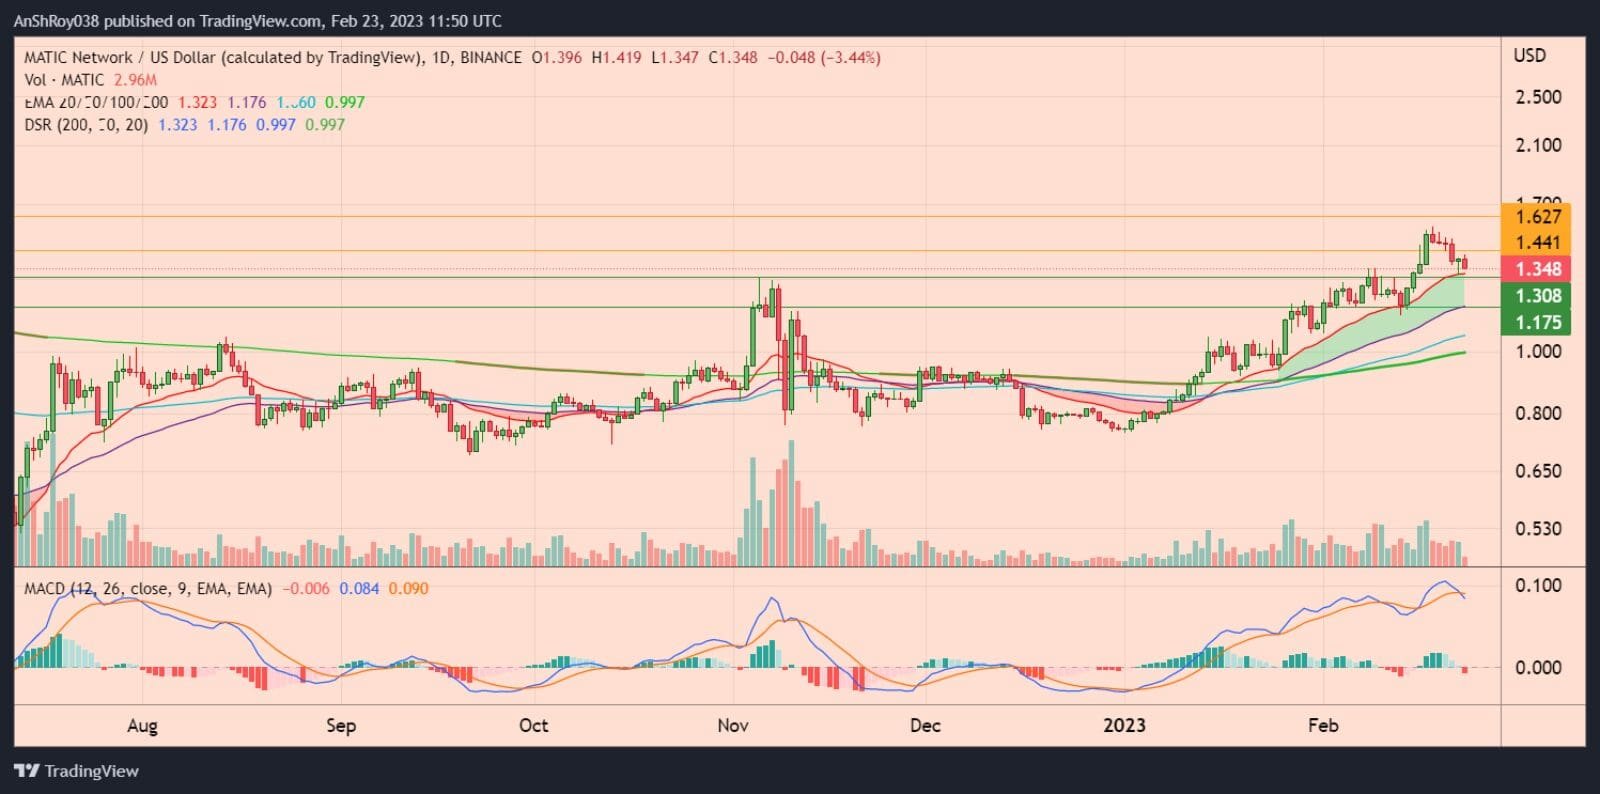
If MATIC continues shedding its prices, the Polygon token price might drop to test its 20-day EMA (red wave) support near $1.31. Breaching the immediate 20-day EMA support would likely force MATIC’s price to fall to $1.17 before recovering.
On the other hand, should buyers move in, Polygon’s price would likely try to flip resistance near $1.4. Moreover, a break and hold above immediate resistance might increase the MATIC token price to $1.63 before downside corrections pare gains.

… [Trackback]
[…] Read More on on that Topic: coinchapter.com/jump-trading-buys-40k-matic-as-polygon-token-forms-bearish-pattern/ […]
… [Trackback]
[…] Info to that Topic: coinchapter.com/jump-trading-buys-40k-matic-as-polygon-token-forms-bearish-pattern/ […]
… [Trackback]
[…] Info to that Topic: coinchapter.com/jump-trading-buys-40k-matic-as-polygon-token-forms-bearish-pattern/ […]
… [Trackback]
[…] Read More Info here to that Topic: coinchapter.com/jump-trading-buys-40k-matic-as-polygon-token-forms-bearish-pattern/ […]