
Key Takeaways:
- KuCoin Token prices have jumped over 56% in less than 18 days.
- The KCS token might paint a bullish technical pattern soon.
NEW DELHI (CoinChapter.com) — Cryptocurrency exchange KuCoin’s namesake crypto, KuCoin Token (KCS), has charted a recovery rally that brought the token’s prices back to price levels they were on before Jan 21’s market crash.
The KuCoin token dropped nearly 23.5% between Jan 21-22. KCS’s price action then charted higher lows as the token started recovering. After the wider crypto market started recovering on Feb 3, KuCoin Token prices moved upwards as well.
The KCS token has jumped 21% to reach a high of $20.96 on Feb 9, from a low of $17.3 on Feb 3.

The long wick on the KuCoin token’s Jan 22 candle indicates aggressive buying from bulls as prices pulled lower. Moreover, the pattern is repeated on other days, indicating that the traders are bullish about the KCS token.
Also Read: Cosmos (ATOM) eyes a 15% decline on an overall bullish setup.The current uptrend has brought KCS prices near their 100-day moving average. The 100-day MA trendline acts as immediate resistance near $21.4, a price level that KCS has failed to conquer since Jan 6.
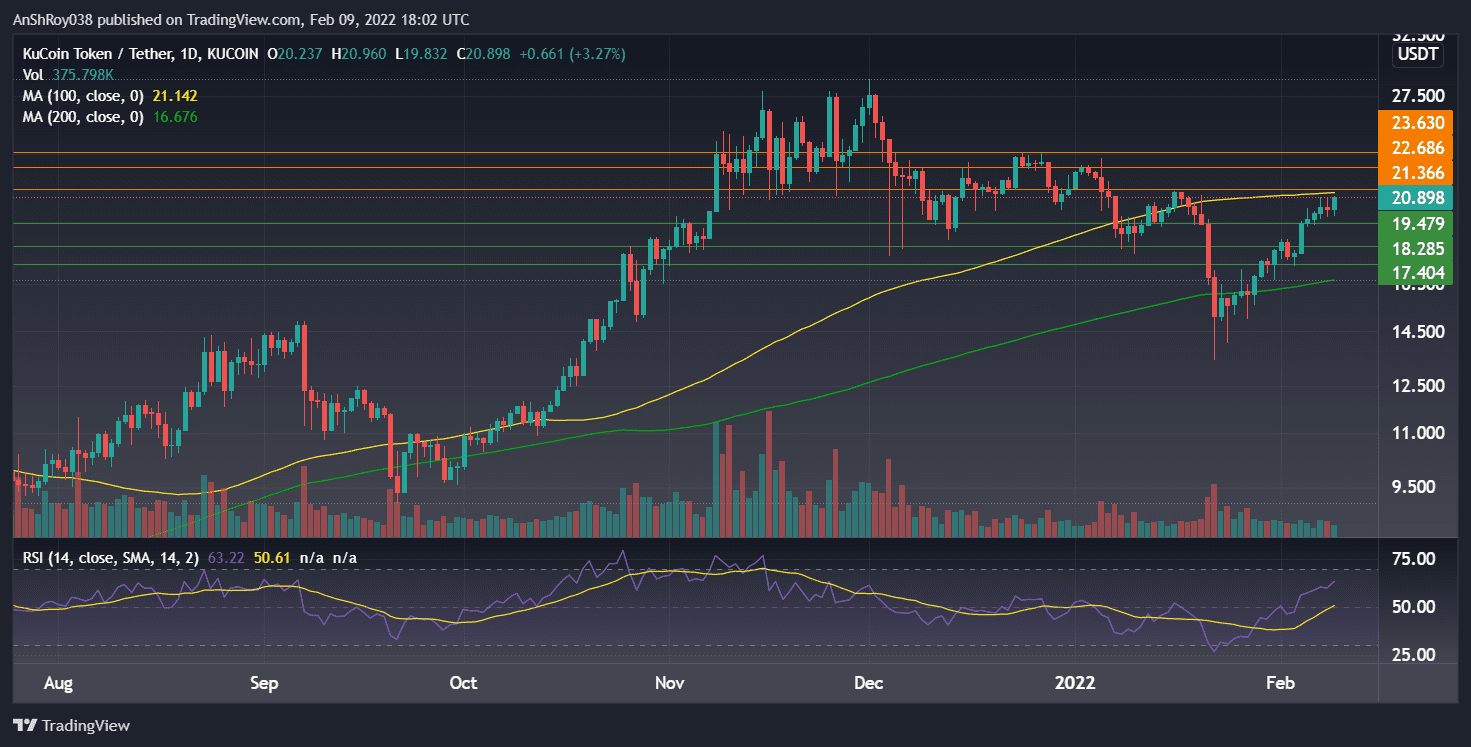
Although KCS prices have been consolidating since Feb 5, a strong buying spree from bulls could propel the KuCoin token to challenge the $22.7 resistance level. If it flips $22.7 resistance, KCS would likely target $23.6 resistance before prices pull back.
Meanwhile, while RSI is currently neutral, with a value of 63.22, the token’s relative strength index is steadily heading towards the overbought border.
KuCoin Likely To Paint Bullish Cross
KuCoin’s 26-day EMA and 50-day MA lines are moving to paint a bullish technical pattern called a golden cross. In detail, a golden cross occurs when a token’s short-term moving average (26-day EMA in this case) moves above its relatively long-term moving average (50-day MA here).
The golden cross could further boost KuCoin token prices. However, if traders start selling once KCS’s RSI becomes overbought, prices could fall to support near its 50-day MA line at $19.5. In addition, profit-booking from bears could pull prices down to support at $18.3.
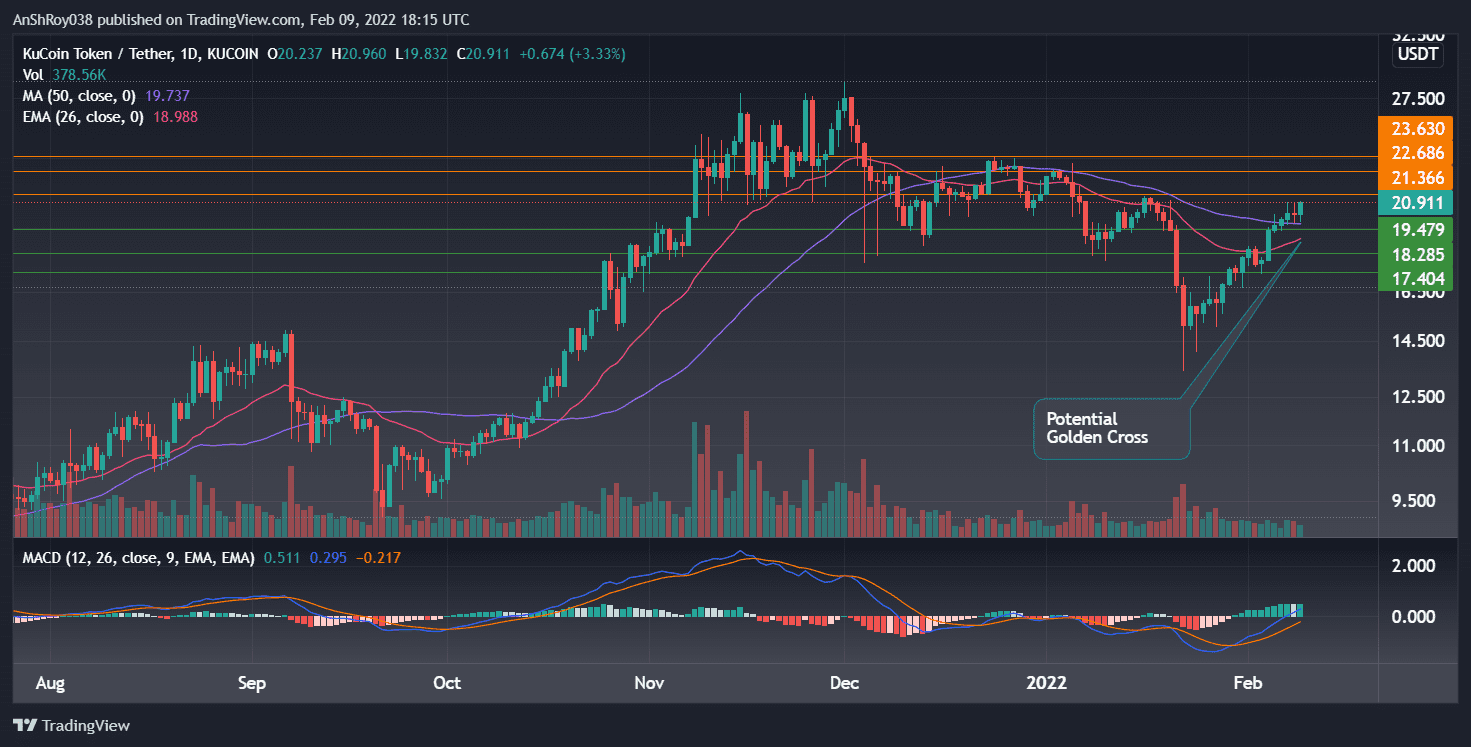
If KuCoin blows past the first two supports, bulls will try to rally above support $17.4, the price level from which KCS started its current uptrend.
Also Read: Moonbeam’s GLMR token price jumps 20,300% after listing on Binance and KuCoin.Trend-based momentum oscillator MACD continues to be bullish for KCS. The technical indicator charted a bullish crossover for the KuCoin token on Jan 30.
A bullish crossover occurs when the MACD line (difference between 12-day and 26-day EMA) moves above a token’s MACD signal line (9-day EMA of MACD). The pattern indicates an asset’s price momentum is leaning towards the bulls.
At the time of writing, KCS was changing hands at $20.9, up 3.21% on the day.

… [Trackback]
[…] Find More to that Topic: coinchapter.com/kucoin-kcs-jumps-more-than-56-likely-to-paint-a-bullish-pattern-soon/ […]
… [Trackback]
[…] Read More on on that Topic: coinchapter.com/kucoin-kcs-jumps-more-than-56-likely-to-paint-a-bullish-pattern-soon/ […]
… [Trackback]
[…] Find More Info here to that Topic: coinchapter.com/kucoin-kcs-jumps-more-than-56-likely-to-paint-a-bullish-pattern-soon/ […]