

Key Takeaways:
- The top four artificial intelligence (AI) coins have been bleeding over the past seven days.
- AI tokens likely followed the wider market trend.
NEW DELHI (CoinChapter.com) — Artificial Intelligence (AI) coins seem to be having a bit of bad luck, with the top four AI tokens (by market cap) dropping an average of 10.5% over the past seven days.
Bitcoin (BTC) price dropped below $30,500, despite the US Securities and Exchange Commission’s former chairman Jay Clayton stating that the regulatory body should approve a Bitcoin ETF.
We have institutions that know markets better than anybody, and they are putting their names and reputations behind bitcoin. I find that remarkable.
Jay Clayton saidApart from Bitcoin, the top 20 crypto tokens also had a dismal run on July 10, with most of them registering only minor gains.
The AI tokens registered minor gains as bulls struggled to gain some ground, but the overall rally remained muted.
GRT Price Continues Crabbing Inside A Bullish Pattern
Decentralized data storage platform The Graph Protocol’s native token GRT has formed a bullish pattern called the ‘Bull Flag Pattern.‘
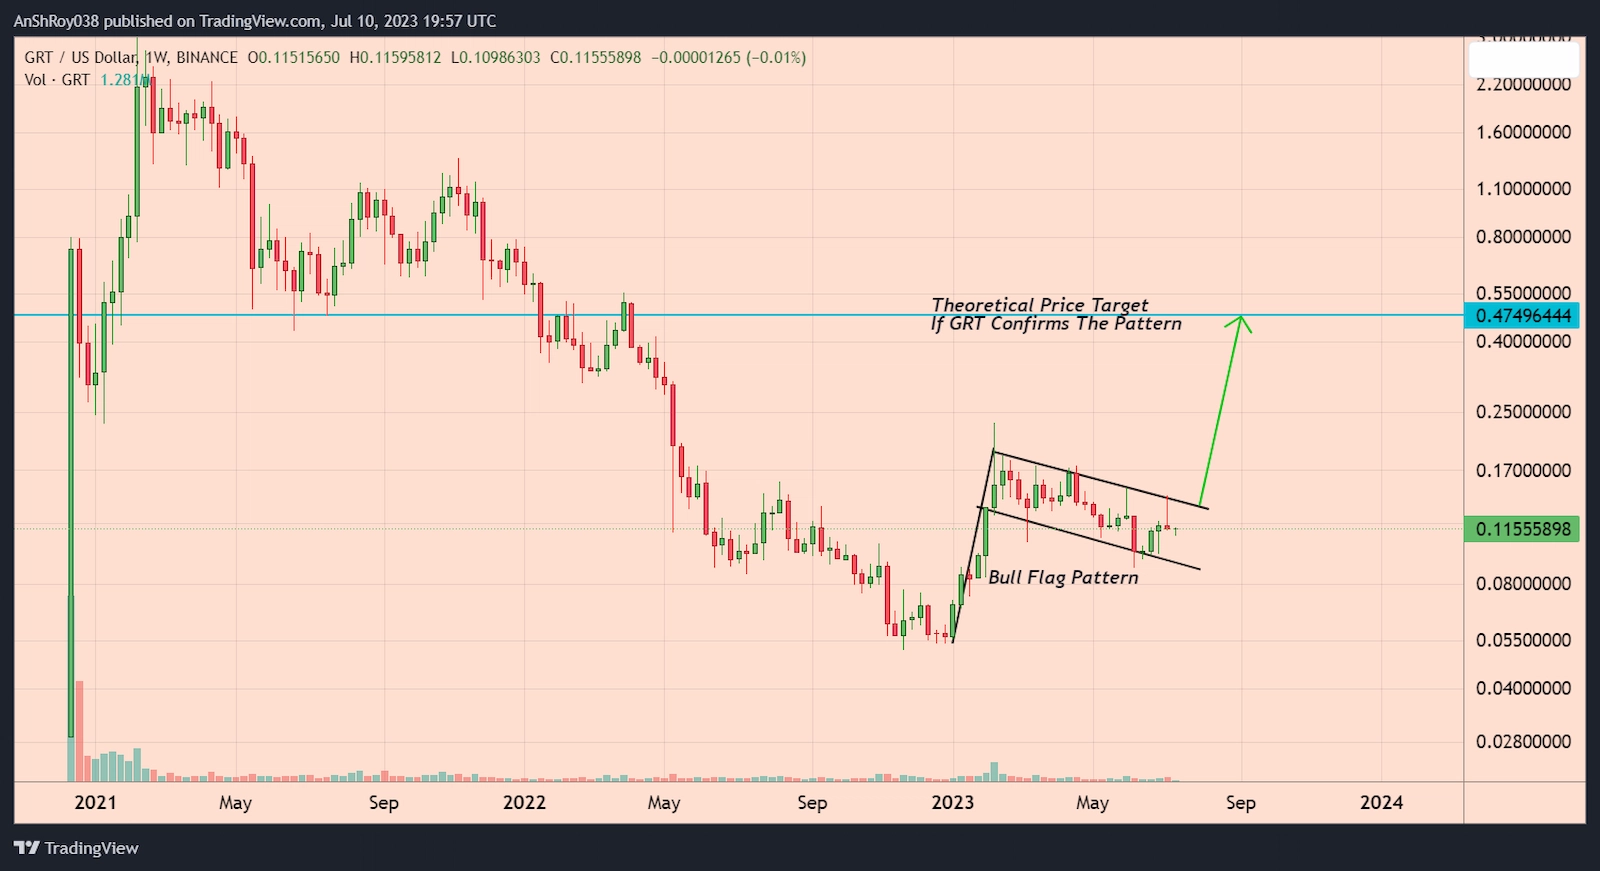
Bull flags consist of a flag pole, resulting from a near-vertical rise in the crypto token’s prices. Assets in a strong uptrend often form the pattern.
A period of consolidation succeeding the steep uptrend forms the flag of the pattern. Despite the strong vertical rally, the asset price does not drop as bulls maintain the buying pressure. As a result, the breakout from the flag pattern often results in a powerful uptrend.
Traders calculate the price target of the breakout by adding the length of the flag pole to the breakout price level. Per the rules of technical analysis, GRT price might rally 317% to reach $0.475 if the AI token confirms the pattern.
AI Token GRT Bulls Fighting To Hold Above EMA Support
Meanwhile, GRT token price dropped 6.5% on July 10, forming a daily low near $0.10986. However, the bulls recovered some of the day’s losses, aggressively defending the 20-day EMA (red wave) support.
Furthermore, long upper wicks on the daily candles underscore the bearish pressure against the GRT token.
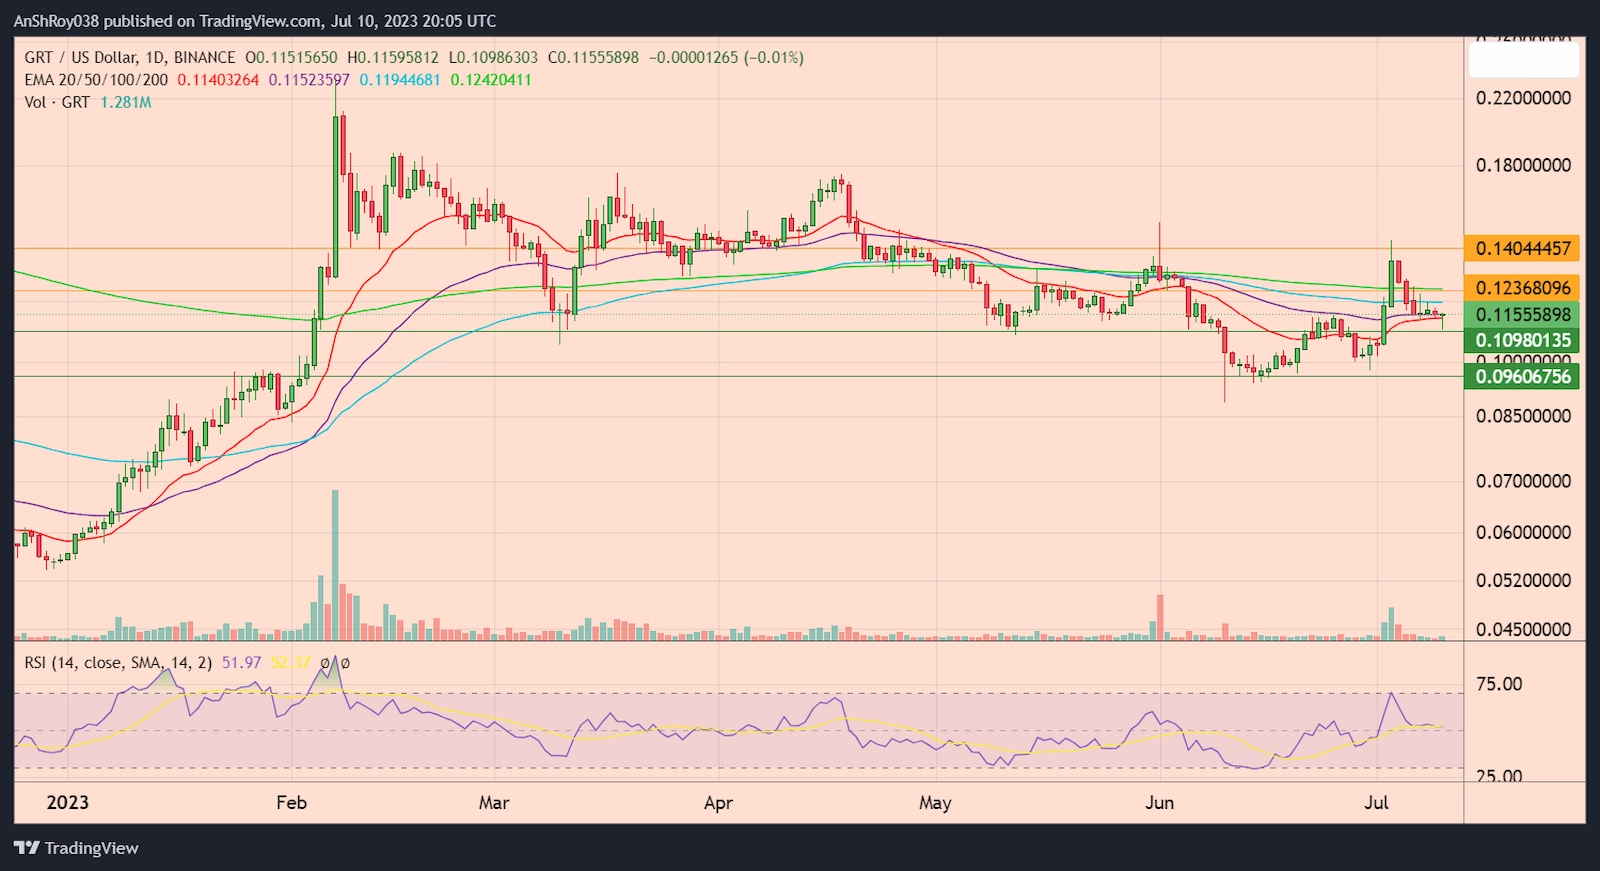
However, should the EMA support fail, the AI coin price might drop to the support level near $0.1098. Moreover, breaching the immediate support level might result in GRT price falling to the $0.096 support level before recovering.
On the other hand, a breakout would require bulls to flip the 200-day EMA (green wave) resistance near $0.124 to instill confidence in the Artificial Intelligence coin’s price rally.
Furthermore, breaking and consolidating above the immediate resistance might help GRT price might challenge resistance near $0.14 before downside corrections pare gains.
The RSI for GRT remained neutral, with a value of 51.97 on the daily charts.
RNDR Price Fails Arrests Downtrend
Decentralized GPU-based rendering solution Render Network’s native token RNDR has been struggling to conquer the 100-day EMA (blue wave) trendline. As a result, the AI coin dropped over 6% to reach a daily low near $1.85 before the bulls recovered some of the lost ground.
Recent long upper wicks on the daily candles highlight the bearish pressure against the token. In case of an uptrend, RNDR price would need to flip the 50-day EMA (blue wave) resistance near $2.08 to infuse confidence in the rally.
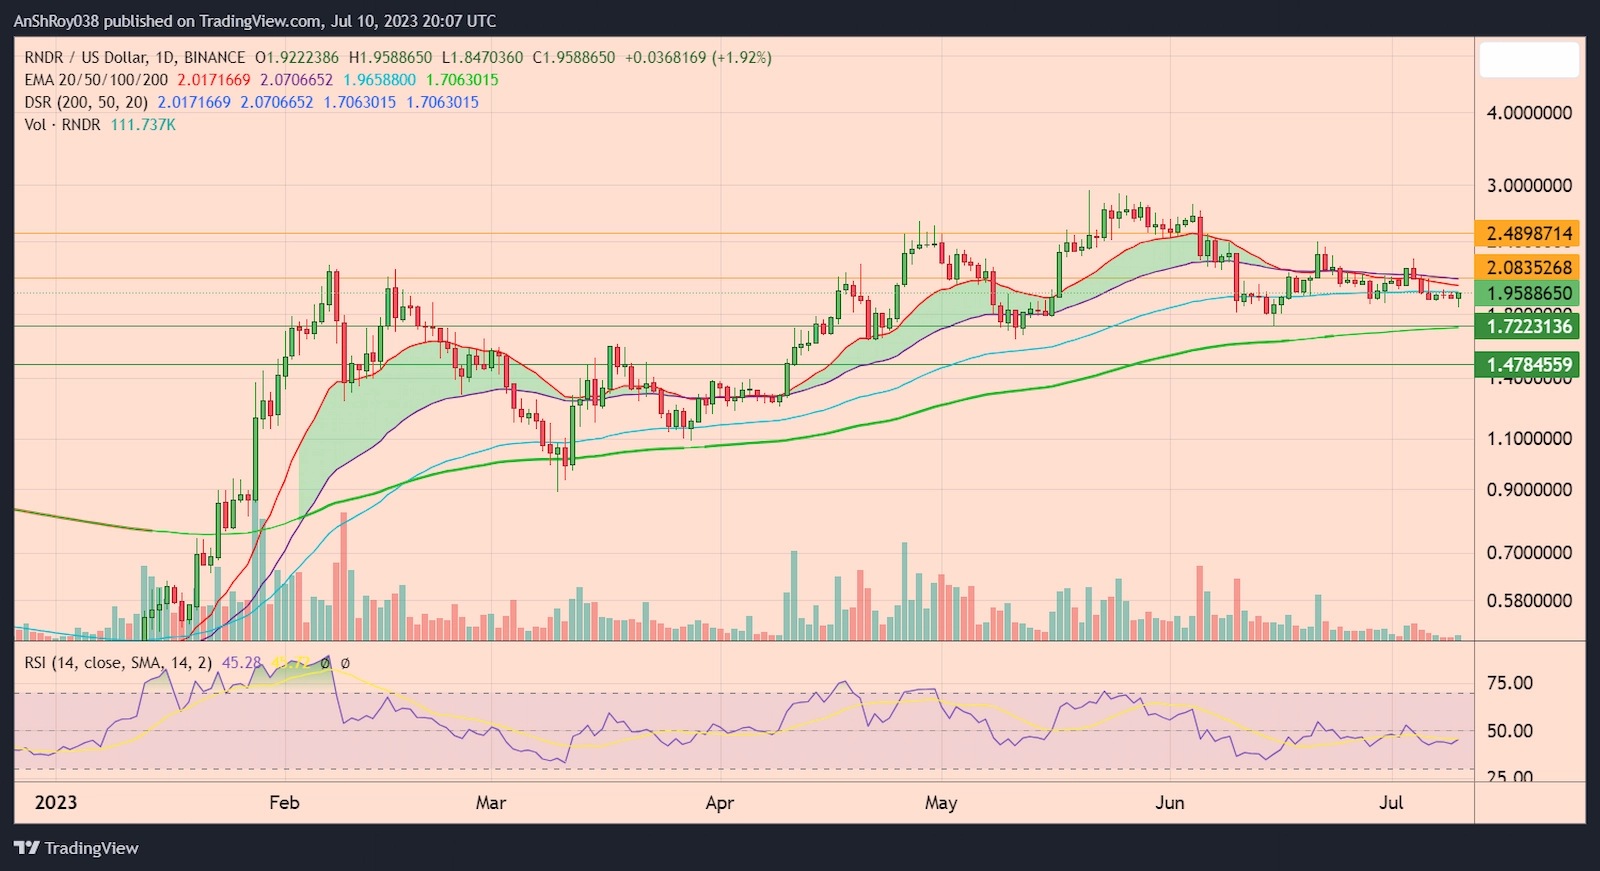
Additionally, breaking and consolidating above the immediate resistance might help the artificial intelligence coin price challenge the resistance near $2.5 before retreating.
However, should the bears gain the upper hand, RNDR price might be forced to test the 200-day EMA (green wave) support near $1.72. Moreover, breaching the EMA support would result in the AI token price dropping to the support near $1.48 before recovering.
The relative strength index for RNDR remained neutral, with a value of 45.28 on the daily charts.
AI Coin INJ Price’s Weekend Rally Falters
Injective Protocol’s native token INJ had a weekend rally that failed to last long. On July 10, the AI coin price dropped 6% to reach a daily low near $7.8 before recovering some of the losses. It seems INJ bulls are aggressively defending the 20-day EMA (red wave) trendline support.
However, the bears would likely try to breach the 20-day EMA trendline support, resulting in INJ price falling to the 50-day EMA (purple wave) support near $7.43.
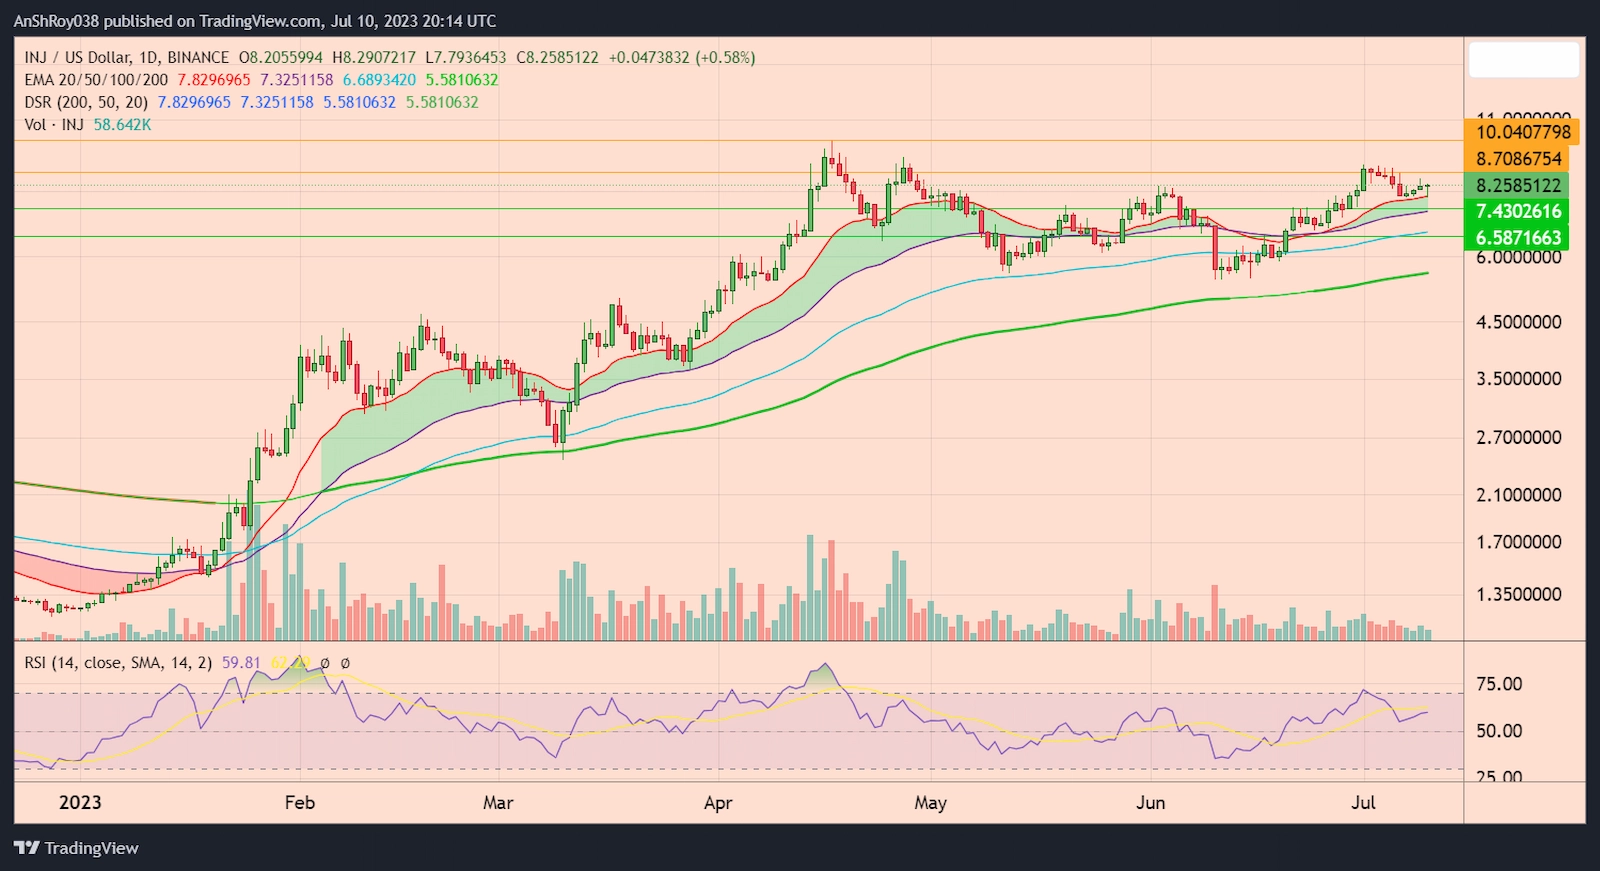
Moreover, failure of the immediate support level might result in the AI token’s price testing the support near $6.6 before recovering.
However, if the INJ token continues to consolidate, it might break out and target the resistance near $8.71. Furthermore, a break and hold above the immediate resistance could help INJ price challenge the resistance near $10.
The relative strength index for INJ price remained neutral, with a value of 59.81 on the daily charts.
AGIX Price Struggles To Show Signs Of Life
SingularityNET’s native token AGIX price has been painting weak daily candles recently, suggesting declining trader activity. It seems market participants are waiting on the sidelines to check how the token’s price action goes.
The bearish pressure against the artificial intelligence coin price resulted in AGIX recording losses for 4 consecutive months since Mar. On July 10, the token dropped over 5.5% to form a daily low near $0.23238 before bulls recovered the day’s losses.
Though the bulls are defending the lower levels of the daily candles, increasing selling pressure might result in AGIX price dropping to the support level near $0.216.
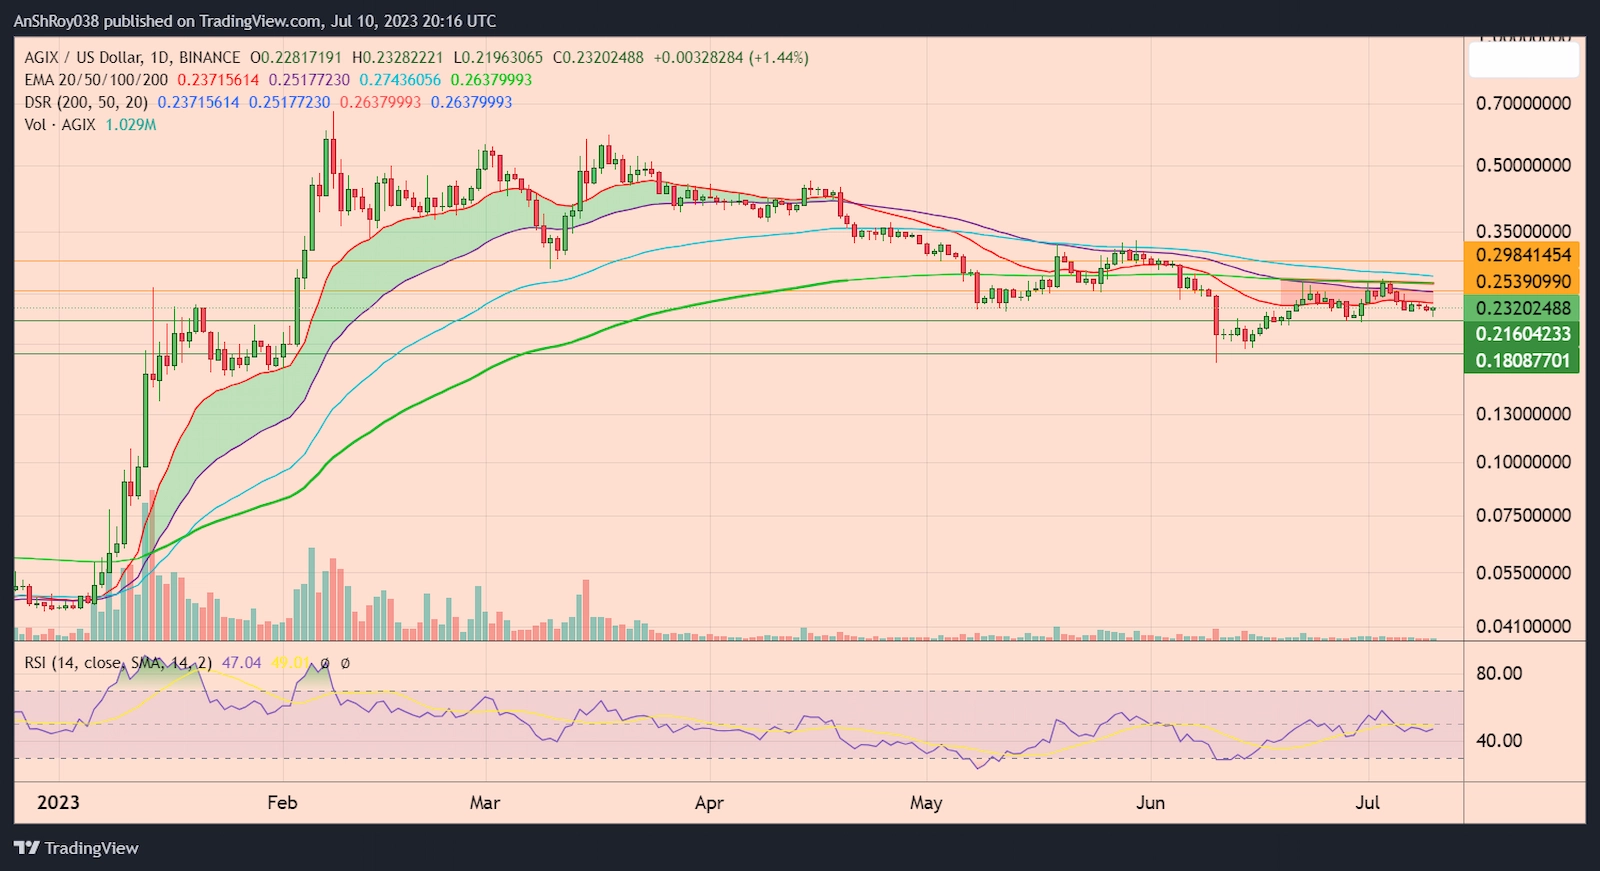
Furthermore, the artificial intelligence token price might drop to the support level near $0.181 before recovering.
On the other hand, for a strong bull run, AGIX price might be able to rise to the 50-day EMA (purple wave) resistance near $0.253.
Breaking and consolidating above the immediate resistance might help the artificial intelligence (AI) coin price break past the 100-day EMA (blue wave) and 200-day EMA (green wave) trendline resistances before challenging the resistance near $0.3.
The relative strength index for the AGIX token remained neutral, with a value of 47.04 on the daily charts.

Top cryptocurrency news sites
Bitcoin market trends
… [Trackback]
[…] Info on that Topic: coinchapter.com/top-4-artificial-intelligence-ai-coins-price-analysis-bulls-struggle-to-cope-against-the-bears/ […]
… [Trackback]
[…] Find More Info here on that Topic: coinchapter.com/top-4-artificial-intelligence-ai-coins-price-analysis-bulls-struggle-to-cope-against-the-bears/ […]
… [Trackback]
[…] Read More Info here to that Topic: coinchapter.com/top-4-artificial-intelligence-ai-coins-price-analysis-bulls-struggle-to-cope-against-the-bears/ […]
… [Trackback]
[…] Info to that Topic: coinchapter.com/top-4-artificial-intelligence-ai-coins-price-analysis-bulls-struggle-to-cope-against-the-bears/ […]