
NAIROBI (CoinChapter.com) — Nvidia’s market cap has reached $3.34 trillion, surpassing Apple Inc. and Microsoft Corp. This growth aligns with the increasing demand for artificial intelligence (AI), impacting the AI cryptocurrency market and the performance of AI coins.
“Nvidia’s $3.34 trillion market cap surpasses the GDP of all but 5 countries. Each GPU holds 0.1 to 0.3 grams of gold, but not a single Satoshi.”
Peter Schiff posted on X
Nvidia’s Market Cap Surpasses $3 Trillion
Nvidia’s market cap growth reflects increased demand for its AI chips and graphics processing units. Companies like Microsoft, Meta, Amazon, and Alphabet heavily rely on Nvidia’s AI chips. Bloomberg data indicates Microsoft alone contributes 15% of Nvidia’s revenue.
The company reported $8.4 billion in net income for its 2023 fiscal year, with projections suggesting it could surpass Apple’s net income within four years.
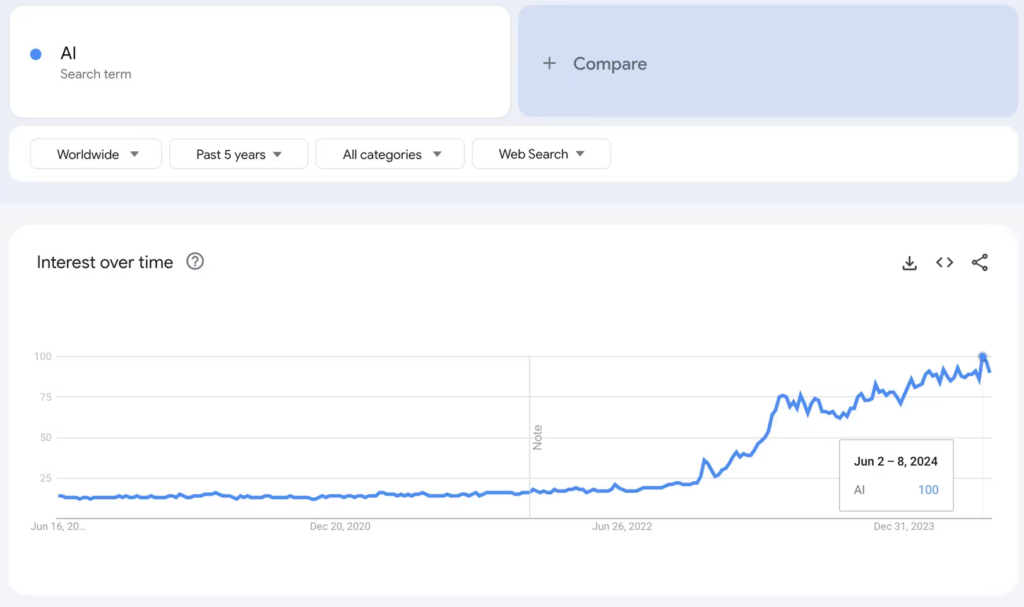
Nvidia’s market cap now exceeds the GDP of all but five countries, marking a historic financial achievement. This rise coincides with a surge in Google searches for “AI,” which reached a peak score of 100 last week, indicating heightened public interest. This growing fascination with AI has significant implications for the cryptocurrency market, particularly for AI coins.
Leading AI Crypto Coins Capitalize on the AI Boom
As AI technology gains traction, several AI crypto tokens have recorded price surges in the last 24 hours despite trading in the red over the past week. The Artificial Intelligence (AI) market cap today is $29.6 billion, reflecting a 12.9% increase in the last 24 hours. The 24-hour trading volume for AI tokens has reached $1.97 billion.
NEAR Protocol (NEAR) Shows Signs of Recovery
NEAR Protocol‘s price stands at $5.26, reflecting a 3.9% increase in the past 24 hours despite a 15.0% drop over the past week. Key support levels are at $5.00 and $4.30, while immediate resistance is at $5.50, aligning with the 0.618 Fibonacci retracement level. The RSI at 35.42 indicates oversold conditions, suggesting a potential bullish divergence and a possible price rebound.
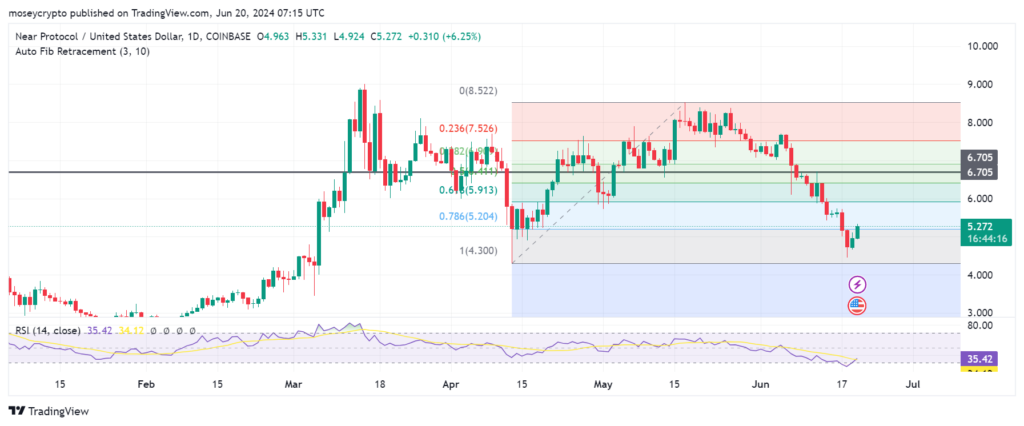
Increased trading volume signals renewed market interest, often preceding significant price movements. NEAR’s recovery depends on breaking the $5.50 resistance, with further resistance at $5.91. Market sentiment remains optimistic, with analyst Morecryptoonl predicting a potential surge to $16 in the longer term, supported by strong investor interest and activity on platforms like DappRadar.
Fetch.ai (FET) Rallies 26% Despite Bearish Sentiment
Fetch.ai (FET) is trading at $1.64, showing a 4.7% decline in the past hour but a significant 26.3% gain over the last 24 hours. The market cap is $4.16 billion, with a 24-hour trading volume of $562 million. Despite recent dips, technical indicators highlight ongoing upward momentum. The MACD line crossing above the signal line indicates a bullish trend, while the RSI at 73.51 suggests overbought conditions, hinting at a potential short-term correction.
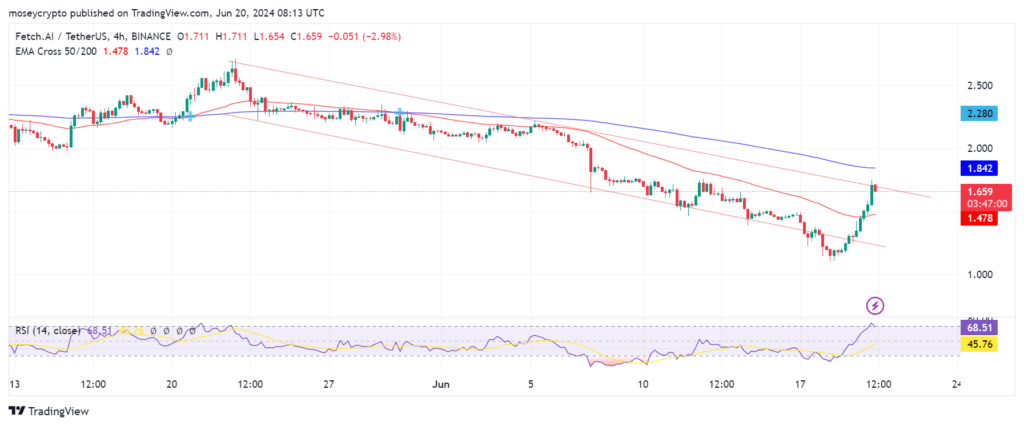
FET faces immediate resistance at $1.70, with support at $1.50. A break above $1.70 could signal continued bullish momentum while maintaining support at $1.50 is crucial for sustaining the current uptrend.
However, investor sentiment remains bearish, with the weighted sentiment indicator at yearly lows, last seen in July 2023. The impending transition of FET to ASI, alongside OCEAN and AGIX, has fueled skepticism among token holders.
ICP Price Fluctuations: Is a Major Breakout Imminent?
Internet Computer (ICP) trades at $8.61, down 0.7% in the past hour but up 2.2% over 24 hours. The market cap is $4.03 billion with a 24-hour trading volume of $93 million. Despite short-term fluctuations, ICP shows a mixed performance.
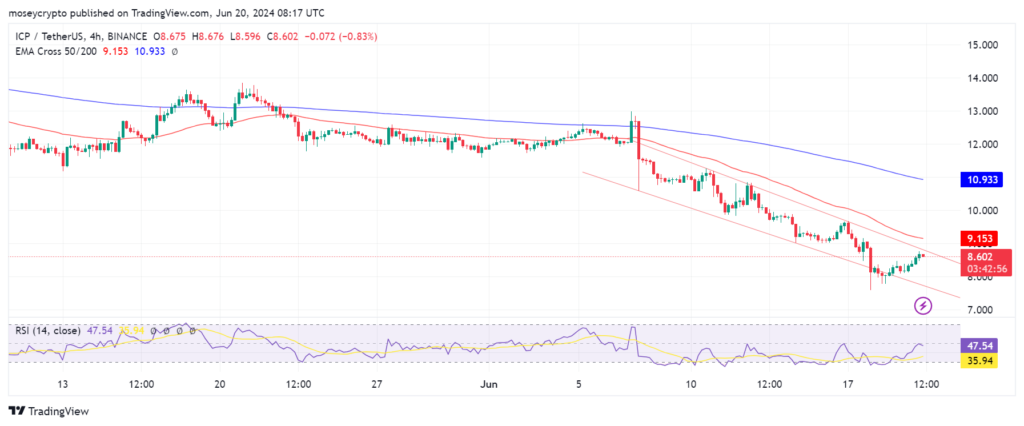
Technical indicators reveal ICP in a narrow trading range, suggesting potential consolidation. Bollinger Bands highlight resistance at $9.00 and support at $8.20. Recent charts reflect slight volatility within these levels. The MACD hints at a tentative bullish sentiment.

