
Key Takeaways:
- PEPE price gained over 10% in the last three days and settled above $0.00000850.
- There is a key contacting triangle forming with resistance at $0.00000935 on the daily chart.
- The price could continue to rise if it stays above the 50-day simple moving average (blue) and $0.00000650.

NEW DELHI (CoinChapter.com) — PEPE price is showing positive signs above the $0.00000750 support. The bulls now aim for a clear move above the $0.00000980 resistance.
PEPE Price Turns Green
In the last analysis, we saw how PEPE settled above a major bullish flag with resistance at $0.00000750 on the daily chart. The price regained strength and settled above the $0.0000080 resistance to move into a positive zone. It even outpaced Bitcoin and Ethereum in the last 3-4 days.
There was a steady increase toward the $0.000010 level. A high was formed at $0.00000983 before there was a downside correction. The price dipped below the $0.00000880 level and traded below the 23.6% Fib retracement level of the upward move from the $0.00000514 swing low to the $0.00000983 high.
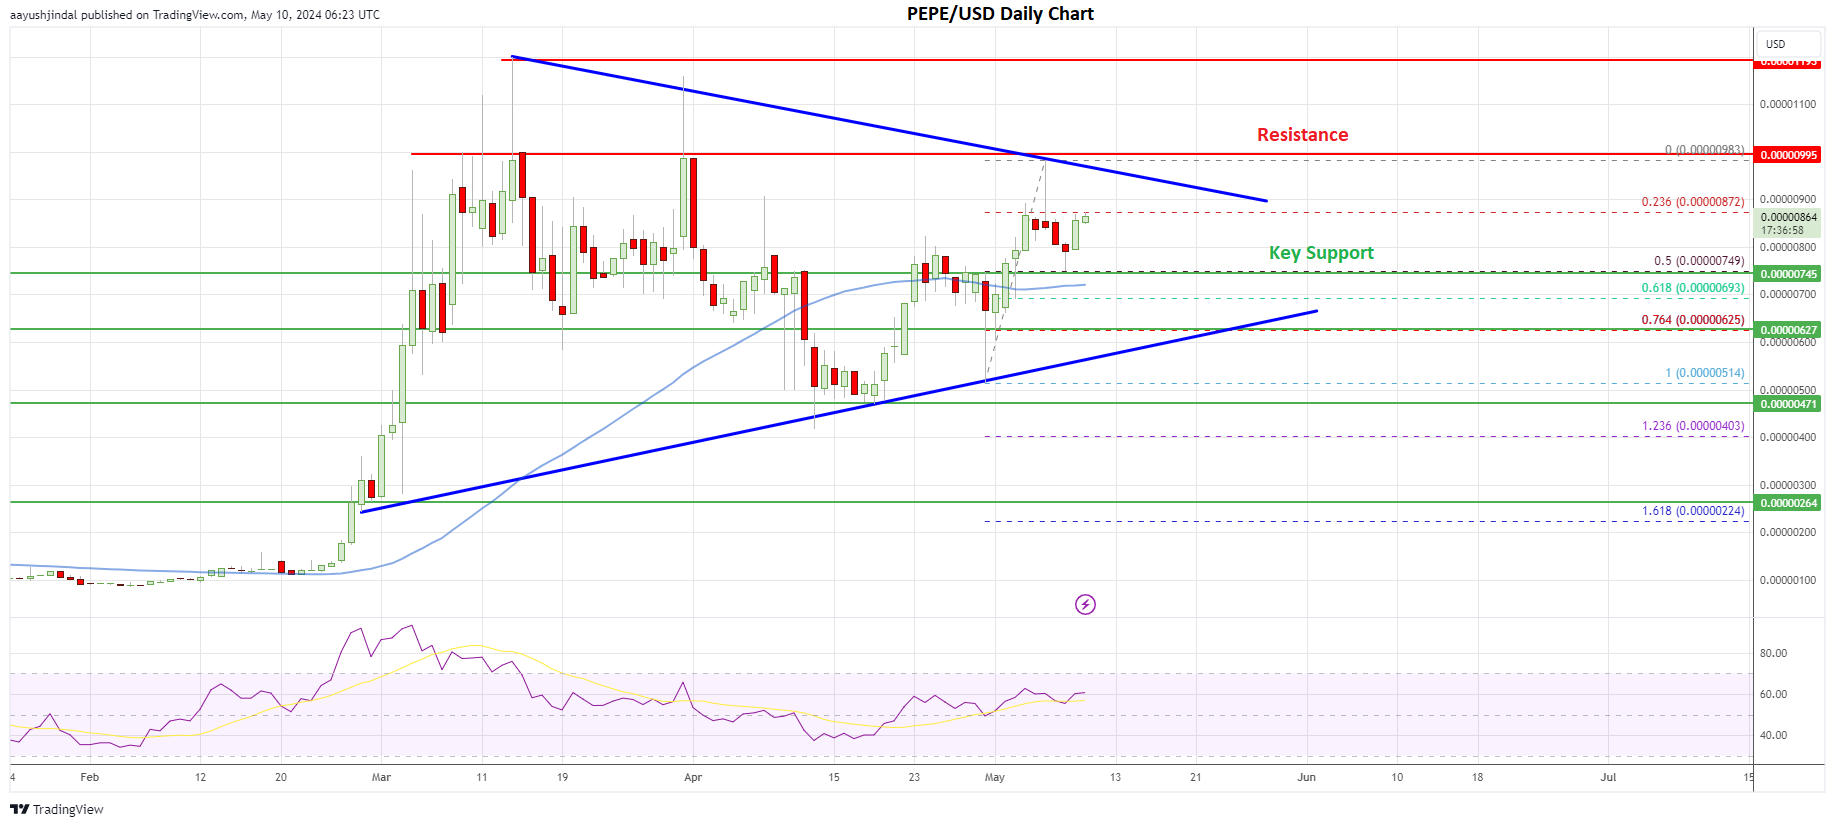
However, the bulls were active near the $0.00000750 support and the 50-day simple moving average (blue). PEPE even found bids near the 50% Fib retracement level of the upward move from the $0.00000514 swing low to the $0.00000983 high.
Recently, PEPE was featured as one of the top components in the new MarketVector Meme coin Index by Vaneck.
The price is again rising and trading above the $0.00000850 resistance. Immediate resistance is seen near the $0.0000090 zone. The first major resistance is near the $0.00000930.
There is also a key contacting triangle forming with resistance at $0.00000935 on the same chart. A close above the $0.00000935 level could set the pace for a move toward the $0.000010 resistance. The next major resistance might be near the last high at $0.0000116. A daily close above the $0.0000116 resistance zone could open the doors for a move toward the $0.0000132 level.
Another Decline?
Conversely, PEPE price might struggle near $0.00000935 and start a downside correction. Immediate support is near the $0.0000080 level. The first major support is near the $0.00000750 zone and the 50-day simple moving average (blue).
A close below the $0.00000750 support might call for a test of the triangle region at $0.00000625. If the bulls fail to protect the $0.00000625 support, there could be a larger decline. In the stated case, the price might decline toward the $0.00000480 support.
Overall, PEPE price is showing positive signs above $0.00000750. If the price stays above the 50-day simple moving average (blue), it could climb higher toward the $0.0000116 level.

