

NEW DELHI (CoinChapter.com) — Pi Network has to be one of the most boring crypto performers in 2024 so far. At around -8%, its year-to-date (YTD) performance price action is largely trailing behind the broader crypto market gains experienced by major players such as Bitcoin (+18.50%) and Ethereum (14.25%).
A technical chart analysis reveals a significant pattern that can offer insight into the asset’s current market behavior. Let’s discuss.
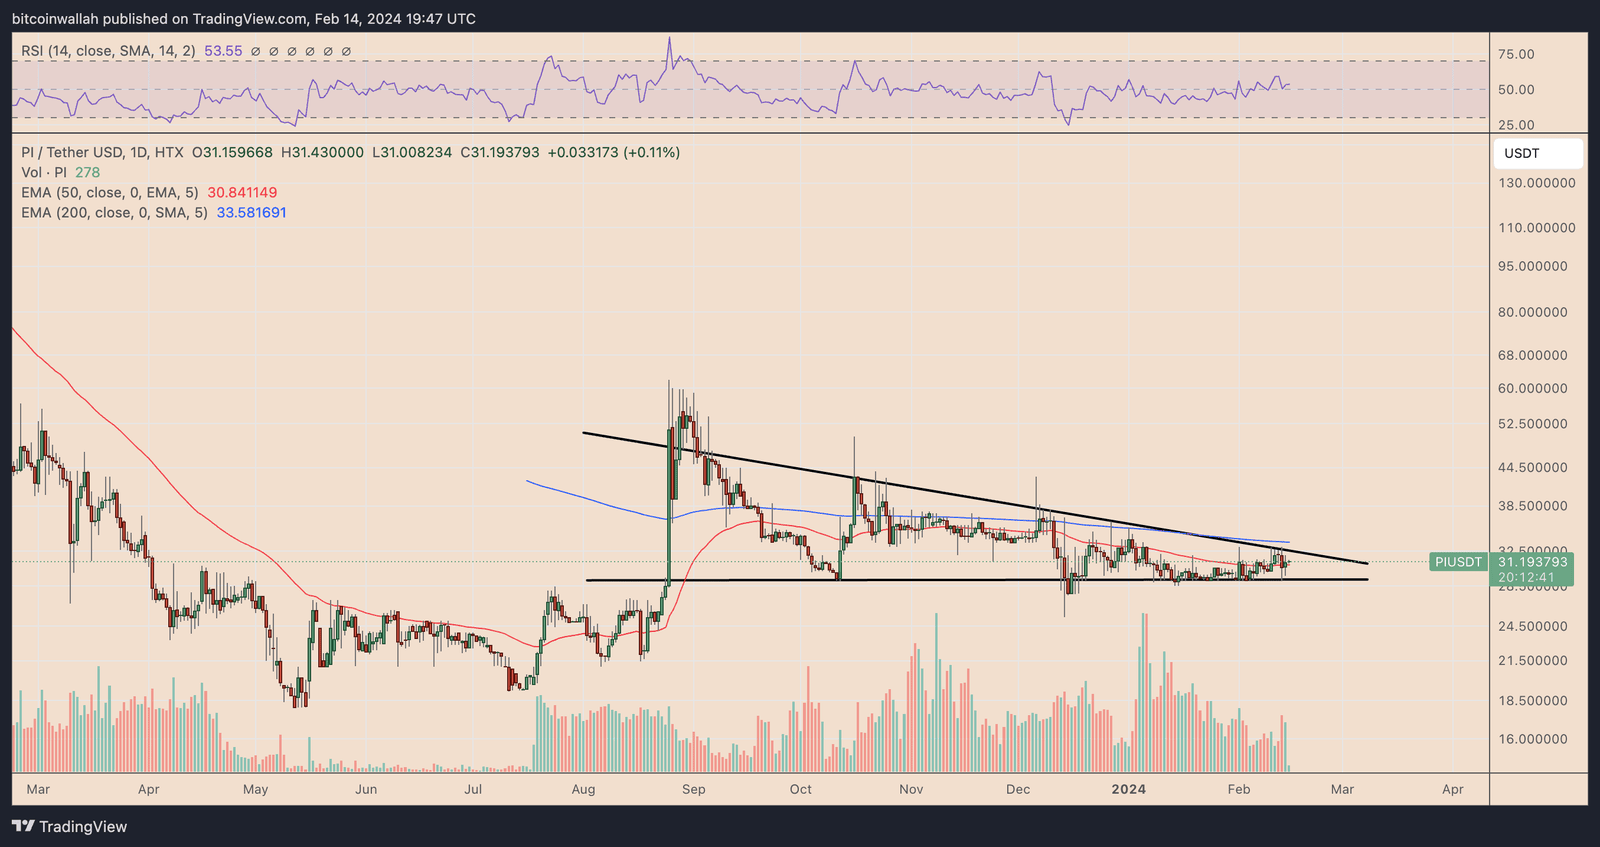
Descending Triangle Pattern
Notably, Pi Network’s native token has been trending lower inside a descending channel pattern since August 2023, characterized by a horizontal lower trendline that connects the lows and a descending upper trendline connecting the lower highs.
This downtrend occurs in the period of the crypto market’s most bullish periods in years, helped first by the speculation and then the eventual approval of spot Bitcoin exchange-traded funds (ETF).
That shows traders seldom pay attention to the latest Pi Network updates. CoinChapter regularly discusses the reasons why the Pi Network token price is down a lot. Check the entire Pi Network news catalog here.
Technically, descending triangles are bad news when they form during downtrends, i.e., their potential of sending prices lower is high. As a result, the Pi Network price can drop below its triangle’s lower trendline while eyeing $27.40, its December 2023 support level, as the next downside target by the end of February 2024.
That is down roughly 10% from current prices.
Pi Network’s Head-and-Shoulder Breakdown Underway in 2024
The Pi Network’s descending triangle downside target is one of the stops before the Pi Coin price drops further in 2024. That is due to the presence of another bearish setup dubbed the head-and-shoulders (H&S) pattern, as shown below.
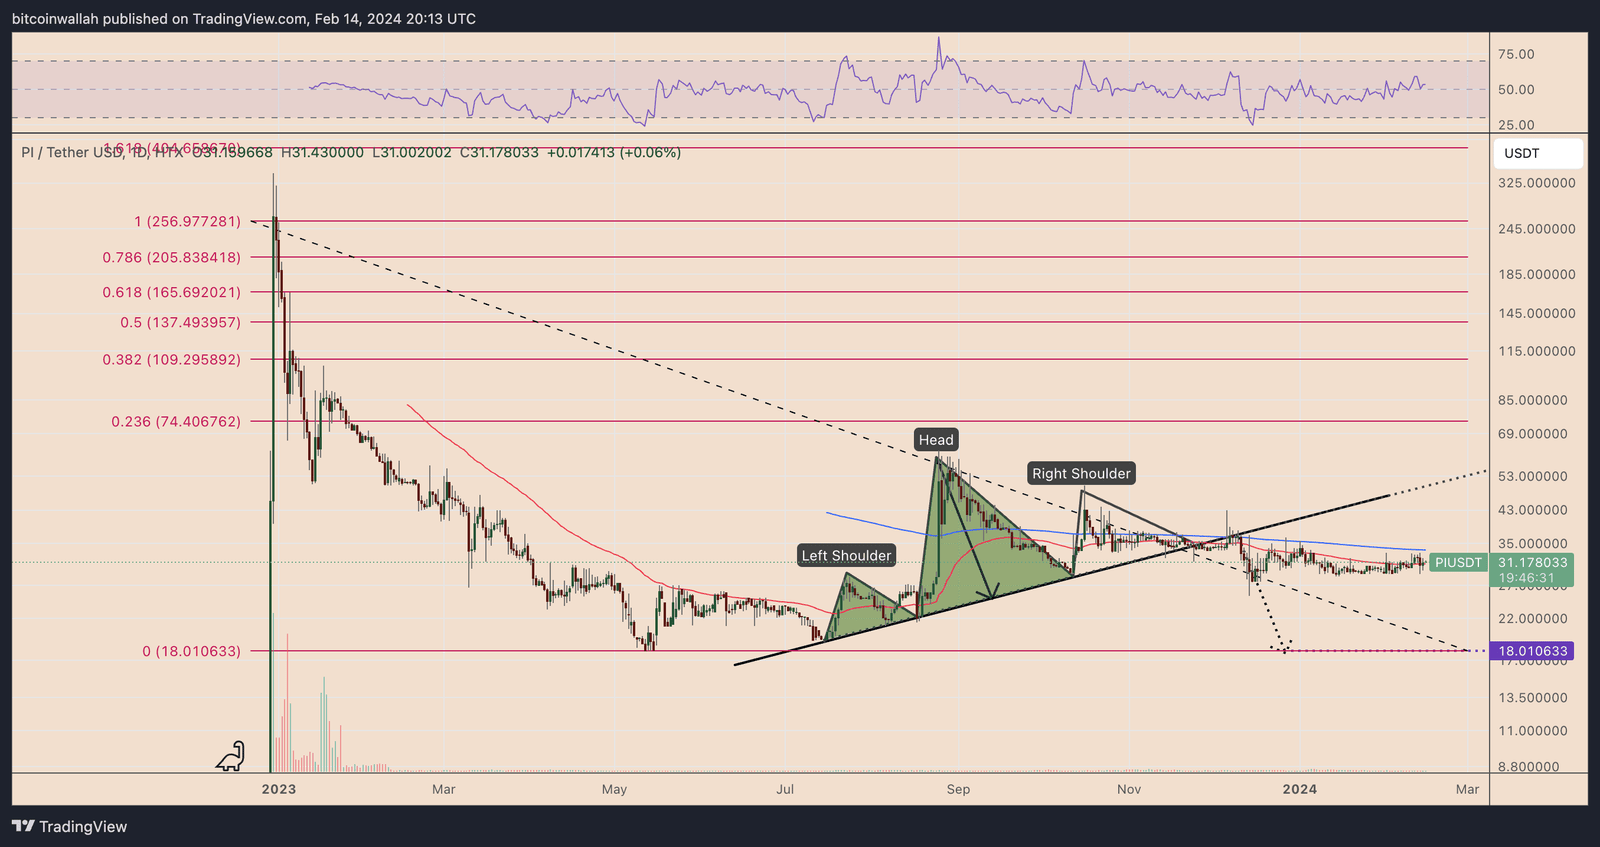
PI has already entered the breakdown stage of its prevailing H&S pattern. Nonetheless, the token accompanies meager volumes, reflecting a lack of interest among traders to pursue a downtrend. At the same time, Pi Network seldom shows higher trading volumes, so its possibility of selloff remains high due to low liquidity.
As a result, PI risks falling toward $18 by March 2024, coinciding with its 0.0 Fibonacci Retracement Line. That is down 40% from current price levels.
Pi Network’s price action has been boring so far in 2024. But it’s becoming dangerous thanks to these unsupportive technical indicators.

Our store provides a vast selection of certified pharmaceutical products for different conditions.
Our online pharmacy ensures fast and secure shipping wherever you are.
Each medication is sourced from certified suppliers so you get safety and quality.
You can explore our catalog and get your medicines with just a few clicks.
Need help? Pharmacy experts are here to help 24/7.
Take care of yourself with affordable medical store!
https://www.shailoo.gov.kg/kg/vybory-oktyabr-2020_/election-promises-reduce-drug-costs-and-improve-pharmaceutical-supply/
Фанаты слотов всегда могут найти зеркальное альтернативный адрес онлайн-казино Champion и продолжать играть популярными автоматами.
На платформе можно найти самые топовые игровые автоматы, включая классические, а также новейшие разработки от топовых провайдеров.
Если главный ресурс временно заблокирован, рабочее зеркало Champion позволит моментально получить доступ и делать ставки без перебоев.
https://casino-champions-slots.ru
Все функции полностью работают, включая регистрацию, депозиты и вывод выигрышей, и, конечно, бонусную систему.
Используйте проверенную зеркало, и не терять доступ к казино Чемпион!
This portal offers plenty of video slots, designed for different gaming styles.
Right here, you can explore retro-style games, feature-rich games, and jackpot slots with stunning graphics and realistic audio.
No matter if you’re a fan of minimal mechanics or prefer engaging stories, you’ll find something that suits you.
https://www.noteflight.com/profile/fcd98ee79a5b7f63985f3c39a0c3f662c6e3dd75
Every slot are available anytime, no download needed, and perfectly tuned for both desktop and smartphone.
In addition to games, the site includes tips and tricks, special offers, and community opinions to enhance your experience.
Register today, jump into the action, and have fun with the thrill of online slots!
Music therapy measurably reduces pain. The iMedix Health Podcast features neurologic music therapists explaining the science. Patients describe profound experiences. Healing harmonies await in iMedix popular podcasts!
Здесь вам открывается шанс играть в широким ассортиментом слотов.
Слоты обладают яркой графикой и интерактивным игровым процессом.
Каждый слот предлагает индивидуальные бонусные функции, улучшающие шансы на успех.
1xbet игровые автоматы
Игра в игровые автоматы предназначена игроков всех уровней.
Есть возможность воспользоваться демо-режимом, и потом испытать азарт игры на реальные ставки.
Попробуйте свои силы и окунитесь в захватывающий мир слотов.
Traditional timepieces will continue to be in style.
They embody engineering excellence and offer a sense of artistry that smartwatches simply don’t replicate.
A single watch is powered by fine movements, making it both reliable and sophisticated.
Collectors appreciate the intricate construction.
https://telegra.ph/ArabicBezel-The-Ultimate-Luxury-Watch-Destination-for-the-Middle-East-03-04
Wearing a mechanical watch is not just about practicality, but about celebrating tradition.
Their aesthetics are classic, often passed from generation to generation.
To sum up, mechanical watches will remain icons.
Decentralized finance trends
1XBet Promotional Code – Special Bonus up to 130 Euros
Use the 1xBet promo code: 1xbro200 during sign-up on the app to avail exclusive rewards given by One X Bet to receive 130 Euros maximum of a full hundred percent, for placing bets and a $1950 including free spin package. Open the app then continue through the sign-up process.
The One X Bet promo code: Code 1XBRO200 offers a great sign-up bonus for new users — 100% as much as $130 during sign-up. Promotional codes serve as the key to unlocking rewards, also One X Bet’s promo codes aren’t different. After entering such a code, players can take advantage of several promotions in various phases within their betting activity. Though you don’t qualify for the welcome bonus, 1XBet India ensures its loyal users receive gifts through regular bonuses. Visit the Offers page on the site regularly to remain aware on the latest offers meant for current users.
1xbet promo code nepal
Which One X Bet bonus code is presently available right now?
The promotional code relevant to One X Bet stands as 1xbro200, enabling first-time users joining the gambling provider to unlock a bonus of 130 dollars. To access exclusive bonuses related to games and wagering, please input our bonus code related to 1XBET during the sign-up process. In order to benefit of this offer, potential customers need to type the bonus code 1XBET during the registration process so they can obtain a 100% bonus on their initial deposit.
Выгребная яма — это водонепроницаемый резервуар, предназначенная для сбора и частичной переработки отходов.
Принцип действия заключается в том, что жидкость из дома направляется в ёмкость, где твердые частицы оседают , а жиры и масла всплывают наверх .
Основные элементы: входная труба, бетонный резервуар, соединительный канал и дренажное поле для доочистки стоков.
https://awan.pro/forum/user/62661/
Плюсы использования: экономичность, долговечность и экологичность при соблюдении норм.
Критично важно не перегружать систему , иначе частично очищенная вода попадут в грунт, вызывая загрязнение.
Материалы изготовления: бетонные блоки, пластиковые ёмкости и композитные баки для индивидуальных нужд.
… [Trackback]
[…] Read More Info here to that Topic: coinchapter.com/pi-network-2024-bearish-analysis/ […]
… [Trackback]
[…] Information to that Topic: coinchapter.com/pi-network-2024-bearish-analysis/ […]
… [Trackback]
[…] Information to that Topic: coinchapter.com/pi-network-2024-bearish-analysis/ […]
… [Trackback]
[…] Find More on on that Topic: coinchapter.com/pi-network-2024-bearish-analysis/ […]