

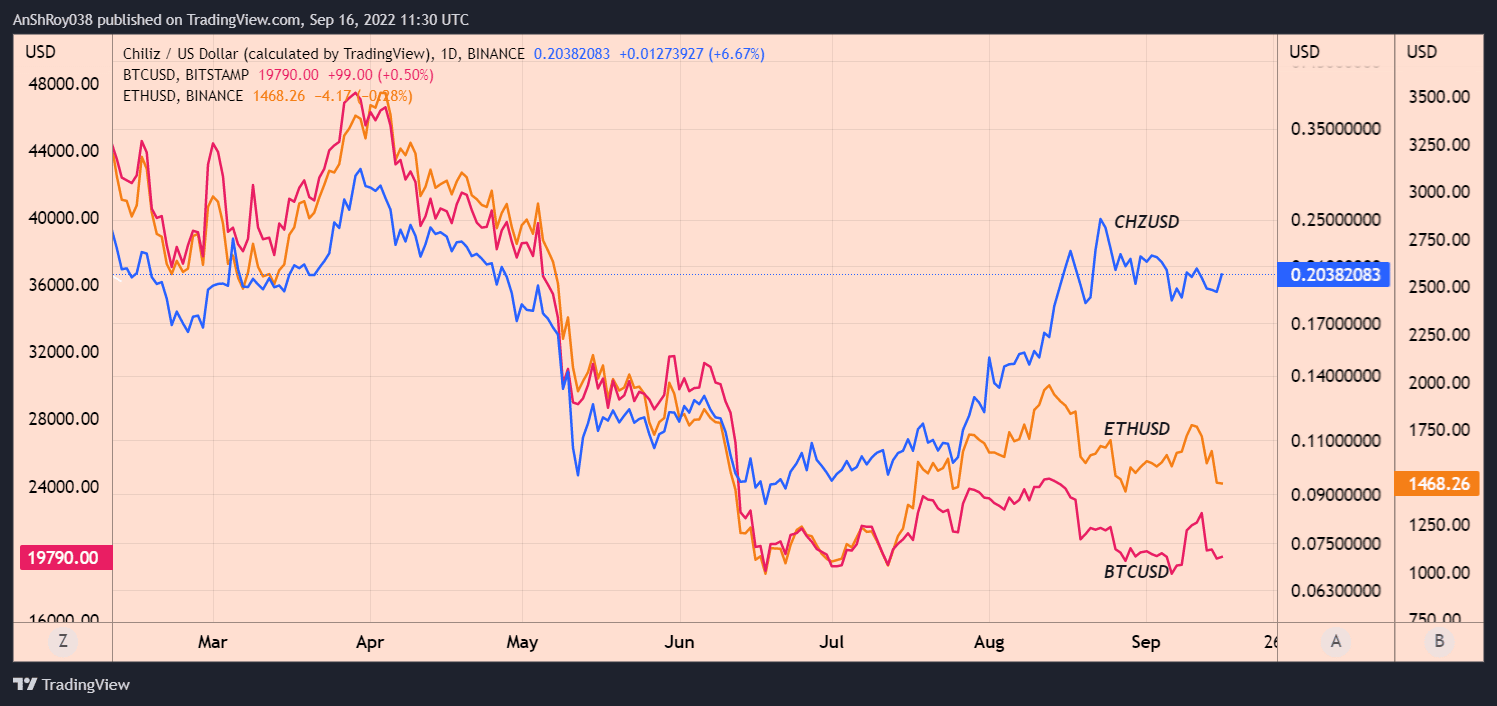
NEW DELHI (CoinChapter.com) — The cryptocurrency market continued its downtrend on Oct 13, as Bitcoin (BTC) prices dropped below $19,000 for the second consecutive day.
In addition, Ethereum (ETH) prices also failed to move above $1,300. Moreover, with analysts speculating the US dollar would continue its uptrend, bearish headwinds for the crypto sector abound.
Interestingly, smaller market cap crypto tokens have been more volatile than the sector.
1. DNT/USD Price Analysis
District0x native token DNT has been in a downtrend over the last few days. The token dropped nearly 24% between intraday high ($0.038) and low ($0.029) levels on Oct 13. If the token’s downtrend continues, DNT prices would likely test support near $0.029.
Furthermore, a marketwide downtrend could see DNT prices fall 16% from current levels and reach $0.026 before recovering.

Meanwhile, the relative strength index for DNT is oversold, with a value of 18.77 on the daily charts. An oversold RSI often acts as a buy signal for an asset. Hence, if traders start buying, the DNT token would start rising and might challenge the resistance near $0.034.
Additionally, a sustained uptrend would see DNT prices reach $0.038 before corrections pare gains.
2. SNT/USD Daily Price Chart
SNT prices have registered massive gains since Oct 12. The token jumped nearly 43% between Oct 12’s low ($0.027) and Thursday’s intraday high of $0.039 before the price dropped. However, SNT’s 100-day EMA (blue wave) remains a strong dynamic resistance that pared the token’s gains.
If the SNT price continues to uptrend, the token must move and consolidate above the 100-day EMA resistance to challenge resistance near $0.033. Moreover, a move above immediate resistance could help the SNT price reach $0.035 before retreating.
Meanwhile, the relative strength index for SNT remains neutral, clocking at 61.74 daily. However, the RSI trendline is steadily climbing toward the overbought region, which might result in the token reversing its current uptrend.
Once that happens, SNT prices will likely test support from their 50-day EMA (purple wave) near $0.029. Moreover, a marketwide downtrend could result in SNT prices falling $0.0278 before recovering.
3. AGIX/USD Price Chart
The SingularityNET prices today reached $0.112, a price level last seen in Apr 2022. However, market corrections soon pared gains. Nevertheless, the token gained nearly 169% in under two days, jumping between Oct 12’s low of $0.0419 and Oct 13’s intraday high of $0.112.
Moreover, the uptrend helped AGIX’s 20-day EMA (red wave) move above the token’s 100-day EMA (blue wave) to form a bullish pattern called the golden cross. Traders consider the pattern a sign of positive market sentiment and a buy signal.
Also Read: ETH/BTC: Ethereum Price Shows Signs of Bullish Reversal Vs BitcoinIf the uptrend continues, AGIX prices might target resistance near $0.089. On the other hand, moving above immediate resistance could help AGIX token challenge the psychologically strong resistance near $0.1 before retreating.

However, the relative strength index for AGIX is overbought, with a value of 77.27 on the daily charts. An overbought RSI over preludes a trend reversal for an uptrending asset.
Therefore, AGIX prices might test support from its 200-day EMA (green wave) near $0.075. Moreover, a marketwide downtrend might see AGIX prices fall 18% from current levels and reach $0.068.
4. TTC/BNB Price Chart
TechTrees Coin, the token born to support Elon Musk’s “vision for low carbon emissions and sustainable development,” has been on a massive bullrun since its inception on Sept 14.
The token jumped nearly 89% in under five days, going from OCt 9’s low of 0.0029 BNB to an intraday high of 0.00544 BNB on Thursday.
The token’s rally to a new all-time high has resulted in a strongly overbought relative strength index, currently clocking at 92.67 daily. Hence, it seems likely that TTC prices might soon reverse their uptrend.
In detail, traders often consider an overbought RSI a sell signal, which leads to sell-offs and trend reversals.
5. SPKY/BNB Price Analysis
Spooky Shiba is a horror-themed approach to creating new canine tokens with little to no utility. The project has an NFT scratch card game to its name, with an NFT marketplace in the works, but that is all Spooky Shiba has to offer.
The token launched in Jul 2022, reaching an ATH of 0.112BNB within days. Since then, SPKY prices have been in a perpetual downtrend. The meme (horror?) token registered a jump of 31.5% on Oct 3 but has since lost steam.

SPKY prices have fallen nearly 10% from Oct 10’s high of 0.0064BNB to an intraday low of $0.0058BNB on Oct 13.
Meanwhile, the relative strength index for SPKY remains neutral, with a value of 50.94 on the daily charts.
Which is a bigger threat to the United States Of America? Read here to know President Joe Biden’s answer.

… [Trackback]
[…] Read More on that Topic: coinchapter.com/cryptocurrency-price-disctrict0x-dnt-status-network-token-snt-singularitynet-agix-tech-trees-coin-ttc-spookyshiba-spky/ […]
… [Trackback]
[…] Info to that Topic: coinchapter.com/cryptocurrency-price-disctrict0x-dnt-status-network-token-snt-singularitynet-agix-tech-trees-coin-ttc-spookyshiba-spky/ […]