

YEREVAN (CoinChapter.com) – The crypto market has seen shoppy performance in the past month. Additionally, the global macroeconomic turmoil threatens to tank digital assets even lower. Thus, the bearish technicals on many altcoins don’t come as a surprise. However, some digital assets did better than others, in some cases, managing three-digit gains. Here are some of them.
#1 Unizen (ZCX) Price Chart
Unizen token (ZCX) traded at $0.22 in the New York session on Oct 4, after a surprising 335% rally month-to-date. However, technicals point to a halt, with a possible bearish continuation. The trading volumes on the daily chart subsided, suggesting growing disinterest among traders.

#2 Bepro (BEPRO) Price Chart
Decentralized Protocol Bepro’s same-name token was not quite at successful, but jumped nearly 30% since Oct 1. Notably, the bearish sentiment might rain on BEPRO’s parade, as the asset painted a ‘descending triangle’ pattern on the daily chart.

It entails a falling resistance line and a flat support. Once the token falls below the lower trendlines, investors can expect a further downtrend, equal to the maximal height of the triangle. In case of BEPRO, the target price would stand at $0.00006, a 94% plunge from the current $0.0011.
#3 Cosmos (ATOM) Price Chart
Cosmos (ATOM), the 23rd digital asset by market cap traded at $13 on Oct 4. ATOM advanced 145% since mid-June, but also exhibited signs of upcoming reversal, as the trading volumes have been declining for over a week.

#4 MakerDAO (MKR)
MakerDAO token MRK has been moving in a neutral formation known as the ‘descending channel’ that features two parallel trendlines with a negative slope. While the setup does not predict a bias after the digital asset breaks in either direction, it does provide utility for short-term forecasts.
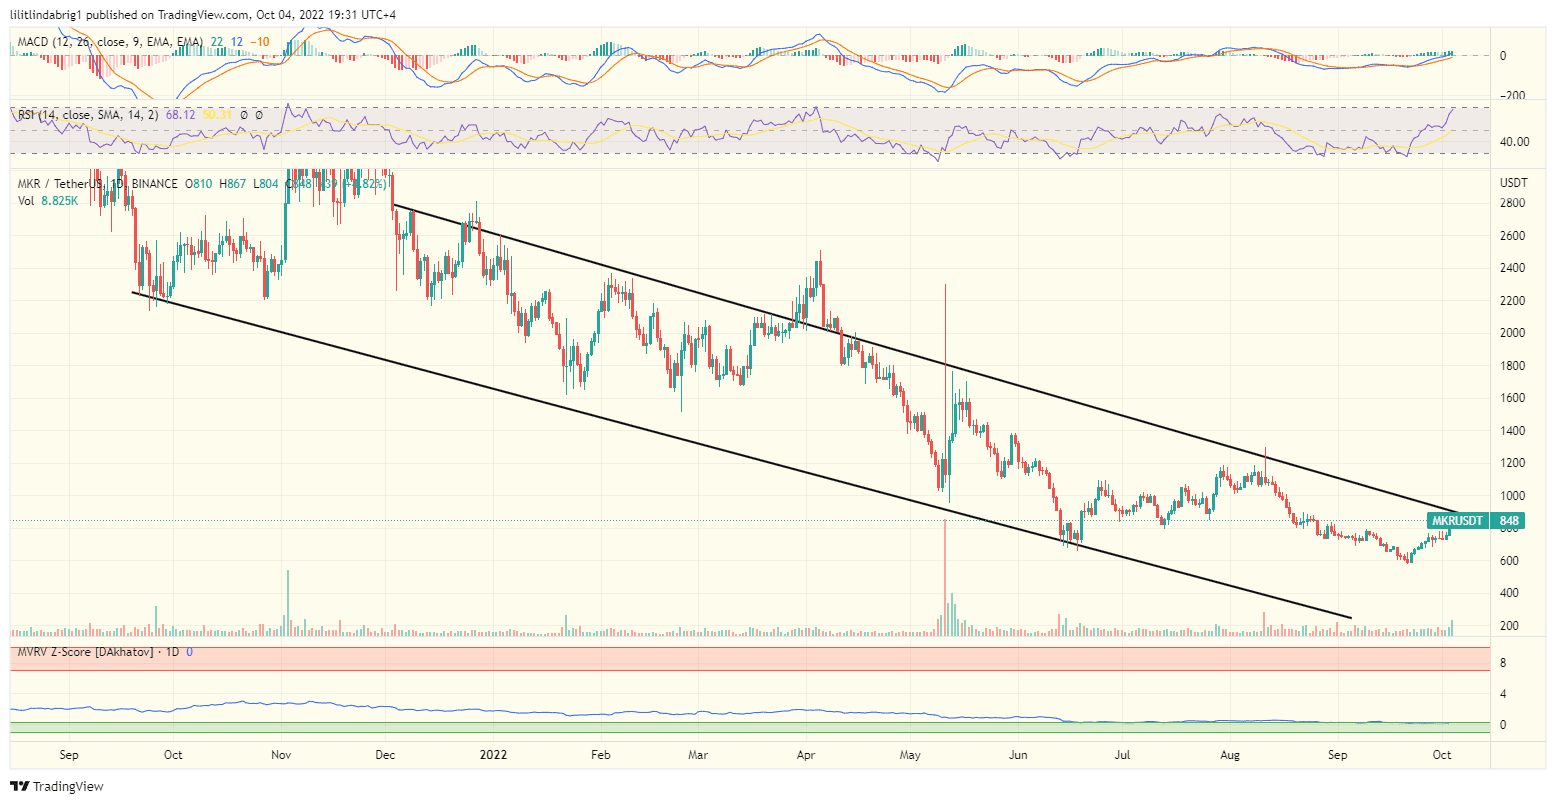
According to the channel, MKR could decline, after packing 45% since Sep 22. Meanwhile, on Oct 4, the asset traded at $850.
#5 Arker (ARKER) Daily Price Chart
Arker’s same-name token saw dramatic 97% price depreciation year-to-date, and stood at $0.001 in the New York session on Oct 4. However, the trading volume on the daily chart increased in the past week, which could spur further bullish hopes.

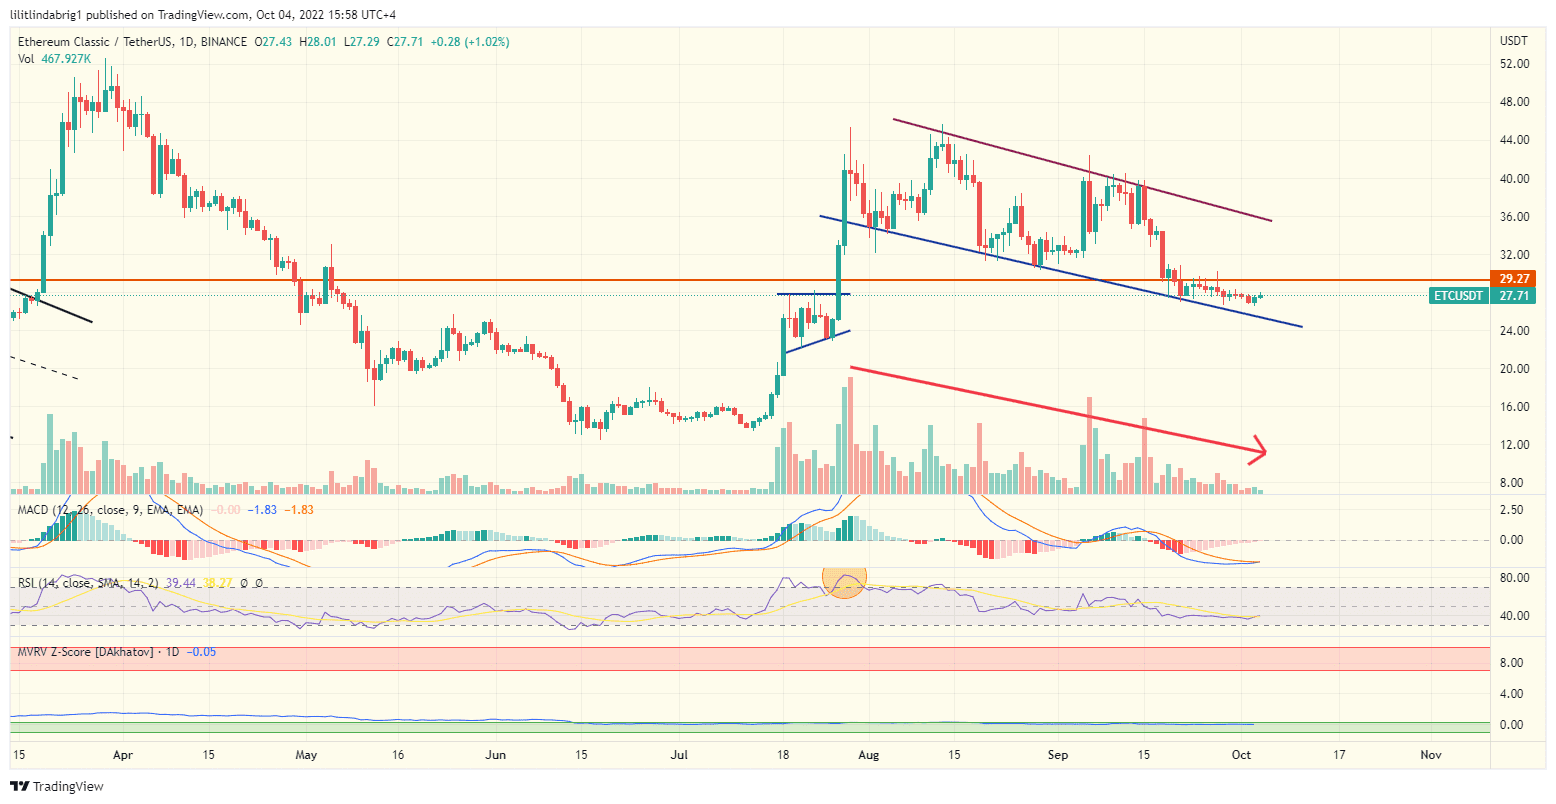
#6 Ethereum Classic (ETC) Price Technical Analysis
Ethereum proof-of-work fork Etherem Classic (ETC) planted a green candle on the weekly chart, while sliding down in another descending channel. The ETC/USD exchange rate stood at just under $28 on Oct 4, hinting at more pain in the upcoming sessions.
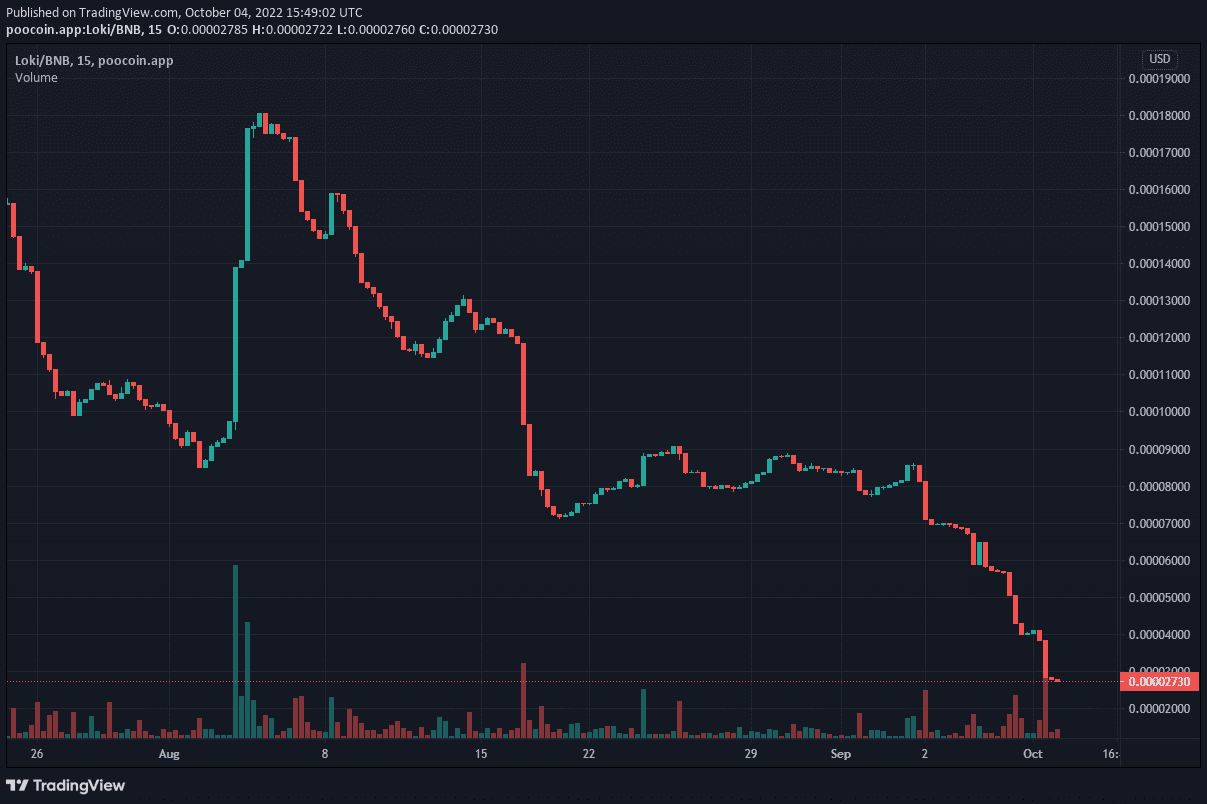
#7 Loki Inu (LOKI) Price Chart
A relatively new meme coin Loki Inu, (LOKI) slumped in the previous week, trading at $0.000027 on Oct 4. The digital asset displayed a similar patter of declining trading volumes, suggesting there’s another leg down ahead for the meme coin.

… [Trackback]
[…] Find More to that Topic: coinchapter.com/price-unizen-zcx-bepro-bepro-cosmos-atom-makerdao-mkr-arker-arker-ethereum-classic-etc-loki-loki/ […]
… [Trackback]
[…] Find More Info here on that Topic: coinchapter.com/price-unizen-zcx-bepro-bepro-cosmos-atom-makerdao-mkr-arker-arker-ethereum-classic-etc-loki-loki/ […]
… [Trackback]
[…] Information on that Topic: coinchapter.com/price-unizen-zcx-bepro-bepro-cosmos-atom-makerdao-mkr-arker-arker-ethereum-classic-etc-loki-loki/ […]
… [Trackback]
[…] Information on that Topic: coinchapter.com/price-unizen-zcx-bepro-bepro-cosmos-atom-makerdao-mkr-arker-arker-ethereum-classic-etc-loki-loki/ […]
… [Trackback]
[…] Find More here to that Topic: coinchapter.com/price-unizen-zcx-bepro-bepro-cosmos-atom-makerdao-mkr-arker-arker-ethereum-classic-etc-loki-loki/ […]
… [Trackback]
[…] Information to that Topic: coinchapter.com/price-unizen-zcx-bepro-bepro-cosmos-atom-makerdao-mkr-arker-arker-ethereum-classic-etc-loki-loki/ […]
… [Trackback]
[…] Find More Info here to that Topic: coinchapter.com/price-unizen-zcx-bepro-bepro-cosmos-atom-makerdao-mkr-arker-arker-ethereum-classic-etc-loki-loki/ […]