
NEW DELHI (CoinChapter.com) — Layer-2 scaling solution Synthetix’s native token SNX prices broke out of a bullish pattern on Jun 20. However, it seems unlikely the DeFi token would meet the pattern’s calculated price target.
In detail, two converging trendlines with a negative slope connecting swing highs and swing lows form the descending pattern. Prices bounce between the converging trendlines until the cryptocurrency’s prices break out. Then, high trading volumes confirm the break-out.
As per the rules of technical analysis, the upside target for the break-out is equal to the maximum distance between the falling wedge’s upper and lower trendlines. Theoretically, SNX prices would have jumped more than 102% to reach $4.75 from the break-out level of $2.2.
However, SNX prices failed to continue their uptrend. Traders seem to have moved to book profits, resulting in Synthetix trending downwards since Jun 21. The altcoin’s price action seems to be confirming the observations of Tom Bulkowski, a veteran investor.
Also Read: Potential SOL liquidation on Solend Protocol puts Solana at risk.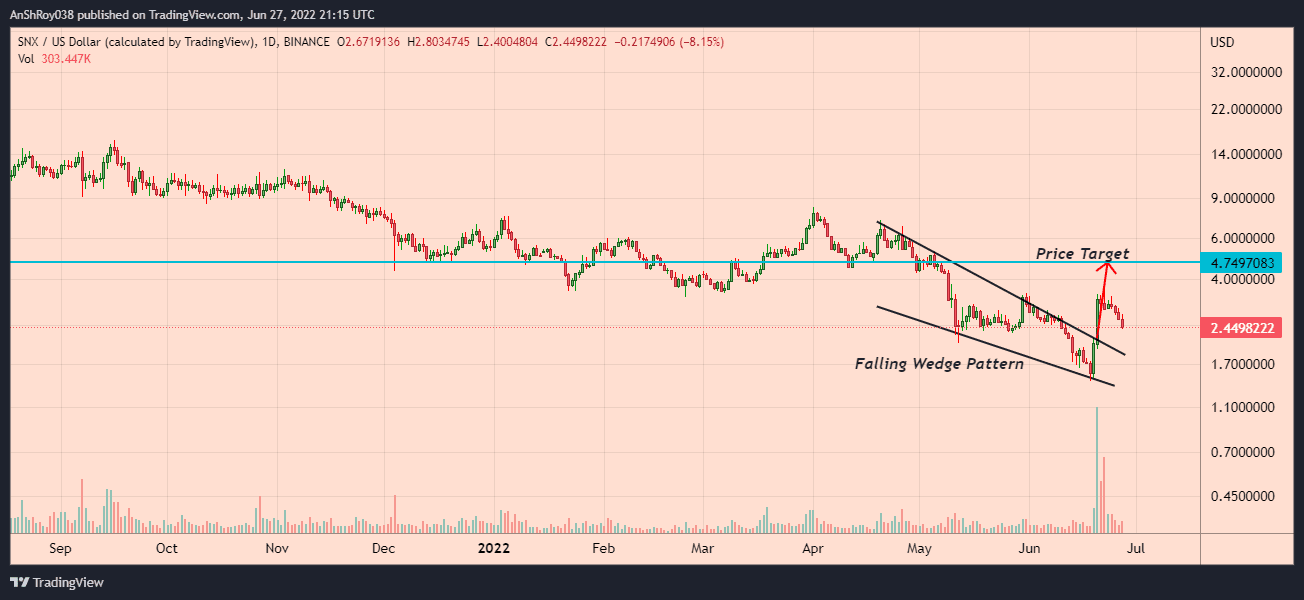
Bulkowski stated the falling wedge might not be a reliable indicator of the bullish reversal. As per his research, an asset meets its break-out price target in only 62% of the cases. Moreover, the analyst highlighted that a pullback after the break-out occurs in 74% of cases.
Synthetix’s MACD Indicating Declining Bullish Momentum
The SNX token saw its prices jump 132% in two days, going from Jun 19’s low of $1.5 to reaching an intraday high of $3.44 on Jun 20. The boost helped Synthetix break out of the pattern.
However, the token’s 100-day exponential moving average (100-day EMA, blue wave) rebuffed the DeFi protocol’s uptrend. SNX prices fell nearly 30% from Jun 21’s high ($3.41) to reach an intraday low of $2.4 on Jun 27.
If traders start buying again, the SNX token must move above its 20-day EMA (red wave) before targeting resistance near $2.7. Conquering and consolidating above immediate resistance would help Synthetix prices challenge resistance from their 50-day EMA (purple wave) near $3.
Finally, SNX prices need to jump more than 44% to reach $3.55 resistance near its 100-day EMA (blue wave). A move above $3.5 would likely attract more investors, adding tailwinds to SNX’s rally.
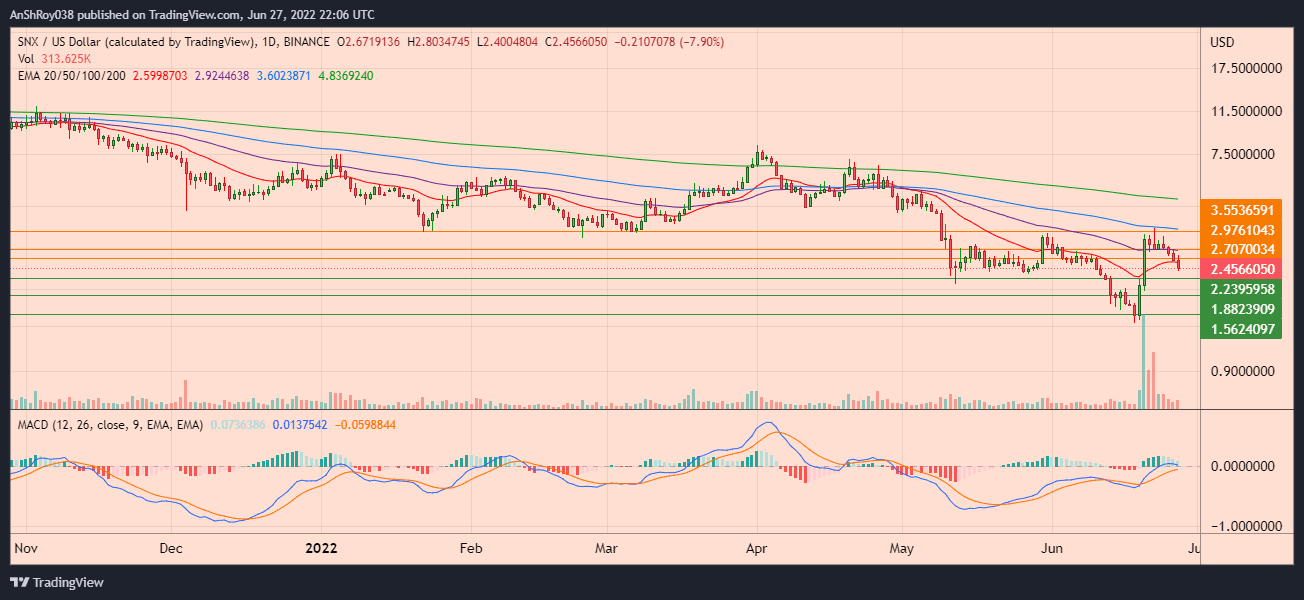
Meanwhile, the momentum oscillator MACD is forecasting strengthening downward momentum for Synthetix.
Also Read: GameFi monthly new users down by 50% despite gaming tokens’ recovery.Contracting positive bars on the MACD histogram indicate the MACD line (difference of 12-day and 26-day EMA) is moving towards the MACD signal line (9-day EMA of MACD) and might chart a bearish crossover soon. Traders often consider the pattern a sell signal.
If the sell-off continues, SNX prices might test immediate support near $2.24, which previously supported Synthetix price action between May 11 and Jun 12. Breaching below immediate support would see SNX prices fall to $1.9.
A marketwide sell-off might result in SNX falling nearly 37% to reach $1.56 before recovering.
Transaction Spike Behind Price Jump?
The number of transfers on the Synthetix platform surged on Jun 20, reaching its highest level since Mar last year.

Moreover, the Synthetix mainnet has seen more than $1.7 billion in trading volume in Jun. The spike in volume resulted in revenue from trades, which might be a reason behind the recent SNX token price action.
At the time of writing, SNX was trading at $2.46, down 7.57% on the day.

… [Trackback]
[…] Here you can find 68614 more Info on that Topic: coinchapter.com/snx-breakout-likely-fail-heres-why/ […]
… [Trackback]
[…] Find More on to that Topic: coinchapter.com/snx-breakout-likely-fail-heres-why/ […]
… [Trackback]
[…] Find More here to that Topic: coinchapter.com/snx-breakout-likely-fail-heres-why/ […]
… [Trackback]
[…] Read More here to that Topic: coinchapter.com/snx-breakout-likely-fail-heres-why/ […]
… [Trackback]
[…] Info on that Topic: coinchapter.com/snx-breakout-likely-fail-heres-why/ […]