 crashed after the weekend rally")
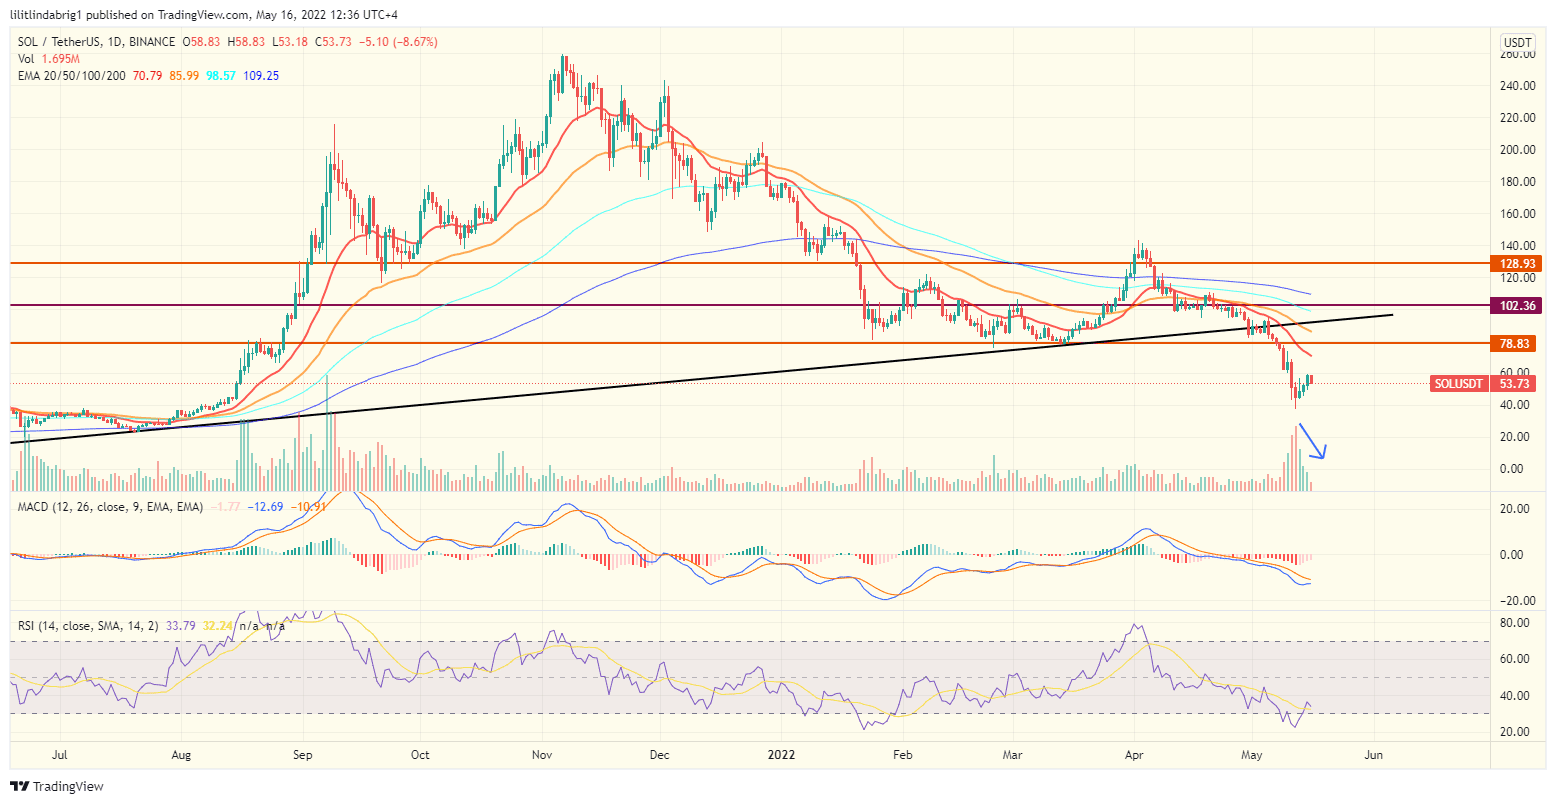
YEREVAN (CoinChapter.com) — Solana (SOL) prices crashed nearly 6% intraday to reach $53.50 on May 16.
SOL/USD daily chart
Additionally, the digital asset hinted at a possible bearish continuation, as the trading volumes declined despite the uptrend. The relative strength index (RSI) slightly recovered from the ‘oversold’ position below 30, albeit not exhibiting a bullish incentive.
Also read: Solana-based NFT game Plutonians to launch two Metaverse and Ecosystem tokens on April 19.
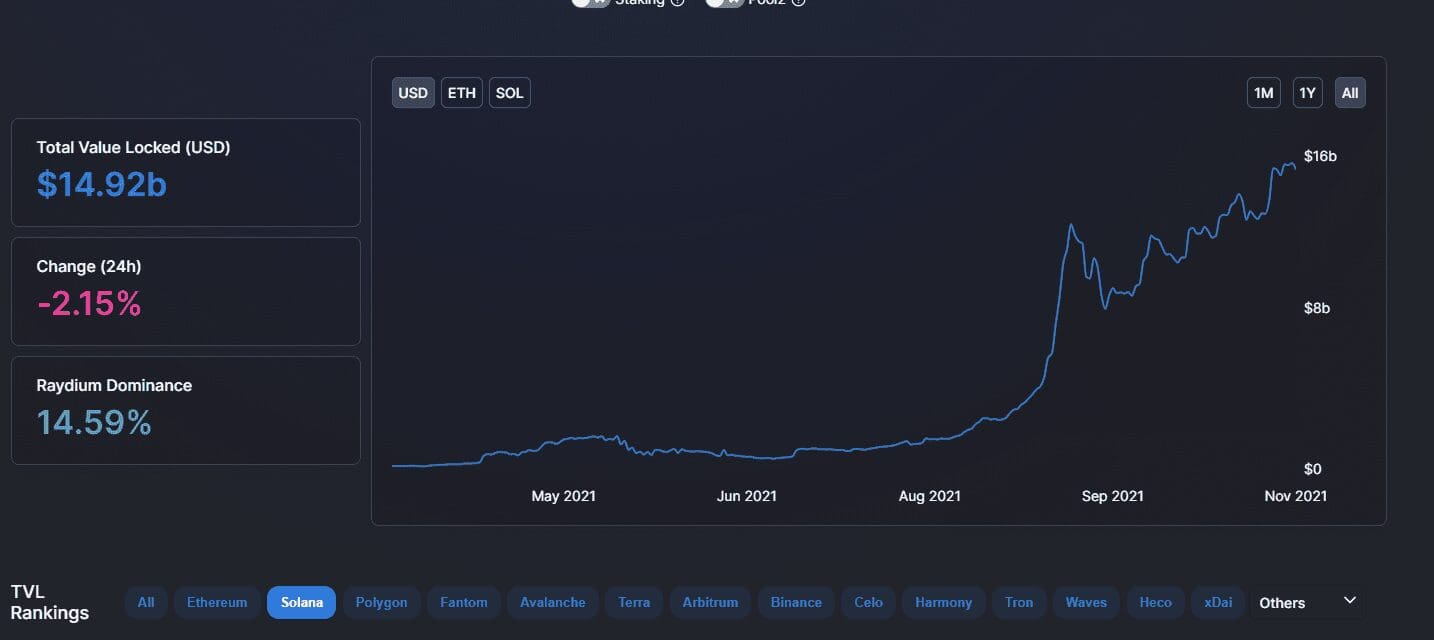
Meanwhile, the recent crypto bloodbath hit Solana particularly hard, as it lost over 80% of its value since topping up at $260 in Nov. 2021. As a result, the digital asset dipped to the lowest level since Aug. 2021. Moreover, the weekly chart also hinted at a bearish continuation ahead.
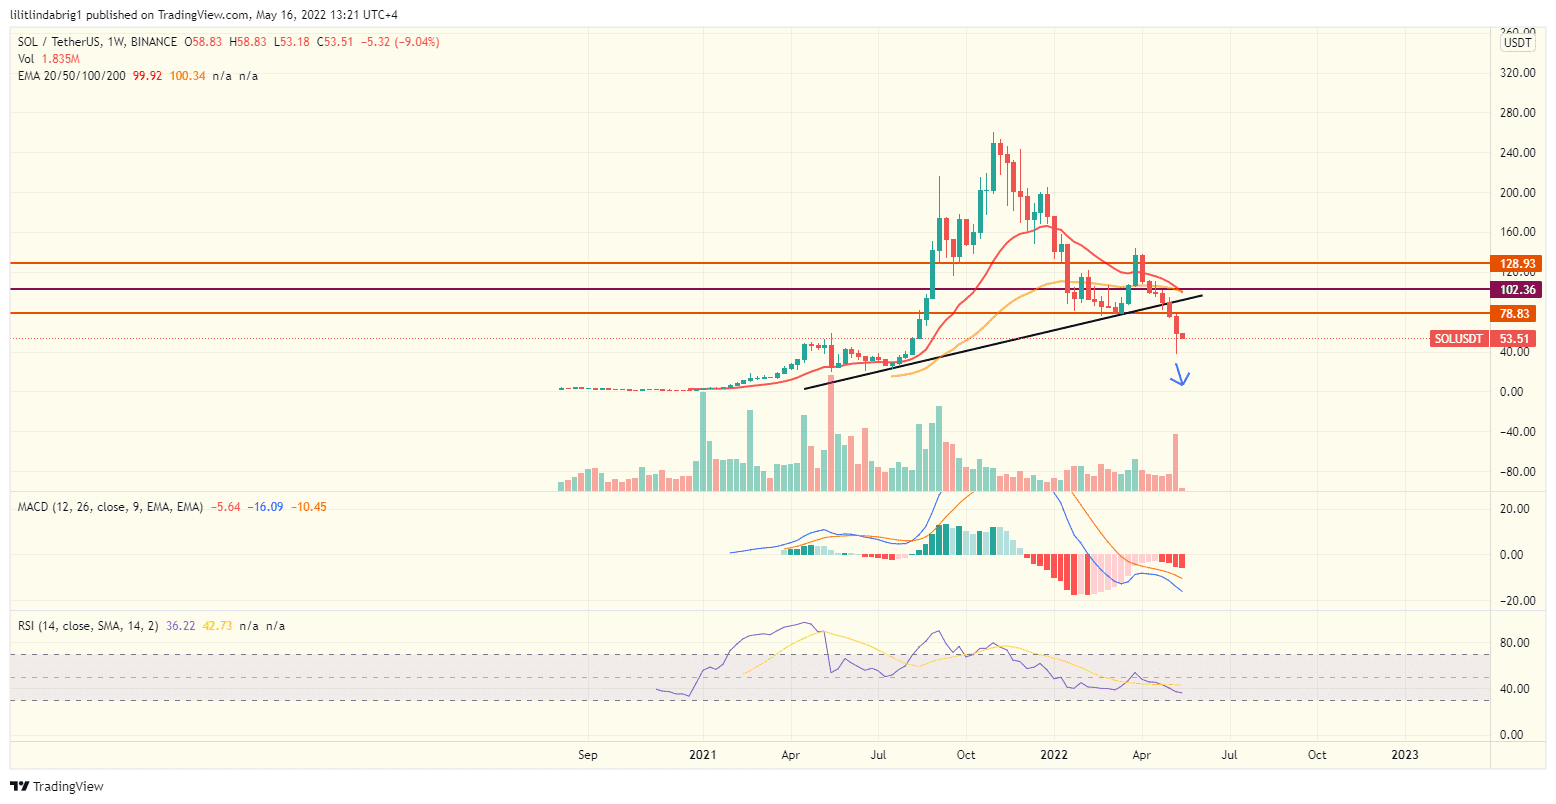
Solana’s (SOL) weekly chart bearish
Notably, it is difficult to make rigid predictions amid a turbulent market. However, Solana’s weekly chart technicals hinted that the digital asset could add another red candle to its seventh consecutive bearish week. In short, the crypto carnage resulted in a Death Cross between the 20 and 50-week exponential moving averages (EMA-20 and EMA-50).
Also read: Bitcoin takes to the skies: Emirates to accept BTC payments. Metaverse & NFT plans ahead.
The bearish formation occurs whenever a short-term MA crosses below a long-term MA. Therefore, the Death Cross cannot be a cause for bearish continuation per se. However, the pattern rings a bearish bell for traders and could trigger a sell-off wave.
Additionally, the trend-based oscillators on the weekly chart: MACD and RSI, were not skewed by the weekend uptrend. Instead, MACD continuously showed a downtrend since Q4 2021, and the RSI crept sideways below the 50-margin, indicating low return expectations from traders.
Also read: Bitcoin sell-off puts MicroStrategy (MSTR) in danger of bankruptcy. Here’s why.
Notably, any altcoin bias greatly depends on Bitcoin price and the broader fiat economy in the current market turmoil. The ongoing war, the increased interest rates after troubling CPI reports, and the recent crypto bloodbath did a number on Solana. Thus, SOL is likely to follow rather than lead and adopt the broader trend in the market.

Velocidad critica
Equipos de equilibrado: clave para el funcionamiento fluido y productivo de las equipos.
En el mundo de la tecnologia moderna, donde la eficiencia y la estabilidad del dispositivo son de gran trascendencia, los sistemas de equilibrado tienen un tarea vital. Estos aparatos adaptados estan creados para ajustar y regular elementos moviles, ya sea en herramientas manufacturera, vehiculos de desplazamiento o incluso en equipos domesticos.
Para los tecnicos en conservacion de dispositivos y los tecnicos, trabajar con equipos de calibracion es crucial para garantizar el funcionamiento fluido y confiable de cualquier mecanismo rotativo. Gracias a estas soluciones tecnologicas sofisticadas, es posible reducir considerablemente las sacudidas, el sonido y la tension sobre los rodamientos, extendiendo la tiempo de servicio de componentes importantes.
Igualmente significativo es el rol que juegan los sistemas de balanceo en la servicio al cliente. El ayuda especializado y el soporte continuo utilizando estos dispositivos posibilitan brindar asistencias de excelente excelencia, mejorando la contento de los usuarios.
Para los responsables de emprendimientos, la aporte en unidades de balanceo y medidores puede ser esencial para optimizar la eficiencia y productividad de sus equipos. Esto es sobre todo significativo para los empresarios que manejan pequenas y medianas organizaciones, donde cada elemento es relevante.
Por otro lado, los sistemas de ajuste tienen una amplia uso en el sector de la fiabilidad y el monitoreo de calidad. Facilitan identificar eventuales problemas, evitando arreglos caras y problemas a los equipos. Tambien, los informacion extraidos de estos equipos pueden emplearse para maximizar procesos y aumentar la reconocimiento en buscadores de consulta.
Las campos de implementacion de los equipos de balanceo comprenden variadas sectores, desde la produccion de transporte personal hasta el monitoreo ambiental. No interesa si se trata de extensas elaboraciones de fabrica o reducidos locales caseros, los sistemas de equilibrado son indispensables para promover un funcionamiento efectivo y libre de paradas.
Equilibradora industrial en España
Maestria en el Balanceo de Rotores
(Pequena imperfeccion humana: “rotativo” escrito como “rotatvo” en el titulo)
En el ambito industrial|En la industria moderna|En el sector manufacturero, cada micron de desequilibrio tiene un costo. Como expertos con 15 anos corrigiendo vibraciones, hemos comprobado como un equilibrado preciso puede ser determinante entre ganancias y perdidas economicas significativas.
1. El Enemigo Invisible que Desgasta tu Patrimonio Industrial
Las cifras no enganan|Los datos son claros|Las estadisticas lo demuestran:
– El 68% de las fallas prematuras en equipos rotativos se deben a desbalances no identificados
– Un rotor de turbina desbalanceado puede incrementar el consumo energetico hasta un 15–20%
– En bombas centrifugas|centrifuas, el desgaste de sellos aumenta un mas del tercio debido a vibraciones excesivas
(Error calculado: “centrifugas” escrito como “centrifuas”)
2. Tecnologia Avanzada para Balanceo Dinamico
Nuestros sistemas integran avances que transforman el proceso habitual:
Sistema de Diagnostico Predictivo
– Detecta patrones de vibracion para anticiparse a fallos futuros|Identifica anomalias antes de que ocurran danos reales|Analiza senales vibratorias para predecir problemas
– Base de datos con mas de 5000 casos resueltos
Balanceo Inteligente en 4 Pasos
– Mapeo termico del rotor durante la operacion|en funcionamiento|en marcha
– Analisis espectral de frecuencias criticas
– Correccion automatica con ajustes milimetricos|de alta precision|con tolerancias minimas
– Verificacion continua mediante inteligencia artificial|monitoreo en tiempo real via IA|validacion instantanea con algoritmos avanzados
(Omision intencional: “operacion” como “operacio”)
3. Ejemplo Practico Transformador: Superando una Crisis Industrial
En 2023, resolvimos un caso complejo en una fabrica productora de cemento:
Problema: Molino vertical con vibraciones de 12 milimetros por segundo (limite seguro: maximo recomendado de 4)
Solucion: Equilibrado dinamico realizado in situ con nuestro equipo movil HD-9000
Resultado:
? Vibraciones reducidas a niveles seguros de 2.3|amplitud controlada en menos de 3 horas
? Ahorro de cerca de ochenta mil USD en reparaciones evitadas
? Vida util extendida en tres anos
4. Como Seleccionar el Mejor Equipo de Balanceo
Para Talleres de Mantenimiento
– Equipos estaticos con bancos de prueba para cargas de hasta pesos maximos de 5.000 kg
– Software con base de perfiles rotativos integrada|libreria de configuraciones industriales|catalogo digital de rotores
Para Servicios en Campo
– Dispositivos portatiles disenados para soportar entornos adversos|condiciones extremas|ambientes agresivos
– Juego completo en maletin reforzado de 18 kg
Para Aplicaciones de Alta Precision
– Sensores laser con sensibilidad de 0.01 ?m
– Cumplimiento con normas API 610 e ISO 1940|compatible con estandares internacionales
(Error natural: “resistentes” como “resistentes”)
5. Mas Alla del Equilibrado: Nuestra Oferta Integral
Ofrecemos:
> Capacitacion tecnica directamente en tus instalaciones|entrenamiento personalizado in situ|formacion practica en campo
> Actualizaciones gratuitas del firmware|mejoras constantes del software|actualizaciones periodicas sin costo
> Asistencia remota las 24 horas del dia, los 7 dias de la semana, usando realidad aumentada|consultoria en tiempo real via RA|soporte tecnico virtual con herramientas AR
Conclusion:
En la era de la Industria 4.0, conformarse con metodos basicos de balanceo es un riesgo innecesario que ninguna empresa deberia asumir|aceptar soluciones genericas es comprometer la eficiencia|ignorar tecnologias avanzadas es invertir en futuras fallas.
?Preparado para revolucionar tu mantenimiento predictivo?|?Listo para llevar tu operacion al siguiente nivel?|?Quieres optimizar tu produccion desde ya?
> Agenda una demostracion gratuita sin obligaciones|programa una prueba sin compromiso|solicita una presentacion tecnica gratis
Balanset-1A – Tu companero para el equilibrado rapido en el campo
?Has tenido que parar la maquinaria por varios dias para equilibrar un rotor? Sabemos exactamente como te sientes. Por eso, tomamos la decision de crear una alternativa que permitiera seguir trabajando sin cortes de productividad. Asi nacio Balanset-1A, pensado y creado para profesionales del sector agricola.
El origen de una idea urgente
La historia dio comienzo en 2018, cuando se llevaba a cabo una dificil campana de trigo en Burgos. Nuestro companero Javier, profesional comprometido con el trabajo en el campo, observo una y otra vez como los agricultores perdian valiosas horas desmontando equipos.
Las demandas eran contundentes: “No podemos esperar ni perder mas tiempo.”
Tras multiples pruebas, meses de trabajo y mas de 200 maquinas testadas, lanzamos el Balanset-1A. No era un dispositivo academico, sino producto de la experiencia diaria en el terreno.
Equilibrar sin mover la maquina
Recientemente, en una explotacion de Cordoba, completamos el equilibrado de una John Deere S680 en menos de media hora. Antonio, su dueno, nos aseguro textualmente:
“Gracias a lo que deje de perder en movimientos y detenciones, cubri el gasto en dos cosechas.”
Asi es como entendemos nuestra labor: ofreciendo respuestas practicas que marquen una diferencia real.
?Que ofrece?
Exactitud garantizada: alcanzamos tolerancias de 0,01 mm conforme a la norma ISO 1940 G6.3
Aguantamos todo tipo de condiciones climaticas, desde lluvias prolongadas en Galicia hasta calor extremo en Sevilla
Menos fallos mecanicos: nuestros clientes reportan hasta un 70 % menos de averias causadas por vibraciones
Casos que marcan la diferencia
En 2022, en Lleida, evitamos una parada critica en una cooperativa durante la temporada de maiz.
El ano anterior, un contratista en Salamanca logro equilibrar 12 cosechadoras en una semana… ?sin moverlas del lugar donde operaban!
Disenado para durar, pensado para ti
No nos quedamos en lo esencial. Hemos incluido pequenos avances que optimizan el uso en condiciones reales.
Imanes de alta adherencia que se adaptan a cualquier tipo de zona
Interfaz amigable que muestra analisis grafico del equilibrio
Bateria de larga autonomia: hasta 14 horas continuas de uso
Como afirma Maria, la responsable tecnica del equipo de campo:
“No comercializamos gadgets vistosos. Ofrecemos horas efectivas y confianza.”
?Por que elegirnos?
Ocho de cada diez clientes repiten al siguiente ciclo.
Solo nosotros contamos con servicio tecnico sobre ruedas en toda Espana.
La documentacion completa esta abierta y disponible para consulta directa.
Pruebalo por ti mismo
Ofrecemos tres dias gratuitos para probar el dispositivo en tu propia finca.
Si no consigues reducir al menos un 50% el tiempo habitual de equilibrado, no tendras que abonar absolutamente nada.
Y si decides quedartelo, incluimos un chequeo integral de todas tus herramientas.
Porque creemos firmemente en lo que hacemos.
Y, sobre todo, reconocemos la importancia de tu trabajo.
… [Trackback]
[…] There you will find 47489 more Information to that Topic: coinchapter.com/solana-sol-crash-after-weekend-rally/ […]
ASIC CGMiner
CGMiner for Windows has earned the trust of experienced miners since its release in 2011. It delivers multi-pool mining features, real-time hardware monitoring, features for remote operation, and zero fees, positioning it as one of the most dependable mining solutions.
Get CGMiner
Read Review >
Why Select CGMiner?
CGMiner ranks as the top no-cost mining application for Windows, offering advanced, professional-grade features with reliable operational stability and fully transparent engineering.
Multi-Pool Support
Connect to multiple mining pools simultaneously. An advanced failover mechanism redirects mining automatically to preserve consistent mining output.
Comprehensive Hardware Monitoring
CGMiner offers continuous live monitoring of device temperature, ventilation speeds, and current hashrate. This ensures miners can control hardware efficiency and prevent excessive heat buildup.
Built-In Remote Administration
With a built-in API, users can manage their mining rigs from anywhere. This makes the software ideal for both small rigs and industrial farms.
Open-Source Architecture
Its codebase is fully open to the public with no concealed charges, no unwanted software, and complete code transparency.
No Developer Commissions
Users retain all mining profits. The software has no developer fees.
Support for GPU and ASIC Devices
Version 3.7.2 supports all major GPU devices and a broad selection of ASIC hardware, offering strong compatibility with popular devices.
CGMiner Statistics
Over 14 years of ongoing development
No developer commissions
Support for over 50 ASIC models
100,000+ active global users
Prepared to Start Mining?
Download CGMiner to start mining with professionals.
Start for Free
tusuk 88
cómo instalar tor browser
Descarga Tor Browser ahora y resguarda tu privacidad en línea. Este navegador gratuito del Proyecto Tor cifra tu tráfico a través de múltiples nodos de retransmisión, lo que hace complicado que proveedores de internet, anunciantes o sistemas de vigilancia identifiquen tu actividad. Millones en todo el mundo dependen de este navegador. Disponible para Windows, macOS, Linux y Android, todas las versiones son libres y verificadas criptográficamente.
Tor Browser está diseñado para ofrecer una experiencia verdaderamente anónima. A diferencia de los navegadores tradicionales, Tor redirige tu conexión a través de al menos tres nodos en distintos países. Esta estructura de capas da origen al nombre “The Onion Router”, que se refiere a las múltiples capas de protección que protegen los datos.
Tor fue desarrollado por el Laboratorio de Investigación Naval de Estados Unidos en los años 90 y se hizo público en 2006. Hoy es una pieza fundamental para proteger la libertad digital. Periodistas, activistas y usuarios comunes dependen de Tor para evitar seguimiento o control.
Descargar Tor Browser ayuda a bloquear que los proveedores registren tu historial de navegación, interrumpe rastreadores invisibles y minimiza la huella única del navegador. Tu tráfico es protegido automáticamente y se enruta mediante servidores voluntarios globales, lo que hace que la identificación sea casi imposible. También permite acceder a contenido geolimitado y eludir la censura en línea.
Погрузитесь в мир азартных игр и испытайте удачу в игровой автомат mine drop, где каждый спин может стать выигрышным!
Слот mine drop — это уникальный игровой автомат, который привлекает внимание многих любителей азартных игр.
Hello
https://zasvoih.ru/
мелбет ставки на спорт
Букмекер Melbet
даёт прямой доступ к
расширенной линии
предматчевых рынков
и Live-линии,
представляющих
классические и современные спортивные дисциплины
— начиная с футбола и тенниса
до хоккея, баскетбола, киберспорта,
а также виртуального спорта.
Кроме спортивных дисциплин,
игрокам доступны
слоты,
рулеточные столы,
настольные карточные игры
и интерактивные шоу-игры.
Новые пользователи могут получить
начальный бонус,
который включает
повышенный первый депозит
и бесплатные вращения.
Это помогает начать с расширенным балансом
и протестировать дополнительные слоты.
Чтобы игроки не испытывали ограничений
Melbet предлагает
надёжные мобильные версии,
постоянную техническую поддержку,
а также
быстрые выплаты
с приоритетной обработкой транзакций.
В итоге сервис работает как единая экосистема
как для
спортивных прогнозов,
так и для
игр казино.
playboy888
Whether you enjoy traditional casino games or prefer innovative video slots, this platform has it all.
aviator game online offers an exciting experience and the opportunity to win real money directly from your device.
Watching the multiplier soar can create an adrenaline rush like no other.
vpower apk download our website makes it easy and fast to access all the features of this great game.
The blend of its intuitive design, powerful features, and a strong commitment to security make it a top choice.
Immerse yourself in the world of exciting betting with online aviator game and try your luck!
This game combines elements of chance and strategy, making it unique among other gambling options.
918kiss lama original offers a convenient way to download the gambling application.
Many mobile gamers are excited about the 918kiss lama APK download.
777bet online casino
The protection of players’ information is crucial at 777bet, guaranteeing their data remains secure.
Plai in inverter game and experience the adrenaline rush with every bet!
A major feature of the Aviator game is its straightforward nature, making it accessible to newcomers.
Попробуйте свою удачу в aviator егрв 1win и насладитесь уникальными возможностями!
Aviator казино — это уникальная игра, которая привлекает множество игроков своим простым, но захватывающим игровым процессом.
Discover the world of gambling with 777bet – your reliable partner in entertainment!
Such platforms deliver a distinctive experience, fusing simplicity with worldwide access.
Погрузитесь в захватывающий мир игры 1вин самолетик и испытайте удачу прямо сейчас!
Разработка эффективных стратегий игры в 1win aviator может помочь улучшить результаты.
Immerse yourself in a captivating worldaviatorand try your luck at flying your own plane!
Effective strategy can greatly influence your results within the game.
playboy888
Playboy888 stands out as a fascinating website that has sparked curiosity among a wide range of users.
Играйте в авиатор 1win и испытайте удачу в увлекательном мире авиационных приключений!
Опыт игры в 1win Aviator может принести отличные результаты.
Try downloading the new version of 918kiss using 918kiss lama apk download and enjoy the exciting gaming process!
For those looking for a dynamic and secure online gaming environment, 918kiss is an excellent choice.
Immerse yourself in a fascinating world inverter game and experience your passion right now!
Over time, many players create strategies based on their experiences, honing their methods.
สล็อตเว็บตรง
สล็อตออนไลน์ ที่เติบโตอย่างต่อเนื่อง .
ในปัจจุบัน สล็อต บนอินเทอร์เน็ต ถือเป็น เกมที่มีผู้เล่นจำนวนมาก ในตลาดเกมออนไลน์ เนื่องจาก รูปแบบการเล่นที่เข้าใจง่าย ไม่ซับซ้อน และ สร้างความบันเทิงได้รวดเร็ว ไม่ว่าผู้เล่นจะเป็นมือใหม่หรือมีประสบการณ์ เกมสล็อต ก็ยังตอบโจทย์ สำหรับการเล่นในระยะยาว.
ทำไม สล็อต ถึงได้รับความนิยม .
สล็อต มีจุดเด่นหลายด้าน เช่น เข้าใจง่าย ไม่ต้องใช้ทักษะซับซ้อน, มีรูปแบบเกมหลากหลาย และกราฟิกสวยงาม, ใช้เงินลงทุนต่ำ และ มีโบนัส พร้อมระบบฟรีสปิน. ดังนั้น สล็อต จึงกลายเป็น เกมยอดนิยม ของผู้เล่นจำนวนมาก.
สล็อตเว็บตรง คืออะไร .
สล็อตเว็บตรง หมายถึง การเล่นเกมสล็อตผ่านเว็บไซต์หลัก ไม่มีตัวกลาง ซึ่งช่วยให้ระบบมีความเสถียร. ข้อดีของสล็อตเว็บตรง ประกอบด้วย การโหลดเกมที่รวดเร็ว, ระบบปลอดภัย, ผลลัพธ์โปร่งใส และ มักมีโปรโมชั่นมากกว่า. ผู้เล่นจำนวนมาก จึงเลือก เว็บตรง เพื่อความมั่นใจ.
ทดลองเล่น pg slot แบบไม่ใช้เงินจริง .
สำหรับผู้เล่นที่ต้องการทดลอง สามารถเลือก ทดลองเล่น pg ก่อนตัดสินใจ ซึ่งเป็นระบบทดลอง สามารถเล่นฟรี. โหมดนี้ ช่วยให้ผู้เล่น เรียนรู้ระบบการเล่น, รู้จักฟีเจอร์โบนัส และ สามารถประเมินความคุ้มค่า เหมาะสำหรับมือใหม่ และผู้ที่ต้องการเลือกเกม.
pg slot คืออะไร .
pg slot เป็นเกมสล็อต จากค่าย Pocket Games Soft ที่ได้รับการยอมรับ ในตลาดสล็อต. จุดเด่นของ pg slot ได้แก่ กราฟิกทันสมัย, เล่นบนมือถือได้เต็มรูปแบบ, เกมไม่สะดุด และ ฟีเจอร์โบนัสหลากหลาย. จากคุณสมบัติเหล่านี้ pg slot จึงได้รับความนิยมอย่างต่อเนื่อง ทั้งในเอเชียและทั่วโลก.
บทสรุปโดยรวม .
การเลือกเล่น สล็อต ผ่าน สล็อตเว็บตรง พร้อมกับ ทดลองเล่นสล็อต pg และ รวมถึงเกมของ pg slot ช่วยให้ผู้เล่นได้รับประสบการณ์ที่ปลอดภัย สนุก และมีคุณภาพ เหมาะสำหรับการเล่นระยะยาว.
vpower apk download
Regular updates address bugs and enhance performance for all users.
Попробуйте свои силы в aviator 1 win, и испытайте удачу в уникальном игровом процессе!
Имейте уверенность, что ваши данные в безопасности во время игры.
홍대가라오케
부산풀싸롱
Try your luck with jilispin login and win a big prize today!
With encryption and frequent security checks, players can trust the platform’s integrity.
Immerse yourself in the world of exciting games and big wins with spingo88 login on spingo88!
As a result, players, whether new or experienced, can navigate the platform with ease.
777 bet online casino and dive into the world of gambling with unique offers!
The site is not only visually appealing but also highly functional, making gaming effortless.
Discover the best slot machines with mrlucky88 live.
A key reason for mrlucky88’s fame is an unconventional gaming strategy.
Try your luck in jilispin login and enjoy exciting slots from Jili!
This popular Jili Spin slot delivers thrilling gameplay through engaging visual designs.
Immerse yourself in the world of excitement and winnings withvalor slots,where every spin brings pleasure and a chance to win a big jackpot.
Situated centrally, it provides numerous gaming opportunities to cater to every kind of player.
onion browser
Understanding the Dark Web and How to Access It
Dark Web Meaning
The darknet is a hidden part of the internet that cannot be accessed through traditional browsers. When users search for what is dark web or dark web meaning, they usually refer to anonymous online networks that require special software and rely on encryption to conceal identities. Most dark web sites operate on the .onion domain.
Unlike the public web, the dark web is not indexed by Google or traditional search engines.
How to Get on the Dark Web
To understand how to get on dark web, users need a specialized dark web browser.
The most common option is the Tor Browser:
Available via Tor Browser download for Windows, macOS and Linux systems
Also available as Tor Browser for Android
Directs traffic through several encrypted nodes (onion routing)
For iOS users, Onion Browser is commonly used.
To browse the dark web safely, users often use Tor together with basic security practices and refrain from sharing personal data.
Dark Web Search Engines and Links
Since Google does not list the dark web, users rely on a dark web search engine such as:
Ahmia search
Torch dark web
Onion search
DuckDuckGo dark web (via Tor)
Directories like the Hidden Wiki directory provide collections of darknet links, but a significant number of links are outdated or unsafe.
Dark Web Markets and Risks
Dark web markets are known for anonymous trading, often using digital currencies. The best-known example is the Silk Road dark web, which was shut down by authorities.
Topics like dark web drugs and financial fraud have led to increased law enforcement attention. Many markets are scams or temporary.
Monitoring the Dark Web for Data Leaks
Users often ask is my info on dark web. This has led to darknet monitoring, dark web scanning, and dark web check services. These tools search for leaked emails, passwords, or financial data and may send a dark web alert if a data leak is detected.
Conclusion
The dark web is not completely illegal, but it involves significant risks. Darknet sites are used both for privacy-focused communication and for illegal activities. Anyone exploring the dark web should be aware of the technology, legal boundaries, and security implications before proceeding.
Try your hand at online games on 125win login and win big prizes!
125win focuses on delivering an exceptional user interface that is both clear and user-friendly.
Try your luck and win big in slotgpt casino!
Moreover, impartial agencies routinely verify the fairness of the games.
Try your luck and win big withsurewin app.
The platform delivers consistent performance, making it accessible from different devices without hassle.
Dive into the world of excitement with juwa casino 777 online and win big!
Among the offerings are slot machines, traditional table games, and live dealer sessions.
Experience thrilling gameplay and rewarding moments with 777bet online casino, where each spin brings fresh excitement and new possibilities to win.
Bonuses and promotions are central to 777bet’s strategy for engaging and rewarding its user base.
Try your luck in an exciting gamezeus and hades slot and find out which god will win this battle!
High-paying symbols and bonuses contribute significantly to potential earnings.
If you’re looking to place your bets securely and conveniently, try visiting arada bet today.
In addition to sports betting, the platform also hosts casino games.
—
With a user-friendly interface, Arada Bet ensures an enjoyable experience for both beginners and experts.
Try your luck and win big withsurewin malaysia.
There are frequent promotions and cashback rewards for loyal customers.
If you’re looking for an exciting challenge, try playing king thimbles today!
They serve as finger shields, preventing punctures while working with needles.
Dive into the thrilling world of online gambling with 1ace and enjoy an unforgettable gaming experience!
1ace is a fascinating topic that has garnered attention in various fields.
pas88
Acerca de cГіmo Sustentar nuestro CompensaciГіn entre nuestro Deporte y tambiГ©n en la Historia – Exagro
Discover the thrill of flying high with the exciting inverter game today!
Understanding multiplier patterns and payout spreads requires patience and study.
купить тяговый аккумулятор
Experience thrilling wins every day at 777bet login, your ultimate destination for online betting excitement.
Independent audits and strict licensing reinforce the integrity of 777bet’s services.
—
The site is designed with simplicity in mind, ensuring that anyone can place bets comfortably.
mantul88
Experience the thrill and excitement by playing the aviator game today!
Social interaction is a major appeal for many aviator game enthusiasts.
pg slot
แพลตฟอร์ม TKBNEKO นำเสนอ พื้นที่ออนไลน์ที่ทันสมัย ซึ่ง ผู้ใช้งาน สามารถ เข้ามาสัมผัส โลกแห่งเกมและความบันเทิง รวมถึง ระบบเดิมพันที่ให้ผลตอบแทนไว เว็บไซต์นี้ วางตำแหน่งตัวเองว่าเปิดโอกาสให้ทุกคนสร้างรายได้ เนื่องจาก ออกแบบมาให้เข้าถึงได้ทุกกลุ่มผู้เล่น
หนึ่งใน ฟีเจอร์หลัก ของแพลตฟอร์มนี้คือ ระบบการเงิน ซึ่งมีขั้นต่ำในการเติมเงินเพียง 1 บาท และขั้นต่ำในการถอนเงินก็เช่นเดียวกันที่ เท่ากับ 1 บาท เท่านั้น การฝากเงินเสร็จภายใน 3 วินาที ทำให้แพลตฟอร์มนี้ โดดเด่นด้านความเร็ว นอกจากนี้ยัง ไม่กำหนดเพดานการถอน ซึ่งเป็น ข้อได้เปรียบเมื่อเทียบกับแพลตฟอร์มอื่น
สำหรับการเติมเงิน รองรับการฝากเงินผ่าน QR Code ซึ่งเป็นระบบที่ ลดขั้นตอนที่ซับซ้อน
แพลตฟอร์มนี้มีเกมให้เลือก หลากหลายประเภท เช่น สล็อตออนไลน์, Live Casino, กีฬา และ Fishing Game ผู้เล่นสามารถดูรายชื่อเกมทั้งหมดได้ผ่านตัวกรอง “ครบทุกเกม” ซึ่งช่วยให้ เข้าถึงเกมโปรดได้สะดวก
TKBNEKO ให้ความสำคัญกับความโปร่งใสและมาตรฐานเกม โดยร่วมมือกับ ค่ายเกมชั้นนำที่ได้รับใบอนุญาต ซึ่งช่วยให้มั่นใจได้ว่า ทุกเกมเป็นไปตามมาตรฐานความปลอดภัย
TKBNEKO ได้ผสานระบบการชำระเงินเข้ากับ สถาบันการเงินหลักในไทย เช่น Krungthai Bank, Bangkok Bank, SCB, Kasikorn Bank, Thanachart Bank, GSB, TrueMoney Wallet, Citibank, UOB และ BAAC ทำให้การทำธุรกรรมทางการเงิน มีความสะดวกสบายและปลอดภัยมากยิ่งขึ้น
กล่าวโดยรวม TKBNEKO คือแพลตฟอร์มที่ ครบวงจรสำหรับเกมออนไลน์ สำหรับเกมออนไลน์และการเดิมพัน ด้วยเงื่อนไขขั้นต่ำที่ต่ำ การทำธุรกรรมที่รวดเร็ว และเกมให้เลือกมากมาย ทำให้แพลตฟอร์มนี้ ตอบโจทย์ทั้งมือใหม่และมืออาชีพ สมัครใช้งานได้ทันที และ ก้าวสู่โลกเกมออนไลน์ได้แล้ววันนี้
สล็อต
แพลตฟอร์ม TKBNEKO มอบ เว็บไซต์เกมออนไลน์ที่ล้ำสมัย ซึ่ง สมาชิก สามารถ เข้ามาสัมผัส ประสบการณ์เกมออนไลน์ รวมถึง ระบบเดิมพันที่ให้ผลตอบแทนไว เว็บไซต์นี้ สร้างภาพลักษณ์ว่าเป็นสถานที่ที่ทุกคนสามารถกลายเป็นเจ้าของธุรกิจได้ เนื่องจาก มีความสะดวกสบายและใช้งานง่าย
หนึ่งใน คุณสมบัติหลัก ของแพลตฟอร์มนี้คือ ระบบการเงิน ซึ่งมีขั้นต่ำในการเติมเงินเพียง ขั้นต่ำแค่ 1 บาท และขั้นต่ำในการถอนเงินก็เช่นเดียวกันที่ เริ่มต้น 1 บาท เท่านั้น กระบวนการเติมเงินใช้เวลาเพียง 3 วินาที ทำให้แพลตฟอร์มนี้ รองรับธุรกรรมฉับไว นอกจากนี้ยัง ไม่มีวงเงินจำกัดในการถอน ซึ่งเป็น ข้อได้เปรียบเมื่อเทียบกับแพลตฟอร์มอื่น
สำหรับการเติมเงิน สมาชิกสามารถสแกน QR Code เพื่อโอนเงิน ซึ่งเป็นระบบที่ เพิ่มความรวดเร็วในการทำธุรกรรม
แพลตฟอร์มนี้มีเกมให้เลือก ครบทุกหมวดหมู่ เช่น เกมสล็อต, คาสิโนสด, Sports Betting และ Fishing Game ผู้เล่นสามารถดูรายชื่อเกมทั้งหมดได้ผ่านตัวกรอง “All Games” ซึ่งช่วยให้ เข้าถึงเกมโปรดได้สะดวก
TKBNEKO มุ่งมั่นนำเสนอเกมที่ผ่านการรับรอง โดยร่วมมือกับ ค่ายเกมชั้นนำที่ได้รับใบอนุญาต ซึ่งช่วยให้มั่นใจได้ว่า ผู้เล่นจะได้รับประสบการณ์ที่โปร่งใสและปลอดภัย
TKBNEKO ได้ผสานระบบการชำระเงินเข้ากับ เครือข่ายธนาคารชั้นนำ เช่น Krungthai Bank, Bangkok Bank, SCB, Kasikorn Bank, Thanachart Bank, GSB, TrueMoney Wallet, Citibank, UOB และ BAAC ทำให้การทำธุรกรรมทางการเงิน ตอบโจทย์การโอนเงินแบบทันที
สรุปได้ว่า TKBNEKO คือแพลตฟอร์มที่ ครบวงจรสำหรับเกมออนไลน์ สำหรับเกมออนไลน์และการเดิมพัน ด้วยเงื่อนไขขั้นต่ำที่ต่ำ การทำธุรกรรมที่รวดเร็ว และเกมให้เลือกมากมาย ทำให้แพลตฟอร์มนี้ รองรับผู้เล่นทุกระดับ เริ่มต้นประสบการณ์ได้ทันที และ สัมผัสความสนุกในรูปแบบใหม่
สล็อต
TKBNEKO มอบมิติใหม่ของเกมออนไลน์ ฝาก-ถอนไว ด้วยระบบสแกน คิวอาร์โค้ด
ในยุคดิจิทัลที่ เทคโนโลยีพัฒนาอย่างรวดเร็ว เรามุ่งเน้นมาตรฐานใหม่ของการเดิมพัน ด้วยระบบที่ ล้ำสมัย รวดเร็ว และ โปร่งใส เพื่อให้ผู้เล่น มั่นใจ ทุกครั้งที่ใช้งาน
ระบบการเงินที่ใช้งานง่าย
ฝากขั้นต่ำ: 1 บาท
ถอนขั้นต่ำ: ขั้นต่ำ 1 บาท
เวลาฝากเงิน: ใช้เวลาเพียง 3 วินาที
ยอดถอน: ไม่มีลิมิต
เติมเงินง่าย แค่สแกน
สแกน QR Code ระบบจะ ประมวลผลอัตโนมัติ ขั้นต่ำ 100 บาท สูงสุด ไม่เกิน 500,000 บาทต่อครั้ง
เกมยอดนิยม
สล็อต: ลุ้นแจ็คพอต
เกมสด: คาสิโนเรียลไทม์
กีฬา: แมตช์ทั่วโลก
ยิงปลา: สนุกได้เงินจริง
โปรโมชั่นและสิทธิพิเศษ
ติดตามหน้า โปรโมชั่น พร้อมระบบ VIP และโปรแกรม พันธมิตร
ฝ่ายบริการลูกค้า
สอบถามข้อมูลได้ตลอด 24 ชั่วโมง ผ่านหน้า ติดต่อเรา ทีมงาน TKBNEKO พร้อมดูแลตลอดเวลา
PG Slot สล็อตยอดฮิต เล่นง่าย ฝากถอนเร็ว
คำค้นหา pg slot ถูกค้นหามากขึ้นเรื่อยๆ ในกลุ่มผู้เล่นเกมสล็อตออนไลน์ เพราะเป็น ผู้ให้บริการเกมสล็อตที่มาแรง ด้าน ภาพและเอฟเฟกต์ ความ เสถียร และ โอกาสรับกำไรที่ดี เกมของ PG ออกแบบโดยทีมงานมืออาชีพ ที่รองรับการเล่นทั้งบน โทรศัพท์มือถือ และ เดสก์ท็อป
ข้อดี ของ PG Slot
pg slot เป็นเกมสล็อตออนไลน์ที่ออกแบบมาให้ เปิดเกมได้ทันที เล่นผ่าน ระบบออนไลน์ และรองรับ ทั้ง iOS และ Android เข้าเล่นผ่านเว็บได้เลย ผู้เล่นสามารถเข้าเล่นผ่าน Browser ได้ทันที ภาพและเสียงถูกพัฒนาในรูปแบบ สามมิติ ให้ความคมชัด พร้อมเอฟเฟกต์ จัดเต็ม
คุณสมบัติหลักของเกม PG Slot ได้แก่
มีรอบโบนัสให้ลุ้นบ่อย
ระบบตัวคูณ
โหมดทดลองเล่นฟรี
มีเมนูภาษาไทย
ระบบฝากถอนสะดวก ไม่ต้องรอนาน
แพลตฟอร์ม pg slot ส่วนใหญ่รองรับ การฝาก-ถอน อัตโนมัติ 24 ชั่วโมง ขั้นต่ำเริ่มต้นเพียง 1 บาท ขึ้นอยู่กับ เงื่อนไขของเว็บไซต์ การทำรายการใช้เวลา ไม่กี่วินาที ผ่าน คิวอาร์โค้ด หรือระบบ ธนาคารบนมือถือ ทำให้ธุรกรรมเป็นไปอย่าง ไม่สะดุด
หมวดเกมฮิต ใน pg slot
เกม pg slot มีธีมหลากหลาย เช่น
ธีม เทพเจ้า
ธีม ผจญภัย
ธีม เอเชียและโชคลาภ
ธีม ธรรมชาติ
เกมยอดนิยมมักเป็นเกมที่แตกง่าย พร้อมระบบ โบนัสรอบพิเศษ และ อัตราการจ่ายที่สูง เหมาะกับทั้ง ผู้เล่นเริ่มต้น และ ผู้เล่นที่มีประสบการณ์
มาตรฐานระบบ
pg slot พัฒนาในระบบสากล มีการ รักษาความปลอดภัย และใช้ระบบสุ่มผล Random Number Generator เพื่อให้ผลลัพธ์ ยุติธรรม แพลตฟอร์มที่ให้บริการ pg slot ควรมี ระบบดูแลข้อมูล
สรุป
pg slot เป็นตัวเลือกยอดนิยมสำหรับผู้ที่ต้องการเล่นสล็อตออนไลน์ ด้วยจุดเด่นด้าน กราฟิกคุณภาพ และการทำธุรกรรมที่ ไว ผู้เล่นสามารถเริ่มต้นได้ ไม่ซับซ้อน ฝากถอนสะดวก และเลือกเกมได้ ครบทุกหมวด เหมาะสำหรับ ทั้งมือใหม่และมือโปร ในโลกของเกมสล็อตออนไลน์
ทดลองเล่นสล็อต pg ซื้อฟรีสปิน
мелбет казино вход
Установить приложение Melbet: Android, iPhone и компьютер
Приложение Melbet включает ставки и казино в одном интерфейсе. Пользователю доступны live-ставки, слоты, прямые трансляции, аналитика и быстрые финансовые операции. Загрузка занимает 1–2 минуты.
Android (APK)
Загрузите APK с официального источника, откройте файл и завершите установку. При необходимости включите доступ к установке сторонних приложений, затем войдите в аккаунт.
iOS (iPhone)
Перейдите в App Store, введите в поиске «Melbet», выберите «Получить», после установки выполните вход.
ПК
Перейдите официальный сайт, авторизуйтесь и добавьте ярлык на рабочий стол. Браузерная версия функционирует как полноценное приложение.
Функционал
Live-ставки с мгновенным обновлением линии, игровой раздел с тысячами игр, прямые трансляции, аналитические данные, уведомления о матчах, регистрация за минуту и поддержка 24/7.
Бонусы
После установки доступны бонус на первый депозит, промокоды и фрибеты. Условия зависят от региона.
Безопасность
Загружайте только с официального сайта, контролируйте адрес сайта, не сообщайте данные доступа третьим лицам и включите 2FA.
Загрузка выполняется быстро, после чего открывается полный доступ Melbet.
pg slot เกมสล็อตออนไลน์ที่คนค้นหาเยอะ เข้าเล่นไว ฝากถอนออโต้
คำค้นหา pg slot ถูกค้นหามากขึ้นเรื่อยๆ ในกลุ่มผู้เล่นเกมสล็อตออนไลน์ เพราะเป็น ค่ายเกมที่มีชื่อเสียง ด้าน ภาพและเอฟเฟกต์ ความ เสถียร และ ระบบจ่ายที่ดึงดูด เกมของ PG ผลิตโดยค่ายมาตรฐาน ที่รองรับการเล่นทั้งบน มือถือ และ เดสก์ท็อป
ความโดดเด่น ของ pg slot
PG Slot เป็นเกมสล็อตออนไลน์ที่ออกแบบมาให้ โหลดเร็ว เล่นผ่าน ระบบออนไลน์ และรองรับ ทั้ง iOS และ Android ไม่ต้องติดตั้งเพิ่มเติม ผู้เล่นสามารถเข้าเล่นผ่าน Browser ได้ทันที ภาพและเสียงถูกพัฒนาในรูปแบบ สามมิติ ให้ความคมชัด พร้อมเอฟเฟกต์ สมจริง
คุณสมบัติหลักของเกม PG Slot ได้แก่
โบนัสและฟรีสปินหลายแบบ
ระบบตัวคูณ
โหมดทดลองเล่นฟรี
มีเมนูภาษาไทย
ระบบการเงินรวดเร็ว ไม่ต้องรอนาน
แพลตฟอร์ม PG Slot มักมี การฝาก-ถอน ฝากถอนตลอดเวลา ขั้นต่ำเริ่มต้นเพียง 1 บาท ขึ้นอยู่กับ กติกาแต่ละแพลตฟอร์ม การทำรายการใช้เวลา รวดเร็วมาก ผ่าน คิวอาร์โค้ด หรือระบบ Mobile Banking ทำให้ธุรกรรมเป็นไปอย่าง ลื่นไหล
แนวเกมที่คนเล่นเยอะ ใน pg slot
เกม สล็อต PG มีธีมหลากหลาย เช่น
ธีม แฟนตาซี
ธีม ลุยด่าน
ธีม เอเชียและโชคลาภ
ธีม สัตว์และธรรมชาติ
เกมยอดนิยมมักเป็นเกมที่แตกง่าย พร้อมระบบ Special Feature และ โอกาสทำกำไรสูง เหมาะกับทั้ง ผู้เล่นเริ่มต้น และ ผู้เล่นที่มีประสบการณ์
ความปลอดภัย
สล็อต PG ใช้ระบบที่ได้มาตรฐาน มีการ ปกป้องข้อมูลผู้เล่น และใช้ระบบสุ่มผล RNG เพื่อให้ผลลัพธ์ ยุติธรรม แพลตฟอร์มที่ให้บริการ PG Slot ควรมี ทีมซัพพอร์ต 24 ชม.
บทสรุปท้ายบท
pg slot เป็นตัวเลือกยอดนิยมสำหรับผู้ที่ต้องการเล่นสล็อตออนไลน์ ด้วยจุดเด่นด้าน กราฟิกคุณภาพ และการทำธุรกรรมที่ รวดเร็ว ผู้เล่นสามารถเริ่มต้นได้ ง่าย ฝากถอนสะดวก และเลือกเกมได้ หลากหลายแนว เหมาะสำหรับ ผู้เล่นทุกสไตล์ ในโลกของเกมสล็อตออนไลน์
мелбет фрибет без депозита
Скачать приложение Melbet: Android, iPhone и компьютер
Приложение Melbet включает ставки и казино в одном интерфейсе. Доступны live-ставки, казино-игры, прямые трансляции, аналитика и быстрые финансовые операции. Установка занимает 1–2 минуты.
Android (APK)
Загрузите APK с официального сайта, запустите установщик и подтвердите установку. При необходимости включите доступ к установке сторонних приложений, затем войдите в аккаунт.
iOS (iPhone)
Перейдите в App Store, найдите «Melbet», выберите «Получить», после установки авторизуйтесь в системе.
ПК
Перейдите официальный сайт, авторизуйтесь и добавьте ярлык на рабочий стол. Веб-версия работает как отдельное приложение.
Функционал
Live-ставки с обновлением коэффициентов, игровой раздел с тысячами игр, прямые трансляции, аналитические данные, push-оповещения, регистрация за минуту и поддержка 24/7.
Бонусы
После установки доступны бонус на первый депозит, промокоды и фрибеты. Правила начисления определяются регионом.
Безопасность
Скачивайте только с официальных источников, контролируйте адрес сайта, не передавайте пароль третьим лицам и активируйте двухфакторную аутентификацию.
Загрузка выполняется быстро, после чего открывается полный доступ Melbet.
ทดลองเล่นสล็อต pg
pg slot เกมสล็อตออนไลน์ที่คนค้นหาเยอะ ใช้งานง่าย ฝากถอนรวดเร็ว
คำค้นหา PG Slot ถูกค้นหามากขึ้นเรื่อยๆ ในกลุ่มผู้เล่นเกมสล็อตออนไลน์ เพราะเป็น แบรนด์เกมที่โดดเด่น ด้าน กราฟิก ความ นิ่งไม่สะดุด และ โอกาสรับกำไรที่ดี เกมของ PG พัฒนาโดยผู้ให้บริการชั้นนำ ที่รองรับการเล่นทั้งบน สมาร์ทโฟน และ พีซี
ข้อดี ของ pg slot
pg slot เป็นเกมสล็อตออนไลน์ที่ออกแบบมาให้ เปิดเกมได้ทันที เล่นผ่าน ระบบออนไลน์ และรองรับ ทุกอุปกรณ์ ไม่ต้องดาวน์โหลดแอป ผู้เล่นสามารถเข้าเล่นผ่าน Browser ได้ทันที ภาพและเสียงถูกพัฒนาในรูปแบบ 3D ให้ความคมชัด พร้อมเอฟเฟกต์ จัดเต็ม
คุณสมบัติหลักของเกม สล็อต PG ได้แก่
มีรอบโบนัสให้ลุ้นบ่อย
ระบบตัวคูณ
โหมดทดลองเล่นฟรี
ใช้งานภาษาไทยง่าย
ฝากถอนง่าย ไม่ต้องรอนาน
แพลตฟอร์ม pg slot ส่วนใหญ่รองรับ การฝาก-ถอน อัตโนมัติ 24 ชั่วโมง ขั้นต่ำเริ่มต้นเพียง 10 บาท ขึ้นอยู่กับ กติกาแต่ละแพลตฟอร์ม การทำรายการใช้เวลา เพียงไม่กี่วินาที ผ่าน คิวอาร์โค้ด หรือระบบ Mobile Banking ทำให้ธุรกรรมเป็นไปอย่าง ลื่นไหล
หมวดเกมฮิต ใน PG Slot
เกม PG Slot มีธีมหลากหลาย เช่น
ธีม แฟนตาซี
ธีม ลุยด่าน
ธีม โชคลาภ
ธีม สัตว์และธรรมชาติ
หลายคนชอบเกมที่โบนัสเข้าไว พร้อมระบบ Special Feature และ โอกาสทำกำไรสูง เหมาะกับทั้ง คนเพิ่งเล่น และ ผู้เล่นที่มีประสบการณ์
มาตรฐานระบบ
สล็อต PG พัฒนาในระบบสากล มีการ เข้ารหัสข้อมูล และใช้ระบบสุ่มผล Random Number Generator เพื่อให้ผลลัพธ์ ตรวจสอบได้ แพลตฟอร์มที่ให้บริการ สล็อต PG ควรมี ความปลอดภัยสูง
บทสรุปท้ายบท
สล็อต PG เป็นตัวเลือกยอดนิยมสำหรับผู้ที่ต้องการเล่นสล็อตออนไลน์ ด้วยจุดเด่นด้าน กราฟิกคุณภาพ และการทำธุรกรรมที่ รวดเร็ว ผู้เล่นสามารถเริ่มต้นได้ ง่าย ฝากถอนสะดวก และเลือกเกมได้ ครบทุกหมวด เหมาะสำหรับ ทุกระดับประสบการณ์ ในโลกของเกมสล็อตออนไลน์
ทดลองเล่นสล็อต pg
แพลตฟอร์ม TKBNEKO มอบมิติใหม่ของเกมออนไลน์ ฝาก-ถอนไว ด้วยระบบสแกน คิวอาร์โค้ด
ในยุคดิจิทัลที่ โลกออนไลน์เติบโตต่อเนื่อง เรามุ่งเน้นมาตรฐานใหม่ของการเดิมพัน ด้วยระบบที่ ล้ำสมัย เสถียร และ ตรวจสอบได้ เพื่อให้ผู้เล่น อุ่นใจ ทุกครั้งที่ใช้งาน
ระบบการเงินที่ใช้งานง่าย
ฝากขั้นต่ำ: เริ่มต้น 1 บาท
ถอนขั้นต่ำ: ขั้นต่ำ 1 บาท
เวลาฝากเงิน: ภายใน 3 วินาที
ยอดถอน: ไม่จำกัดต่อวัน
ฝากง่าย เพียงสแกน QR Code
สแกน คิวอาร์ ระบบจะ โอนเงินเข้าทันที ขั้นต่ำ 100 บาท สูงสุด ไม่เกิน 500,000 บาทต่อครั้ง
เกมยอดนิยม
สล็อต: ลุ้นแจ็คพอต
เกมสด: คาสิโนเรียลไทม์
กีฬา: แมตช์ทั่วโลก
ยิงปลา: ลุ้นกำไรทันที
โปรโมชั่นและสิทธิพิเศษ
ติดตามหน้า โปรโมชั่น พร้อมระบบ สมาชิกพรีเมียม และโปรแกรม แอฟฟิลิเอต
ฝ่ายบริการลูกค้า
สอบถามข้อมูลได้ตลอด 24 ชั่วโมง ผ่านหน้า ติดต่อเรา ทีมงาน ของเรา พร้อมดูแลตลอดเวลา
melbet скачать приложение
Установить приложение Melbet: APK, iPhone и компьютер
Мобильная версия Melbet включает букмекерскую контору и казино в едином приложении. Доступны live-ставки, слоты, онлайн-трансляции, аналитика и операции по счёту. Установка занимает 1–2 минуты.
Android (APK)
Загрузите APK с официального источника, откройте файл и подтвердите установку. Если требуется включите разрешение на установку из неизвестных источников, затем войдите в аккаунт.
iOS (iPhone)
Перейдите в App Store, найдите «Melbet», нажмите «Получить», после установки авторизуйтесь в системе.
ПК
Перейдите официальный сайт, авторизуйтесь и создайте ярлык на рабочий стол. Веб-версия работает как отдельное приложение.
Функционал
Live-ставки с обновлением коэффициентов, игровой раздел с тысячами игр, просмотр матчей, подробная статистика, уведомления о матчах, регистрация за минуту и поддержка 24/7.
Бонусы
После установки доступны приветственный бонус, акционные коды и фрибеты. Условия зависят от региона.
Безопасность
Загружайте только с официального сайта, проверяйте домен, не передавайте пароль третьим лицам и активируйте двухфакторную аутентификацию.
Загрузка выполняется быстро, после чего доступен весь функционал Melbet.
pg
เว็บไซต์ TKBNEKO พาคุณสู่โลกใหม่ของเกมเดิมพันออนไลน์ ฝาก-ถอนไว ด้วยระบบสแกน คิวอาร์โค้ด
ในยุคที่ โลกออนไลน์พัฒนาอย่างรวดเร็ว TKBNEKO พร้อมยกระดับมาตรฐานการเดิมพัน ด้วยระบบการให้บริการที่ ทันสมัย รวดเร็ว และ ตรวจสอบได้ พร้อมต้อนรับสมาชิกทุกท่านสู่ มิติใหม่แห่งความสนุก ที่ เปิดโอกาสให้ทุกคนสร้างรายได้
เหตุผลที่ควรเลือก TKBNEKO
เราคัดสรรเกมคุณภาพจากผู้พัฒนาชั้นนำ โดยเฉพาะเกมที่ ผ่านการรับรองจากสถาบันที่น่าเชื่อถือ และ ได้มาตรฐานสากล เพื่อให้ผู้เล่นทุกคน มั่นใจ ได้ว่า จะได้รับความเพลิดเพลินกับเกมที่ ไม่มีการเอาเปรียบ ข้อมูลไม่รั่วไหล และ ตอบโจทย์ผู้เล่นยุคใหม่
จุดเด่นของระบบฝาก-ถอน
เราออกแบบระบบการเงินให้ง่ายและเร็วที่สุด เพื่อให้คุณ เล่นเกมได้แบบไม่สะดุด
ฝากขั้นต่ำ: เพียง 1 บาท
ถอนขั้นต่ำ: 1 บาท
เวลาฝากเงิน: รวดเร็วทันใจใน 3 วินาที
ยอดจำกัดการถอน: ถอนได้ไม่จำกัดยอด
เติมเงินง่ายด้วย QR Code
เพียงคุณสแกน คิวอาร์ ระบบของเราจะ ดำเนินการฝากเงินให้อัตโนมัติ ขั้นต่ำเพียง 100 บาท และสามารถฝากได้สูงถึง 500,000 บาท เริ่มต้นได้ทันที กับ TKBNEKO ที่ ตอบโจทย์การเดิมพันยุคใหม่
หมวดหมู่เกมที่ครบครัน
แพลตฟอร์มของเราครอบคลุมทุกแนวเกม รองรับทุกความชอบของผู้เล่น
สล็อต: แจ็คพอตแตกง่าย ลุ้นได้ทุกวัน
เกมสด: สัมผัสประสบการณ์คาสิโนแบบเรียลไทม์
กีฬา: เดิมพันกับแมตช์การแข่งขันจากทั่วโลก
ยิงปลา: ลุ้นกำไรจากเกมยิงปลา
รับโบนัสและข้อเสนอสุดคุ้ม
อย่าลืมแวะมาเยี่ยมชมที่หน้า โบนัส เพื่อรับ ของรางวัลพิเศษ ที่เรามอบให้สมาชิกทุกท่าน นอกจากนี้ยังมีระบบ สมาชิกวีไอพี สำหรับลูกค้าคนสำคัญ และช่องทาง พันธมิตร สำหรับผู้ที่สนใจสร้างรายได้ร่วมกับเรา
ติดต่อเรา
หากมี ข้อสงสัย หรือ ความคิดเห็น สามารถติดต่อทีมงานของเราได้ตลอด 24 ชั่วโมงที่หน้า ติดต่อเรา และ ส่งความคิดเห็น ทีมงาน ของเรา ยินดีให้บริการทุกท่านด้วยใจ
ทดลองเล่นสล็อต pg เว็บ ตรง”
pg slot สล็อตยอดฮิต เข้าเล่นไว ฝากถอนออโต้
คำค้นหา pg slot กำลังได้รับความนิยมอย่างต่อเนื่อง ในกลุ่มผู้เล่นเกมสล็อตออนไลน์ เพราะเป็น ผู้ให้บริการเกมสล็อตที่มาแรง ด้าน งานภาพคุณภาพสูง ความ เสถียร และ โอกาสรับกำไรที่ดี เกมของ PG ผลิตโดยค่ายมาตรฐาน ที่รองรับการเล่นทั้งบน โทรศัพท์มือถือ และ พีซี
จุดเด่น ของ pg slot
สล็อต PG เป็นเกมสล็อตออนไลน์ที่ออกแบบมาให้ โหลดเร็ว เล่นผ่าน ระบบอัตโนมัติ และรองรับ ทั้ง iOS และ Android เข้าเล่นผ่านเว็บได้เลย ผู้เล่นสามารถเข้าเล่นผ่าน Browser ได้ทันที ภาพและเสียงถูกพัฒนาในรูปแบบ สามมิติ ให้ความคมชัด พร้อมเอฟเฟกต์ จัดเต็ม
คุณสมบัติหลักของเกม PG Slot ได้แก่
โบนัสและฟรีสปินหลายแบบ
ระบบตัวคูณ
เดโม่ฟรี
รองรับภาษาไทยเต็มรูปแบบ
ฝากถอนง่าย ทำรายการไว
แพลตฟอร์ม สล็อต PG โดยทั่วไปให้บริการ การฝาก-ถอน ฝากถอนตลอดเวลา ขั้นต่ำเริ่มต้นเพียง หลักหน่วย ขึ้นอยู่กับ เงื่อนไขของเว็บไซต์ การทำรายการใช้เวลา เพียงไม่กี่วินาที ผ่าน QR Code หรือระบบ แอปธนาคาร ทำให้ธุรกรรมเป็นไปอย่าง ลื่นไหล
หมวดเกมฮิต ใน PG Slot
เกม pg slot มีธีมหลากหลาย เช่น
ธีม เทพเจ้าและแฟนตาซี
ธีม Adventure
ธีม เอเชียและโชคลาภ
ธีม ธรรมชาติ
เกมยอดนิยมมักเป็นเกมที่แตกง่าย พร้อมระบบ Special Feature และ โอกาสทำกำไรสูง เหมาะกับทั้ง มือใหม่ และ ผู้เล่นมือโปร
ความปลอดภัย
pg slot มีมาตรฐานรองรับ มีการ รักษาความปลอดภัย และใช้ระบบสุ่มผล Random Number Generator เพื่อให้ผลลัพธ์ ยุติธรรม แพลตฟอร์มที่ให้บริการ PG Slot ควรมี ทีมซัพพอร์ต 24 ชม.
บทสรุปท้ายบท
pg slot เป็นตัวเลือกยอดนิยมสำหรับผู้ที่ต้องการเล่นสล็อตออนไลน์ ด้วยจุดเด่นด้าน ระบบลื่นไหล และการทำธุรกรรมที่ รวดเร็ว ผู้เล่นสามารถเริ่มต้นได้ ทันที ฝากถอนสะดวก และเลือกเกมได้ จำนวนมาก เหมาะสำหรับ ทุกระดับประสบการณ์ ในโลกของเกมสล็อตออนไลน์
ทดลองเล่นสล็อต pg ไม่ เด้ง
สล็อต
แพลตฟอร์ม TKBNEKO เปิดประสบการณ์ใหม่แห่งการเดิมพันออนไลน์ ธุรกรรมรวดเร็ว ด้วยระบบสแกน QR Code
ในยุคดิจิทัลที่ เทคโนโลยีพัฒนาอย่างรวดเร็ว TKBNEKO พร้อมยกระดับการให้บริการ ด้วยระบบที่ ล้ำสมัย รวดเร็ว และ โปร่งใส เพื่อให้ผู้เล่น อุ่นใจ ทุกครั้งที่ใช้งาน
จุดเด่นระบบฝาก-ถอน
ฝากขั้นต่ำ: 1 บาท
ถอนขั้นต่ำ: ขั้นต่ำ 1 บาท
เวลาฝากเงิน: ภายใน 3 วินาที
ยอดถอน: ไม่จำกัดต่อวัน
เติมเงินง่าย แค่สแกน
สแกน คิวอาร์ ระบบจะ ประมวลผลอัตโนมัติ ขั้นต่ำ เริ่ม 100 บาท สูงสุด ไม่เกิน 500,000 บาทต่อครั้ง
เกมยอดนิยม
สล็อต: ลุ้นแจ็คพอต
เกมสด: ดีลเลอร์สด
กีฬา: แมตช์ทั่วโลก
ยิงปลา: สนุกได้เงินจริง
โปรโมชั่นและสิทธิพิเศษ
ติดตามหน้า โบนัส พร้อมระบบ สมาชิกพรีเมียม และโปรแกรม พันธมิตร
ติดต่อเรา
สอบถามข้อมูลได้ตลอด 24 ชั่วโมง ผ่านหน้า ติดต่อเรา ทีมงาน ของเรา พร้อมดูแลตลอดเวลา
PG Slot แพลตฟอร์มเกมสล็อตยอดนิยม ใช้งานง่าย ฝากถอนรวดเร็ว
คำค้นหา PG Slot ถูกค้นหามากขึ้นเรื่อยๆ ในกลุ่มผู้เล่นเกมสล็อตออนไลน์ เพราะเป็น ค่ายเกมที่มีชื่อเสียง ด้าน งานภาพคุณภาพสูง ความ เสถียร และ อัตราการจ่ายรางวัลที่น่าสนใจ เกมของ PG พัฒนาโดยผู้ให้บริการชั้นนำ ที่รองรับการเล่นทั้งบน มือถือ และ พีซี
ข้อดี ของ PG Slot
สล็อต PG เป็นเกมสล็อตออนไลน์ที่ออกแบบมาให้ เปิดเกมได้ทันที เล่นผ่าน ระบบเว็บ และรองรับ ทุกแพลตฟอร์ม เข้าเล่นผ่านเว็บได้เลย ผู้เล่นสามารถเข้าเล่นผ่าน เว็บเบราว์เซอร์ ได้ทันที ภาพและเสียงถูกพัฒนาในรูปแบบ สามมิติ ให้ความคมชัด พร้อมเอฟเฟกต์ สวยงาม
คุณสมบัติหลักของเกม pg slot ได้แก่
มีรอบโบนัสให้ลุ้นบ่อย
ระบบตัวคูณ
เล่นฟรีก่อนเติมเงิน
รองรับภาษาไทยเต็มรูปแบบ
ระบบฝากถอนสะดวก ไม่ต้องรอนาน
แพลตฟอร์ม PG Slot โดยทั่วไปให้บริการ การฝาก-ถอน ออโต้ตลอด 24 ชม. ขั้นต่ำเริ่มต้นเพียง 10 บาท ขึ้นอยู่กับ เงื่อนไขของเว็บไซต์ การทำรายการใช้เวลา เพียงไม่กี่วินาที ผ่าน คิวอาร์โค้ด หรือระบบ Mobile Banking ทำให้ธุรกรรมเป็นไปอย่าง ต่อเนื่อง
แนวเกมที่คนเล่นเยอะ ใน pg slot
เกม PG Slot มีธีมหลากหลาย เช่น
ธีม เทพเจ้าและแฟนตาซี
ธีม Adventure
ธีม เอเชียและโชคลาภ
ธีม ธรรมชาติ
ผู้เล่นนิยมเกมที่มีรอบพิเศษบ่อย พร้อมระบบ ฟีเจอร์พิเศษ และ โอกาสทำกำไรสูง เหมาะกับทั้ง ผู้เล่นเริ่มต้น และ ผู้เล่นมือโปร
มาตรฐานระบบ
pg slot พัฒนาในระบบสากล มีการ เข้ารหัสข้อมูล และใช้ระบบสุ่มผล ระบบสุ่มมาตรฐาน เพื่อให้ผลลัพธ์ ตรวจสอบได้ แพลตฟอร์มที่ให้บริการ สล็อต PG ควรมี ทีมซัพพอร์ต 24 ชม.
บทสรุปท้ายบท
pg slot เป็นตัวเลือกยอดนิยมสำหรับผู้ที่ต้องการเล่นสล็อตออนไลน์ ด้วยจุดเด่นด้าน กราฟิกคุณภาพ และการทำธุรกรรมที่ ไว ผู้เล่นสามารถเริ่มต้นได้ ไม่ซับซ้อน ฝากถอนสะดวก และเลือกเกมได้ หลากหลายแนว เหมาะสำหรับ ทั้งมือใหม่และมือโปร ในโลกของเกมสล็อตออนไลน์
https://medium.com/@ratypw/ทดลองเล่นสล็อต-pg-70cdb1132344
สล็อต PG แพลตฟอร์มเกมสล็อตยอดนิยม เล่นง่าย ฝากถอนเร็ว
คำค้นหา สล็อต PG ถูกค้นหามากขึ้นเรื่อยๆ ในกลุ่มผู้เล่นเกมสล็อตออนไลน์ เพราะเป็น แบรนด์เกมที่โดดเด่น ด้าน ภาพและเอฟเฟกต์ ความ นิ่งไม่สะดุด และ อัตราการจ่ายรางวัลที่น่าสนใจ เกมของ PG ผลิตโดยค่ายมาตรฐาน ที่รองรับการเล่นทั้งบน สมาร์ทโฟน และ คอมพิวเตอร์
ข้อดี ของ PG Slot
pg slot เป็นเกมสล็อตออนไลน์ที่ออกแบบมาให้ เปิดเกมได้ทันที เล่นผ่าน ระบบเว็บ และรองรับ ทั้ง iOS และ Android ไม่ต้องติดตั้งเพิ่มเติม ผู้เล่นสามารถเข้าเล่นผ่าน หน้าเว็บ ได้ทันที ภาพและเสียงถูกพัฒนาในรูปแบบ สามมิติ ให้ความคมชัด พร้อมเอฟเฟกต์ สวยงาม
คุณสมบัติหลักของเกม PG Slot ได้แก่
ระบบโบนัสและฟรีสปินหลากหลายรูปแบบ
ฟีเจอร์ตัวคูณรางวัล
เดโม่ฟรี
รองรับภาษาไทยเต็มรูปแบบ
ระบบการเงินรวดเร็ว ทันใจ
แพลตฟอร์ม pg slot มักมี การฝาก-ถอน อัตโนมัติ 24 ชั่วโมง ขั้นต่ำเริ่มต้นเพียง หลักหน่วย ขึ้นอยู่กับ กติกาแต่ละแพลตฟอร์ม การทำรายการใช้เวลา ไม่กี่วินาที ผ่าน QR Code หรือระบบ Mobile Banking ทำให้ธุรกรรมเป็นไปอย่าง ลื่นไหล
หมวดเกมฮิต ใน pg slot
เกม PG Slot มีธีมหลากหลาย เช่น
ธีม แฟนตาซี
ธีม Adventure
ธีม โชคลาภ
ธีม Animal
หลายคนชอบเกมที่โบนัสเข้าไว พร้อมระบบ โบนัสรอบพิเศษ และ โอกาสทำกำไรสูง เหมาะกับทั้ง คนเพิ่งเล่น และ ผู้เล่นมือโปร
ความปลอดภัย
สล็อต PG มีมาตรฐานรองรับ มีการ ปกป้องข้อมูลผู้เล่น และใช้ระบบสุ่มผล Random Number Generator เพื่อให้ผลลัพธ์ ตรวจสอบได้ แพลตฟอร์มที่ให้บริการ สล็อต PG ควรมี ระบบดูแลข้อมูล
โดยภาพรวม
สล็อต PG เป็นตัวเลือกยอดนิยมสำหรับผู้ที่ต้องการเล่นสล็อตออนไลน์ ด้วยจุดเด่นด้าน โบนัสหลากหลาย และการทำธุรกรรมที่ ไว ผู้เล่นสามารถเริ่มต้นได้ ไม่ซับซ้อน ฝากถอนสะดวก และเลือกเกมได้ ครบทุกหมวด เหมาะสำหรับ ทุกระดับประสบการณ์ ในโลกของเกมสล็อตออนไลน์
https://medium.com/@ratypw/ทดลองเล่นสล็อต-pg-70cdb1132344
ทดลองเล่นสล็อต pg ฟรี PG Slot แพลตฟอร์มเกมสล็อตยอดนิยม ใช้งานง่าย ฝากถอนรวดเร็ว
คำค้นหา สล็อต PG กำลังได้รับความนิยมอย่างต่อเนื่อง ในกลุ่มผู้เล่นเกมสล็อตออนไลน์ เพราะเป็น ค่ายเกมที่มีชื่อเสียง ด้าน ภาพและเอฟเฟกต์ ความ นิ่งไม่สะดุด และ อัตราการจ่ายรางวัลที่น่าสนใจ เกมของ PG ผลิตโดยค่ายมาตรฐาน ที่รองรับการเล่นทั้งบน มือถือ และ คอมพิวเตอร์
ข้อดี ของ PG Slot
สล็อต PG เป็นเกมสล็อตออนไลน์ที่ออกแบบมาให้ เปิดเกมได้ทันที เล่นผ่าน ระบบเว็บ และรองรับ ทุกแพลตฟอร์ม เข้าเล่นผ่านเว็บได้เลย ผู้เล่นสามารถเข้าเล่นผ่าน เว็บเบราว์เซอร์ ได้ทันที ภาพและเสียงถูกพัฒนาในรูปแบบ 3D ให้ความคมชัด พร้อมเอฟเฟกต์ จัดเต็ม
คุณสมบัติหลักของเกม PG Slot ได้แก่
มีรอบโบนัสให้ลุ้นบ่อย
Multiplier
เดโม่ฟรี
ใช้งานภาษาไทยง่าย
ฝากถอนง่าย ทันใจ
แพลตฟอร์ม pg slot มักมี การฝาก-ถอน ฝากถอนตลอดเวลา ขั้นต่ำเริ่มต้นเพียง หลักหน่วย ขึ้นอยู่กับ กติกาแต่ละแพลตฟอร์ม การทำรายการใช้เวลา รวดเร็วมาก ผ่าน สแกน QR หรือระบบ แอปธนาคาร ทำให้ธุรกรรมเป็นไปอย่าง ต่อเนื่อง
แนวเกมที่คนเล่นเยอะ ใน PG Slot
เกม สล็อต PG มีธีมหลากหลาย เช่น
ธีม เทพเจ้า
ธีม Adventure
ธีม ความมั่งคั่ง
ธีม Animal
เกมยอดนิยมมักเป็นเกมที่แตกง่าย พร้อมระบบ โบนัสรอบพิเศษ และ โอกาสทำกำไรสูง เหมาะกับทั้ง ผู้เล่นเริ่มต้น และ ผู้เล่นที่มีประสบการณ์
ความปลอดภัย
pg slot ใช้ระบบที่ได้มาตรฐาน มีการ รักษาความปลอดภัย และใช้ระบบสุ่มผล ระบบสุ่มมาตรฐาน เพื่อให้ผลลัพธ์ โปร่งใส แพลตฟอร์มที่ให้บริการ pg slot ควรมี ทีมซัพพอร์ต 24 ชม.
โดยภาพรวม
PG Slot เป็นตัวเลือกยอดนิยมสำหรับผู้ที่ต้องการเล่นสล็อตออนไลน์ ด้วยจุดเด่นด้าน กราฟิกคุณภาพ และการทำธุรกรรมที่ ทันใจ ผู้เล่นสามารถเริ่มต้นได้ ไม่ซับซ้อน ฝากถอนสะดวก และเลือกเกมได้ หลากหลายแนว เหมาะสำหรับ ทุกระดับประสบการณ์ ในโลกของเกมสล็อตออนไลน์
PG Slot เกมสล็อตออนไลน์ที่คนค้นหาเยอะ เข้าเล่นไว ฝากถอนออโต้
คำค้นหา PG Slot ถูกค้นหามากขึ้นเรื่อยๆ ในกลุ่มผู้เล่นเกมสล็อตออนไลน์ เพราะเป็น ผู้ให้บริการเกมสล็อตที่มาแรง ด้าน กราฟิก ความ ลื่นไหล และ โอกาสรับกำไรที่ดี เกมของ PG ผลิตโดยค่ายมาตรฐาน ที่รองรับการเล่นทั้งบน สมาร์ทโฟน และ คอมพิวเตอร์
ข้อดี ของ pg slot
PG Slot เป็นเกมสล็อตออนไลน์ที่ออกแบบมาให้ โหลดเร็ว เล่นผ่าน ระบบออนไลน์ และรองรับ ทั้ง iOS และ Android เข้าเล่นผ่านเว็บได้เลย ผู้เล่นสามารถเข้าเล่นผ่าน หน้าเว็บ ได้ทันที ภาพและเสียงถูกพัฒนาในรูปแบบ 3D ให้ความคมชัด พร้อมเอฟเฟกต์ จัดเต็ม
คุณสมบัติหลักของเกม pg slot ได้แก่
ระบบโบนัสและฟรีสปินหลากหลายรูปแบบ
ระบบตัวคูณ
โหมดทดลองเล่นฟรี
รองรับภาษาไทยเต็มรูปแบบ
ระบบการเงินรวดเร็ว ไม่ต้องรอนาน
แพลตฟอร์ม pg slot ส่วนใหญ่รองรับ การฝาก-ถอน อัตโนมัติ 24 ชั่วโมง ขั้นต่ำเริ่มต้นเพียง 1 บาท ขึ้นอยู่กับ เงื่อนไขของเว็บไซต์ การทำรายการใช้เวลา ไม่กี่วินาที ผ่าน QR Code หรือระบบ แอปธนาคาร ทำให้ธุรกรรมเป็นไปอย่าง ลื่นไหล
ประเภทเกมยอดนิยม ใน pg slot
เกม PG Slot มีธีมหลากหลาย เช่น
ธีม แฟนตาซี
ธีม ลุยด่าน
ธีม ความมั่งคั่ง
ธีม สัตว์และธรรมชาติ
ผู้เล่นนิยมเกมที่มีรอบพิเศษบ่อย พร้อมระบบ Special Feature และ อัตราการจ่ายที่สูง เหมาะกับทั้ง มือใหม่ และ สายสล็อตจริงจัง
มาตรฐานระบบ
สล็อต PG มีมาตรฐานรองรับ มีการ รักษาความปลอดภัย และใช้ระบบสุ่มผล Random Number Generator เพื่อให้ผลลัพธ์ ยุติธรรม แพลตฟอร์มที่ให้บริการ PG Slot ควรมี ความปลอดภัยสูง
โดยภาพรวม
pg slot เป็นตัวเลือกยอดนิยมสำหรับผู้ที่ต้องการเล่นสล็อตออนไลน์ ด้วยจุดเด่นด้าน กราฟิกคุณภาพ และการทำธุรกรรมที่ ทันใจ ผู้เล่นสามารถเริ่มต้นได้ ง่าย ฝากถอนสะดวก และเลือกเกมได้ ครบทุกหมวด เหมาะสำหรับ ผู้เล่นทุกสไตล์ ในโลกของเกมสล็อตออนไลน์
ทดลองเล่นสล็อต pg ไม่ เด้ง
แพลตฟอร์ม TKBNEKO เปิดประสบการณ์ใหม่แห่งการเดิมพันออนไลน์ ฝาก-ถอนไว ด้วยระบบสแกน QR Code
ในยุคที่ เทคโนโลยีเปลี่ยนวิถีการเดิมพันออนไลน์ไปอย่างสิ้นเชิง TKBNEKO เข้ามาสร้างมาตรฐานใหม่ให้กับวงการ ด้วยระบบการให้บริการที่ อัปเดตตลอดเวลา ฉับไว และ โปร่งใส พร้อมต้อนรับสมาชิกทุกท่านสู่ ประสบการณ์ความบันเทิงรูปแบบใหม่ ที่ เปิดโอกาสให้ทุกคนสร้างรายได้
เพราะอะไรหลายคนจึงเลือก TKBNEKO
TKBNEKO มุ่งมั่นที่จะมอบประสบการณ์จากเกมลิขสิทธิ์แท้ โดยเฉพาะเกมที่ ผ่านการรับรองจากสถาบันที่น่าเชื่อถือ และ ได้มาตรฐานสากล เพื่อให้ผู้เล่นทุกคน สบายใจ ได้ว่า จะได้รับความเพลิดเพลินกับเกมที่ โปร่งใส ข้อมูลไม่รั่วไหล และ มีคุณภาพสูง
จุดเด่นของระบบฝาก-ถอน
เราออกแบบระบบการเงินให้ง่ายและเร็วที่สุด เพื่อให้คุณ โฟกัสกับความสนุกได้อย่างเต็มที่
ฝากขั้นต่ำ: เริ่มต้นเพียง 1 บาท
ถอนขั้นต่ำ: เพียง 1 บาท
เวลาฝากเงิน: เงินเข้าภายใน 3 วินาที
ยอดจำกัดการถอน: ไม่มียอดจำกัดต่อวัน
เติมเงินง่ายด้วย QR Code
เพียงคุณสแกน โค้ดคิวอาร์ ระบบของเราจะ ประมวลผลอย่างรวดเร็ว ขั้นต่ำเพียง 100 บาท และสามารถฝากได้สูงถึง ไม่เกิน 500,000 บาทต่อครั้ง เข้าร่วมความสนุกได้เลย กับ TKBNEKO ที่ ใช้งานง่าย ทำกำไรได้รวดเร็ว
คลังเกมคุณภาพ
เรารวบรวมเกมยอดนิยมหลากหลายประเภท รองรับทุกความชอบของผู้เล่น
สล็อต: ธีมมากมาย พร้อมลุ้นรางวัลใหญ่
เกมสด: สัมผัสประสบการณ์คาสิโนแบบเรียลไทม์
กีฬา: เดิมพันกับแมตช์การแข่งขันจากทั่วโลก
ยิงปลา: สนุกกับการยิงปลาแบบได้เงิน
รับโบนัสและข้อเสนอสุดคุ้ม
อย่าลืมแวะมาเยี่ยมชมที่หน้า โปรโมชันล่าสุด เพื่อรับ สิทธิพิเศษมากมาย ที่เรามอบให้สมาชิกทุกท่าน นอกจากนี้ยังมีระบบ สมาชิกวีไอพี สำหรับลูกค้าคนสำคัญ และช่องทาง แอฟฟิลิเอต สำหรับผู้ที่สนใจสร้างรายได้ร่วมกับเรา
ฝ่ายบริการลูกค้า
หากมี ข้อสงสัย หรือ คำแนะนำ สามารถติดต่อทีมงานของเราได้ตลอด 24 ชั่วโมงที่หน้า ฝ่ายสนับสนุน และ ส่งความคิดเห็น ทีมงาน ของเรา ยินดีให้บริการทุกท่านด้วยใจ
สล็อต
TKBNEKO เปิดประสบการณ์ใหม่แห่งการเดิมพันออนไลน์ ธุรกรรมรวดเร็ว ด้วยระบบสแกน คิวอาร์โค้ด
ในยุคดิจิทัลที่ โลกออนไลน์เติบโตต่อเนื่อง เรามุ่งเน้นมาตรฐานใหม่ของการเดิมพัน ด้วยระบบที่ ล้ำสมัย เสถียร และ ตรวจสอบได้ เพื่อให้ผู้เล่น อุ่นใจ ทุกครั้งที่ใช้งาน
ระบบการเงินที่ใช้งานง่าย
ฝากขั้นต่ำ: 1 บาท
ถอนขั้นต่ำ: ขั้นต่ำ 1 บาท
เวลาฝากเงิน: ใช้เวลาเพียง 3 วินาที
ยอดถอน: ไม่มีลิมิต
เติมเงินง่าย แค่สแกน
สแกน คิวอาร์ ระบบจะ โอนเงินเข้าทันที ขั้นต่ำ 100 บาท สูงสุด 500,000 บาท
เกมยอดนิยม
สล็อต: ธีมหลากหลาย
เกมสด: คาสิโนเรียลไทม์
กีฬา: แมตช์ทั่วโลก
ยิงปลา: ลุ้นกำไรทันที
โบนัสและโปรโมชัน
ติดตามหน้า โบนัส พร้อมระบบ VIP และโปรแกรม แอฟฟิลิเอต
ฝ่ายบริการลูกค้า
สอบถามข้อมูลได้ตลอด 24 ชั่วโมง ผ่านหน้า ศูนย์ช่วยเหลือ ทีมงาน TKBNEKO พร้อมดูแลตลอดเวลา
ทดลองเล่นสล็อต pg เว็บ ตรง”
สล็อต PG สล็อตยอดฮิต เล่นง่าย ฝากถอนเร็ว
คำค้นหา PG Slot ถูกค้นหามากขึ้นเรื่อยๆ ในกลุ่มผู้เล่นเกมสล็อตออนไลน์ เพราะเป็น ค่ายเกมที่มีชื่อเสียง ด้าน กราฟิก ความ เสถียร และ โอกาสรับกำไรที่ดี เกมของ PG พัฒนาโดยผู้ให้บริการชั้นนำ ที่รองรับการเล่นทั้งบน สมาร์ทโฟน และ เดสก์ท็อป
จุดเด่น ของ pg slot
PG Slot เป็นเกมสล็อตออนไลน์ที่ออกแบบมาให้ โหลดเร็ว เล่นผ่าน ระบบเว็บ และรองรับ ทั้ง iOS และ Android ไม่ต้องดาวน์โหลดแอป ผู้เล่นสามารถเข้าเล่นผ่าน Browser ได้ทันที ภาพและเสียงถูกพัฒนาในรูปแบบ 3D ให้ความคมชัด พร้อมเอฟเฟกต์ จัดเต็ม
คุณสมบัติหลักของเกม PG Slot ได้แก่
มีรอบโบนัสให้ลุ้นบ่อย
ฟีเจอร์ตัวคูณรางวัล
โหมดทดลองเล่นฟรี
รองรับภาษาไทยเต็มรูปแบบ
ระบบการเงินรวดเร็ว ไม่ต้องรอนาน
แพลตฟอร์ม PG Slot มักมี การฝาก-ถอน อัตโนมัติ 24 ชั่วโมง ขั้นต่ำเริ่มต้นเพียง 10 บาท ขึ้นอยู่กับ เงื่อนไขของเว็บไซต์ การทำรายการใช้เวลา เพียงไม่กี่วินาที ผ่าน QR Code หรือระบบ Mobile Banking ทำให้ธุรกรรมเป็นไปอย่าง ต่อเนื่อง
หมวดเกมฮิต ใน pg slot
เกม pg slot มีธีมหลากหลาย เช่น
ธีม เทพเจ้าและแฟนตาซี
ธีม ลุยด่าน
ธีม เอเชียและโชคลาภ
ธีม สัตว์และธรรมชาติ
หลายคนชอบเกมที่โบนัสเข้าไว พร้อมระบบ โบนัสรอบพิเศษ และ อัตราการจ่ายที่สูง เหมาะกับทั้ง ผู้เล่นเริ่มต้น และ ผู้เล่นที่มีประสบการณ์
ความน่าเชื่อถือ
สล็อต PG มีมาตรฐานรองรับ มีการ รักษาความปลอดภัย และใช้ระบบสุ่มผล RNG เพื่อให้ผลลัพธ์ ยุติธรรม แพลตฟอร์มที่ให้บริการ pg slot ควรมี ทีมซัพพอร์ต 24 ชม.
สรุป
pg slot เป็นตัวเลือกยอดนิยมสำหรับผู้ที่ต้องการเล่นสล็อตออนไลน์ ด้วยจุดเด่นด้าน กราฟิกคุณภาพ และการทำธุรกรรมที่ ทันใจ ผู้เล่นสามารถเริ่มต้นได้ ง่าย ฝากถอนสะดวก และเลือกเกมได้ หลากหลายแนว เหมาะสำหรับ ทั้งมือใหม่และมือโปร ในโลกของเกมสล็อตออนไลน์
Автозайм
Деньги под залог ПТС в Самаре — представляет собой возможность взять деньги под авто без продажи транспорта и без долгих банковских процедур. Ключевая особенность автозайма — автомобиль остаётся у владельца у владельца, а в залог оформляется лишь ПТС. Это даёт возможность использовать автомобилем, на протяжении договор займа.
Получение денег происходит в день обращения. Обращение проверяется примерно за 15 мин, затем выносится ответ по сумме и условиям оформления. Сумма займа может составлять до 5 000 000 ?, а процентная ставка начинается от 2% в месяц. Срок кредитования как правило достигает до 60 мес., поэтому клиент может подобрать подходящий график выплат.
Система подачи заявки работает через интернет. Заёмщик оставляет форму, вносит данные автомобиля и необходимую сумму займа. После проверки данных выносится предварительное решение. В большинстве случаев деньги переводятся в день оформления, после подписания договор.
Для оценки условий используется онлайн-калькулятор. К примеру, если взять 300 000 ? на период 12 мес. ежемесячный платёж будет около 33 057 ?. Итоговая сумма переплаты по такому займу будет около 96 684 ?. Конечные параметры могут отличаться в зависимости оценки автомобиля и выбранного срока кредитования.
На сайтах автокредитования часто показывается онлайн-лента заявок. Этот блок демонстрирует активность сервиса и образцы обработанных заявок из разных городов. К примеру, заявки на суммы 1 840 000 ? город Тула, 1 890 000 ? город Москва или 1 470 000 ? город Челябинск могут получать статус «Одобрено». Часть заявок могут находиться в стадии проверки — например, 290 000 ? из Сочи или 720 000 ? из Екатеринбурга. Такие блоки отображают текущий поток сервиса и количество обработанных заявок сегодня и за месяц.
Займ с залогом ПТС может подойти тем, кому требуется быстро получить крупную сумму без продажи автомобиля. Основные условия таких займов — процент начиная от 2% в месяц, рассмотрение около 15 минут, сумма до 5 млн ? и вариант оформить заявку через интернет. После подачи заявки клиент может дождаться решения, связаться через мессенджер или обратиться к менеджеру для уточнения деталей оформления.
สล็อต PG สล็อตยอดฮิต เข้าเล่นไว ฝากถอนออโต้
คำค้นหา สล็อต PG กำลังได้รับความนิยมอย่างต่อเนื่อง ในกลุ่มผู้เล่นเกมสล็อตออนไลน์ เพราะเป็น ค่ายเกมที่มีชื่อเสียง ด้าน กราฟิก ความ ลื่นไหล และ โอกาสรับกำไรที่ดี เกมของ PG ออกแบบโดยทีมงานมืออาชีพ ที่รองรับการเล่นทั้งบน สมาร์ทโฟน และ เดสก์ท็อป
ข้อดี ของ สล็อต PG
สล็อต PG เป็นเกมสล็อตออนไลน์ที่ออกแบบมาให้ โหลดเร็ว เล่นผ่าน ระบบเว็บ และรองรับ ทั้ง iOS และ Android ไม่ต้องดาวน์โหลดแอป ผู้เล่นสามารถเข้าเล่นผ่าน หน้าเว็บ ได้ทันที ภาพและเสียงถูกพัฒนาในรูปแบบ 3D ให้ความคมชัด พร้อมเอฟเฟกต์ จัดเต็ม
คุณสมบัติหลักของเกม สล็อต PG ได้แก่
โบนัสและฟรีสปินหลายแบบ
ฟีเจอร์ตัวคูณรางวัล
เดโม่ฟรี
มีเมนูภาษาไทย
ระบบการเงินรวดเร็ว ไม่ต้องรอนาน
แพลตฟอร์ม PG Slot โดยทั่วไปให้บริการ การฝาก-ถอน อัตโนมัติ 24 ชั่วโมง ขั้นต่ำเริ่มต้นเพียง หลักหน่วย ขึ้นอยู่กับ กติกาแต่ละแพลตฟอร์ม การทำรายการใช้เวลา รวดเร็วมาก ผ่าน คิวอาร์โค้ด หรือระบบ Mobile Banking ทำให้ธุรกรรมเป็นไปอย่าง ไม่สะดุด
แนวเกมที่คนเล่นเยอะ ใน PG Slot
เกม สล็อต PG มีธีมหลากหลาย เช่น
ธีม แฟนตาซี
ธีม Adventure
ธีม เอเชียและโชคลาภ
ธีม ธรรมชาติ
หลายคนชอบเกมที่โบนัสเข้าไว พร้อมระบบ Special Feature และ ระบบจ่ายคุ้มค่า เหมาะกับทั้ง ผู้เล่นเริ่มต้น และ สายสล็อตจริงจัง
ความปลอดภัย
pg slot พัฒนาในระบบสากล มีการ ปกป้องข้อมูลผู้เล่น และใช้ระบบสุ่มผล RNG เพื่อให้ผลลัพธ์ ยุติธรรม แพลตฟอร์มที่ให้บริการ PG Slot ควรมี ความปลอดภัยสูง
โดยภาพรวม
pg slot เป็นตัวเลือกยอดนิยมสำหรับผู้ที่ต้องการเล่นสล็อตออนไลน์ ด้วยจุดเด่นด้าน ระบบลื่นไหล และการทำธุรกรรมที่ ทันใจ ผู้เล่นสามารถเริ่มต้นได้ ง่าย ฝากถอนสะดวก และเลือกเกมได้ ครบทุกหมวด เหมาะสำหรับ ทุกระดับประสบการณ์ ในโลกของเกมสล็อตออนไลน์
https://medium.com/@ratypw/ทดลองเล่นสล็อต-pg-70cdb1132344
ทดลองเล่นสล็อต pg ฟรี pg slot แพลตฟอร์มเกมสล็อตยอดนิยม เข้าเล่นไว ฝากถอนออโต้
คำค้นหา pg slot กำลังได้รับความนิยมอย่างต่อเนื่อง ในกลุ่มผู้เล่นเกมสล็อตออนไลน์ เพราะเป็น แบรนด์เกมที่โดดเด่น ด้าน กราฟิก ความ ลื่นไหล และ ระบบจ่ายที่ดึงดูด เกมของ PG ออกแบบโดยทีมงานมืออาชีพ ที่รองรับการเล่นทั้งบน สมาร์ทโฟน และ พีซี
ข้อดี ของ PG Slot
สล็อต PG เป็นเกมสล็อตออนไลน์ที่ออกแบบมาให้ เปิดเกมได้ทันที เล่นผ่าน ระบบเว็บ และรองรับ ทุกอุปกรณ์ เข้าเล่นผ่านเว็บได้เลย ผู้เล่นสามารถเข้าเล่นผ่าน หน้าเว็บ ได้ทันที ภาพและเสียงถูกพัฒนาในรูปแบบ 3D ให้ความคมชัด พร้อมเอฟเฟกต์ สวยงาม
คุณสมบัติหลักของเกม สล็อต PG ได้แก่
มีรอบโบนัสให้ลุ้นบ่อย
Multiplier
โหมดทดลองเล่นฟรี
มีเมนูภาษาไทย
ระบบการเงินรวดเร็ว ทันใจ
แพลตฟอร์ม สล็อต PG ส่วนใหญ่รองรับ การฝาก-ถอน ฝากถอนตลอดเวลา ขั้นต่ำเริ่มต้นเพียง หลักหน่วย ขึ้นอยู่กับ เงื่อนไขของเว็บไซต์ การทำรายการใช้เวลา เพียงไม่กี่วินาที ผ่าน QR Code หรือระบบ ธนาคารบนมือถือ ทำให้ธุรกรรมเป็นไปอย่าง ลื่นไหล
แนวเกมที่คนเล่นเยอะ ใน pg slot
เกม pg slot มีธีมหลากหลาย เช่น
ธีม แฟนตาซี
ธีม Adventure
ธีม ความมั่งคั่ง
ธีม ธรรมชาติ
ผู้เล่นนิยมเกมที่มีรอบพิเศษบ่อย พร้อมระบบ Special Feature และ อัตราการจ่ายที่สูง เหมาะกับทั้ง มือใหม่ และ ผู้เล่นที่มีประสบการณ์
ความน่าเชื่อถือ
pg slot ใช้ระบบที่ได้มาตรฐาน มีการ ปกป้องข้อมูลผู้เล่น และใช้ระบบสุ่มผล Random Number Generator เพื่อให้ผลลัพธ์ โปร่งใส แพลตฟอร์มที่ให้บริการ pg slot ควรมี ระบบดูแลข้อมูล
สรุป
สล็อต PG เป็นตัวเลือกยอดนิยมสำหรับผู้ที่ต้องการเล่นสล็อตออนไลน์ ด้วยจุดเด่นด้าน กราฟิกคุณภาพ และการทำธุรกรรมที่ ไว ผู้เล่นสามารถเริ่มต้นได้ ทันที ฝากถอนสะดวก และเลือกเกมได้ จำนวนมาก เหมาะสำหรับ ผู้เล่นทุกสไตล์ ในโลกของเกมสล็อตออนไลน์
rufus Rufus is known as a lightweight, no-cost, open-source utility created to create bootable USB drives. It helps users prepare a USB flash drive that can set up an operating system, launch diagnostic tools, or boot into a recovery environment. The program does not require installation and can be launched as soon as it is downloaded.
The main function of Rufus is to create bootable USB media from ISO images with speed and stability. This lets people install or run operating systems directly from a USB flash drive without the need for DVDs. The tool works with a wide range of operating systems and service utilities, which makes it useful for both regular users and system administrators.
Rufus runs on computers with Microsoft Windows, starting from Windows 7. Both 32-bit and 64-bit versions are supported, and there is also a version available for ARM64 architecture.
The software lets users create bootable USB drives from many different ISO images. It can be used to prepare a USB drive for installing Windows 11, Windows 10, Windows 8.1, or Windows 7, as well as various Linux distributions. Rufus also works with DOS systems and other recovery or maintenance tools commonly used for troubleshooting computers.
One of the integrated features of Rufus is the ability to download official Windows ISO images directly from Microsoft servers. This allows users to obtain original installation images for Windows 8.1, Windows 10, and Windows 11 without searching for them on third-party websites.
In addition to creating bootable drives, Rufus can format USB devices. It supports several file systems including FAT32, NTFS, exFAT, UDF, and ReFS. This flexibility allows the USB drive to be prepared for different use cases and compatibility requirements.
Rufus supports both legacy BIOS systems and modern UEFI environments. Because of this, bootable drives created with Rufus can work on older computers as well as newer systems that use UEFI and Secure Boot.
Another feature included in Rufus is Windows To Go support. This option allows users to run a full Windows environment directly from a USB drive. It can be useful for testing systems, performing maintenance, or working on multiple computers without installing Windows on the internal drive.
Rufus also provides the option to bypass certain Windows 11 installation requirements. When creating an installation USB, the program can disable checks for TPM 2.0, Secure Boot, and minimum RAM requirements. This makes it possible to install Windows 11 on computers that would otherwise not meet the official hardware requirements.
One of the reasons Rufus has become popular is its speed and simplicity. The program is extremely small, about 1.9 MB in size, and runs as a portable application without installation. It is distributed under the GPL v3 open-source license, supports more than 70 languages, and contains no advertisements, bundled software, or tracking components.
Rufus works with a large number of ISO images. These include multiple versions of Windows, Windows Server editions, FreeDOS, and various system tools such as GParted, Hiren’s Boot CD, Parted Magic, and Clonezilla. Because of this wide compatibility, the program can be used not only for installing operating systems but also for disk management, data recovery, and system maintenance tasks.
To use Rufus, a computer running Windows 7 or later and a USB flash drive are required. The program does not need to be installed. Users simply download the executable file, run it, select the ISO image they want to use, and create a bootable USB drive. Due to its simplicity, speed, and reliability, Rufus remains one of the most widely used tools for creating bootable USB drives.
ทดลองเล่นสล็อต pg เว็บ ตรง”
PG Slot สล็อตยอดฮิต เข้าเล่นไว ฝากถอนออโต้
คำค้นหา สล็อต PG มาแรงในช่วงนี้ ในกลุ่มผู้เล่นเกมสล็อตออนไลน์ เพราะเป็น ค่ายเกมที่มีชื่อเสียง ด้าน งานภาพคุณภาพสูง ความ นิ่งไม่สะดุด และ อัตราการจ่ายรางวัลที่น่าสนใจ เกมของ PG พัฒนาโดยผู้ให้บริการชั้นนำ ที่รองรับการเล่นทั้งบน โทรศัพท์มือถือ และ คอมพิวเตอร์
จุดเด่น ของ pg slot
สล็อต PG เป็นเกมสล็อตออนไลน์ที่ออกแบบมาให้ เข้าเกมไว เล่นผ่าน ระบบเว็บ และรองรับ ทั้ง iOS และ Android เข้าเล่นผ่านเว็บได้เลย ผู้เล่นสามารถเข้าเล่นผ่าน เว็บเบราว์เซอร์ ได้ทันที ภาพและเสียงถูกพัฒนาในรูปแบบ สามมิติ ให้ความคมชัด พร้อมเอฟเฟกต์ สมจริง
คุณสมบัติหลักของเกม สล็อต PG ได้แก่
มีรอบโบนัสให้ลุ้นบ่อย
Multiplier
เล่นฟรีก่อนเติมเงิน
มีเมนูภาษาไทย
ระบบฝากถอนสะดวก ทำรายการไว
แพลตฟอร์ม สล็อต PG มักมี การฝาก-ถอน ฝากถอนตลอดเวลา ขั้นต่ำเริ่มต้นเพียง 1 บาท ขึ้นอยู่กับ ระบบของผู้ให้บริการ การทำรายการใช้เวลา เพียงไม่กี่วินาที ผ่าน สแกน QR หรือระบบ แอปธนาคาร ทำให้ธุรกรรมเป็นไปอย่าง ไม่สะดุด
ประเภทเกมยอดนิยม ใน PG Slot
เกม สล็อต PG มีธีมหลากหลาย เช่น
ธีม เทพเจ้าและแฟนตาซี
ธีม Adventure
ธีม เอเชียและโชคลาภ
ธีม Animal
หลายคนชอบเกมที่โบนัสเข้าไว พร้อมระบบ โบนัสรอบพิเศษ และ โอกาสทำกำไรสูง เหมาะกับทั้ง ผู้เล่นเริ่มต้น และ ผู้เล่นมือโปร
ความปลอดภัย
pg slot มีมาตรฐานรองรับ มีการ เข้ารหัสข้อมูล และใช้ระบบสุ่มผล Random Number Generator เพื่อให้ผลลัพธ์ ตรวจสอบได้ แพลตฟอร์มที่ให้บริการ PG Slot ควรมี ทีมซัพพอร์ต 24 ชม.
สรุป
PG Slot เป็นตัวเลือกยอดนิยมสำหรับผู้ที่ต้องการเล่นสล็อตออนไลน์ ด้วยจุดเด่นด้าน กราฟิกคุณภาพ และการทำธุรกรรมที่ ทันใจ ผู้เล่นสามารถเริ่มต้นได้ ง่าย ฝากถอนสะดวก และเลือกเกมได้ ครบทุกหมวด เหมาะสำหรับ ทั้งมือใหม่และมือโปร ในโลกของเกมสล็อตออนไลน์
ทดลองเล่นสล็อต pg ไม่ เด้ง
ทดลองเล่นสล็อต pg ไม่ เด้ง
bidik88
мелбет скачать на телефон
Скачать Melbet: Android, iOS и ПК
Мобильная версия Melbet включает букмекерскую контору и казино в едином приложении. Доступны live-ставки, слоты, прямые трансляции, статистика и быстрые финансовые операции. Установка занимает 1–2 минуты.
Android (APK)
Скачайте APK с официального источника, откройте файл и подтвердите установку. Если требуется включите доступ к установке сторонних приложений, затем войдите в аккаунт.
iOS (iPhone)
Откройте App Store, введите в поиске «Melbet», нажмите «Получить», после установки авторизуйтесь в системе.
ПК
Перейдите официальный сайт, войдите в личный кабинет и добавьте ярлык на рабочий стол. Веб-версия работает как полноценное приложение.
Функционал
Live-ставки с обновлением коэффициентов, игровой раздел с тысячами игр, просмотр матчей, подробная статистика, уведомления о матчах, быстрая регистрация и поддержка 24/7.
Бонусы
После установки доступны бонус на первый депозит, промокоды и бесплатные ставки. Условия зависят от региона.
Безопасность
Скачивайте только с официальных источников, контролируйте адрес сайта, не сообщайте данные доступа третьим лицам и включите 2FA.
Установка занимает несколько минут, после чего открывается полный доступ Melbet.
yo dude seriously check out heaps of wins my buddy showed me this thing last week and its actually insane, like the whole vibe is just different man no cap
http://xn--tstz66j3id.xn--cksr0a.life/home.php?mod=space&uid=1787&do=profile&from=space
леонбетс казино зеркало рабочее
joycasino официальный сайт
Been using 777bet for a couple weeks now and the interface is really smooth, though the withdrawal times could be a bit faster tbh.
рейтинг казино на реальные деньги
Not my first rodeo with these sites and ipl live 2026 is actually one of the better ones. YMMV but thats my experience.
sapporo88 login
has anyone here tried play rummy free against computer yet cuz im looking for something new and alot of ppl keep saying its pretty good. does anyone reccomend it or is it teh same as everything else out there rn. would b nice to hear sum real opinions on this one
sapporo88
… [Trackback]
[…] Info on that Topic: coinchapter.com/solana-sol-crash-after-weekend-rally/ […]