
PATNA (CoinChapter.com) — Blockchain-focused indexing protocol, The Graph (GRT), has been growing by leaps and bounds in 2023. As a result, GRT price spiked to a daily high of $0.211 on Feb 8, bringing the token’s YTD gains to a staggering 283%.

Strong fundamentals helped guide the Graph’s bullrun in 2023. GRT price rally pushed the Graph’s market cap above $1 billion for the first time since Aug 2022.
Moreover, in its report on The Graph protocol, Messari noted that active subgraphs on The Graph’s mainnet had risen steadily since 2021. In Q4 2022, 618 subgraphs migrated from The Graph’s hosted service to its mainnet, marking a 151% increase YoY for the metric.
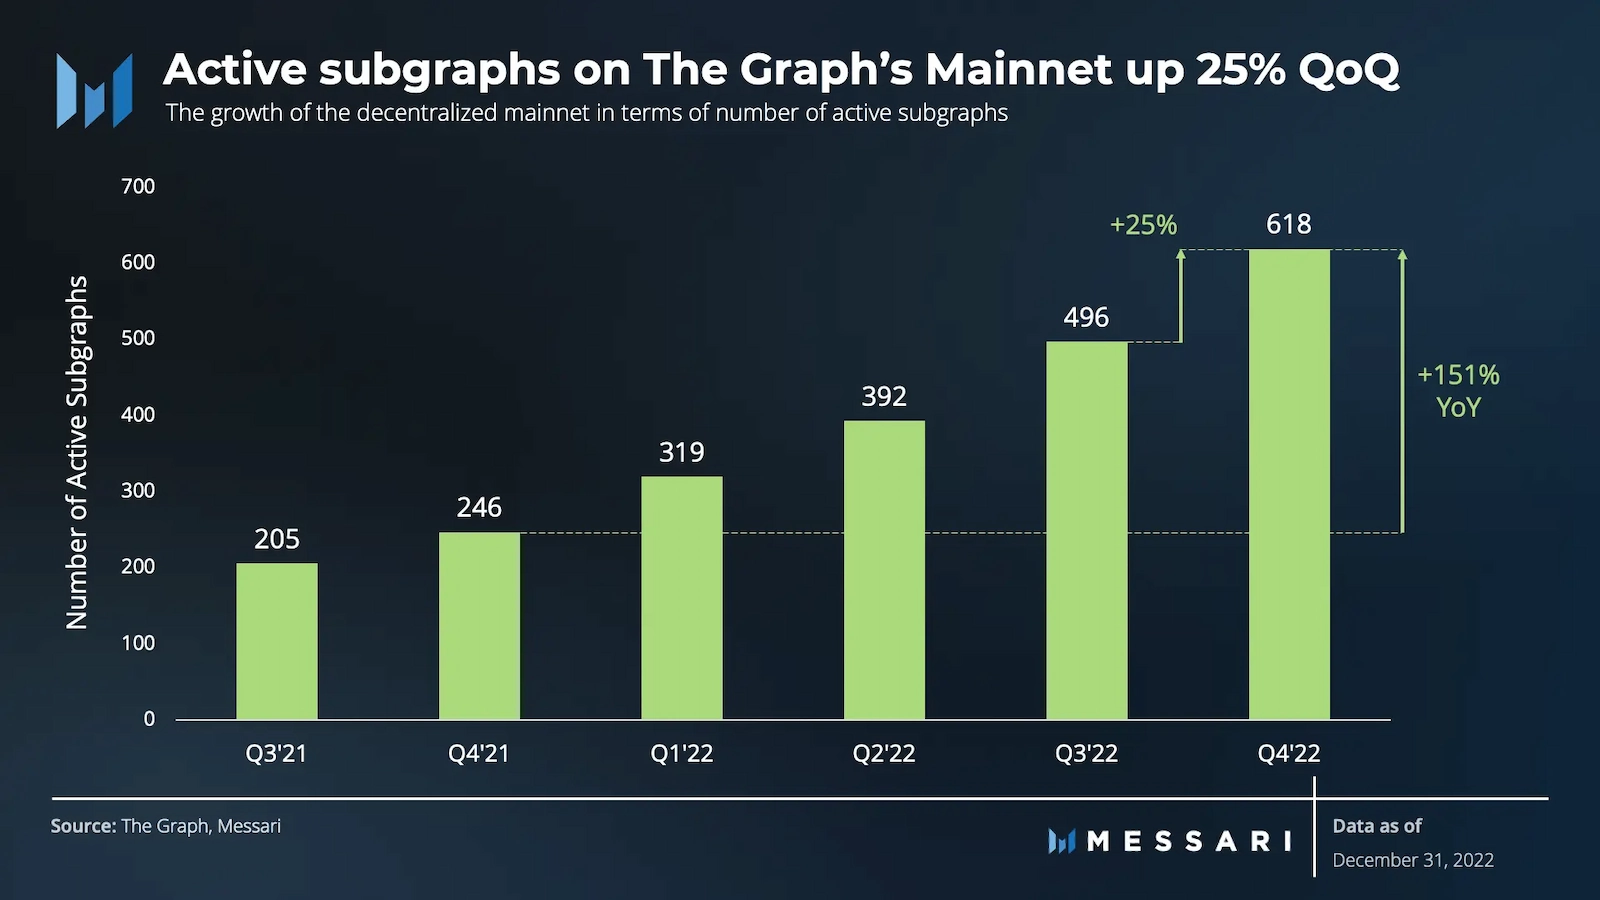
In detail, subgraphs extract data from a blockchain to process and store it, making it easily accessible through queries via the GraphQL interface. Graph’s ecosystem of active indexers, delegators, and curators also grew in Q4 2022.
Also Read: Joe Biden Reminds China Of US’s Military Mightiness After Talks SnubbedMoreover, GRT revenue from query fees rose by nearly 6,200% YoY or a 265% increase in the US dollar terms.
On Feb 7, Messari announced that it built a subgraph to index Aave V3 data on The Graph network. Yaniv Tal, the co-founder of the Graph protocol, said in a podcast that he aims to make The Graph a public utility, with “all the world’s public knowledge and information at your fingertips.“
GRT Price Rally Stutters
GRT price rallied 178% in the first week of Feb to form a daily high of $0.232 on Feb 7. However, The Graph token price rally stuttered on Feb 8 as it fell more than 14% to reach a low of $0.181.
The downside movement likely resulted from profit booking after GRT price painted its highest single-day gains since Dec 2020 on Feb 7. However, bulls haven’t left the market, as the long lower wick on Feb 8’s daily candle indicates.
Attracting more buyers to the market is the bullish pattern formed when the GRT token’s 20-day EMA (red wave) trendline moved above its 200-day EMA (green wave) to form a golden cross. Traders consider the pattern an indicator of positive market sentiment and a buy signal.

Should GRT buyers enter the market, The Graph token price might rise to reclaim resistance near $0.2. Breaking and consolidating above immediate resistance could help GRT price target resistance near $0.24 before retreating.
Also Read: Why Stocks, Bitcoin Rally Could Stall After Powell RemarksThe Graph’s overbought relative index, currently at 76.38 after a sharp correction on Feb 8, might hinder the upside movement of GRT price. Overbought RSI levels have traditionally been a sell signal for traders, as they often precede a bearish trend reversal.
Hence, GRT price could face a drop to test support near $0.175. Moreover, breaching immediate support might result in the GRT token price falling to support near $0.148 before recovering.
Frequently Asked Questions (FAQ)
The Graph is an indexing protocol that provides users with on-chain data from many sources. It can be thought of as Google for on-chain data.

… [Trackback]
[…] There you can find 63324 more Info to that Topic: coinchapter.com/the-graph-grt-price-rockets/ […]
… [Trackback]
[…] There you will find 14160 more Information on that Topic: coinchapter.com/the-graph-grt-price-rockets/ […]
… [Trackback]
[…] Find More on to that Topic: coinchapter.com/the-graph-grt-price-rockets/ […]
… [Trackback]
[…] There you can find 41472 more Info to that Topic: coinchapter.com/the-graph-grt-price-rockets/ […]
… [Trackback]
[…] There you can find 65372 additional Information on that Topic: coinchapter.com/the-graph-grt-price-rockets/ […]
… [Trackback]
[…] Read More Info here on that Topic: coinchapter.com/the-graph-grt-price-rockets/ […]