
NEW DELHI (CoinChapter.com) — DeFi-based automated market maker (AMM) platform PancakeSwap’s native token CAKE prices jumped 30% to go from Apr 12’s low of $7.55 to reach an intraday high of $9.8 on Apr 21.
As a result of the uptrend, PancakeSwap prices moved above $10 for the first time since Apr 5.
However, the long upper wick on Thursday’s daily candle suggests that bears have moved in to book profits off the CAKE token’s recent rally. In addition, CAKE prices bounced off the token’s 50-day exponential moving average (yellow wave) on Apr 18, indicating traders are buying the dip near the level.
If the CAKE token price fails to maintain its uptrend, the token could fall to support near 100-day EMA (purple wave) near $8.85. Further downtrend could push CAKE price down to support near $8.25, a price level that previously acted as resistance for the token between Jan 23 and Feb1 7.

Finally, a marketwide sell-off could push PancakeSwap to test resistance near $7.5, which the CAKE token last tested on Apr 11.
Also Read: 0x (ZRX) token jumps more than 50% intraday on news of Coinbase partnership.The relative strength index remains neutral for the CAKE token, with a value of 60.73 on the daily charts. The RSI trendline is currently moving horizontally, indicating there is still room for CAKE to move upwards.
CAKE Charts Bullish MACD Pattern
Trend-based momentum indicator MACD charted a bullish crossover for the CAKE token on Apr 21.
In detail, a bullish crossover occurs when the MACD line (difference of 12-day and 26-day EMA) moves above the MACD signal line (9-day EMA of MACD). As a result, traders usually consider the chart pattern as a buy signal, helping boost the asset’s prices.
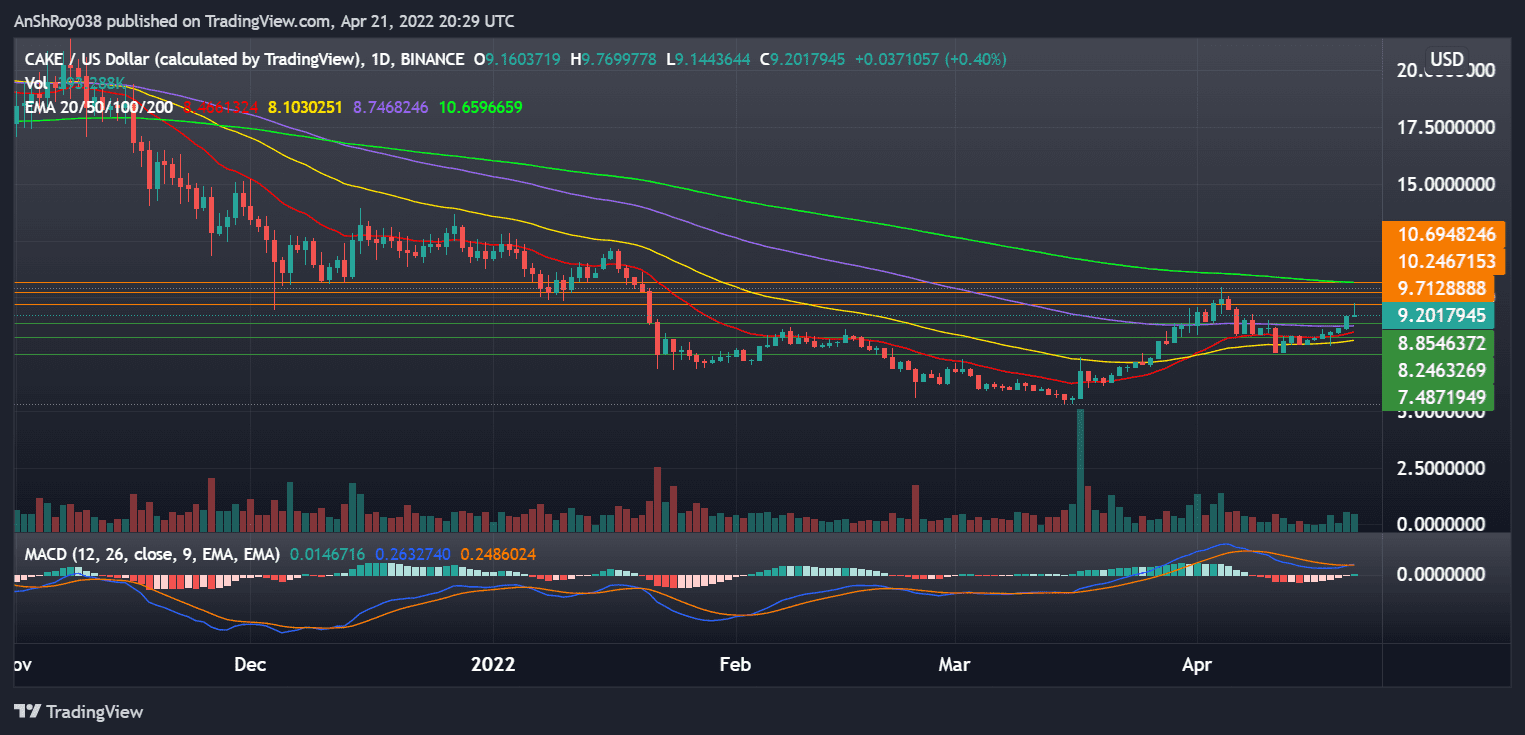
Traders could take cues from the bullish pattern to start an uptrend. As such, CAKE prices could flip immediate resistance near $9.7. Furthermore, a sustained uptrend could see PancakeSwap target resistance near $10.2.
Also Read: COTI turns bullish on the back of MultiDAG 2.0 and Djed stablecoin launch.Finally, the CAKE token price might rise to challenge resistance near $10.7 before prices pull back. The $10.7 previously supported PancakeSwap price action between Dec 5, 2021, and Jan 6, 2022.
At the time of writing, CAKE was trading at $8.96, down 2.23% on the day.

… [Trackback]
[…] Read More Info here to that Topic: coinchapter.com/pancakeswap-cake-prices-jump-nearly-30-in-ten-days/ […]
… [Trackback]
[…] Info on that Topic: coinchapter.com/pancakeswap-cake-prices-jump-nearly-30-in-ten-days/ […]