
NOIDA (CoinChapter.com)—Toncoin has become one of the top gainers of 2024 among the top 20 crypto tokens by market cap. TON prices went from $2 in Jan. 2024 to a daily high near $8.1 on July 2, a spike of 310%.
Moreover, the Toncoin price is just a hair’s breadth away from its recent all-time high of $8.24, which the token set two weeks ago.
Chart Analysis and Bullish Indicators
Wallets holding between 100 and 1,000 TON have seen a substantial increase, indicating a surge in retail investor interest. This shift from large holders, who have reduced their positions, to smaller investors suggests a democratization of TON ownership.
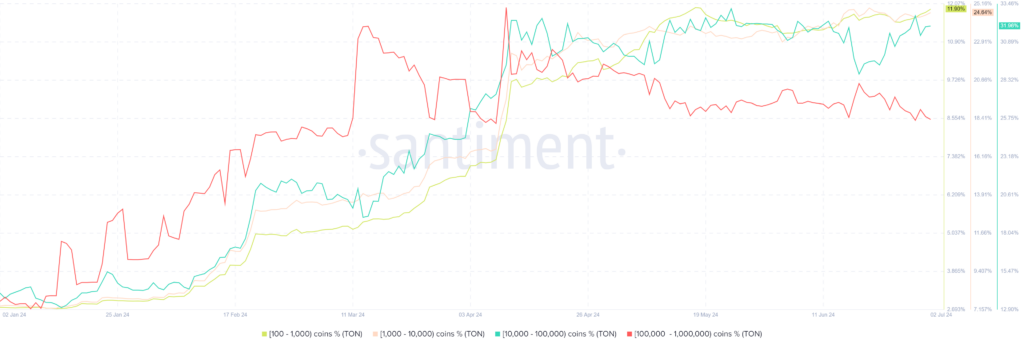
Retail accumulation often signals confidence and broader market participation, which are positive indicators for future growth.
Recent developments have likely influenced the token distribution. The Astana Financial Services Authority (AFSA) in Kazakhstan approved the token for trading on local exchanges following Telegram co-founder Pavel Durov’s visit to the country.
The approval in Kazakhstan comes after an audit confirmed that Toncoin meets the financial regulator’s stringent listing criteria. With this, Toncoin joins an elite group of 107 digital assets approved by Kazakhstan, which includes prominent names like Bitcoin, Ethereum, Polygon, and Avalanche.
Toncoin’s market position has also strengthened. Previously ranked 9th on CoinMarketCap, TON overtook Dogecoin, reaching 8th place with a market cap of $19.75 billion, surpassing Dogecoin’s $17.94 billion.
Institutional interest has further bolstered Toncoin’s prospects. Pantera Capital’s increased investment in Toncoin has driven demand, with the ongoing investment round inviting participants with a minimum stake of $250,000.
Toncoin Price Faces Bearish Pattern Risk
The recent Toncoin price rally is likely to attract profit-booking bears. However, a downtrend here risks TON price breaking out below a bearish technical setup called the ‘Rising Wedge.’
The rising wedge pattern signals a potential reversal in the current trend. Identified by two upward-sloping lines converging towards each other, the resistance line ascends at a gentler slope than the support line.
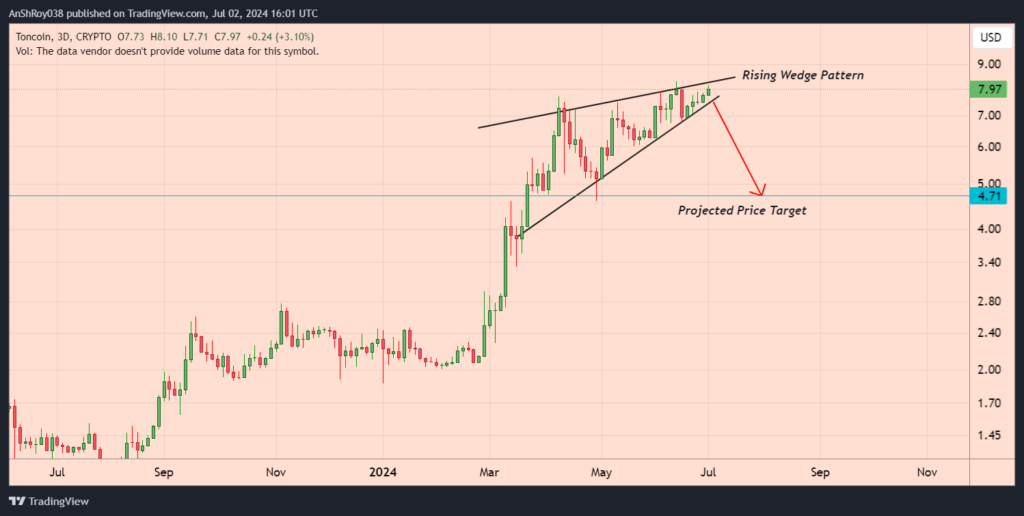
This pattern forms during an upward trend with a series of higher highs and higher lows, indicating reduced buying momentum. As the wedge progresses, the distance between the resistance and support lines decreases, showing weakening momentum.
Typically, the rising wedge leads to a downward breakout. The price breaks below the support line, often with increased trading volume, signaling strong selling pressure.
Traders calculate the price target for the pattern by measuring the vertical distance between the initial high and low points of the wedge and subtracting this from the breakout point.
Per the rules of technical analysis, if the Toncoin price breaks below the bearish pattern, the token might fall to the theoretical price target near $4.7, a drop of over 41% from current levels.

