

YEREVAN (CoinChapter.com) – The Binance coin BNB price stood at $242 on Dec 19, after a 20% month-to-date decline. However, the digital asset could see more pain in the upcoming sessions, as it failed to hold the $254 support level on Dec 16, retesting it as resistance on Dec 18-19.
The said support/resistance line has been relevant since March 2021. But considering several bearish technicals, a further 15% drop to nearly $200 is likely.
BNB bearish charts spell trouble
The BNB/USD daily chart below flashed warning signs for the momentum oscillator named Moving Average Convergence Divergence (MACD; histogram at the bottom). The latter has been printing red bars for over a week with no intention of reversing its trend. Additionally, the digital asset traded below four significant exponential moving averages: 20, 50, 100, and 200-day EMAs.
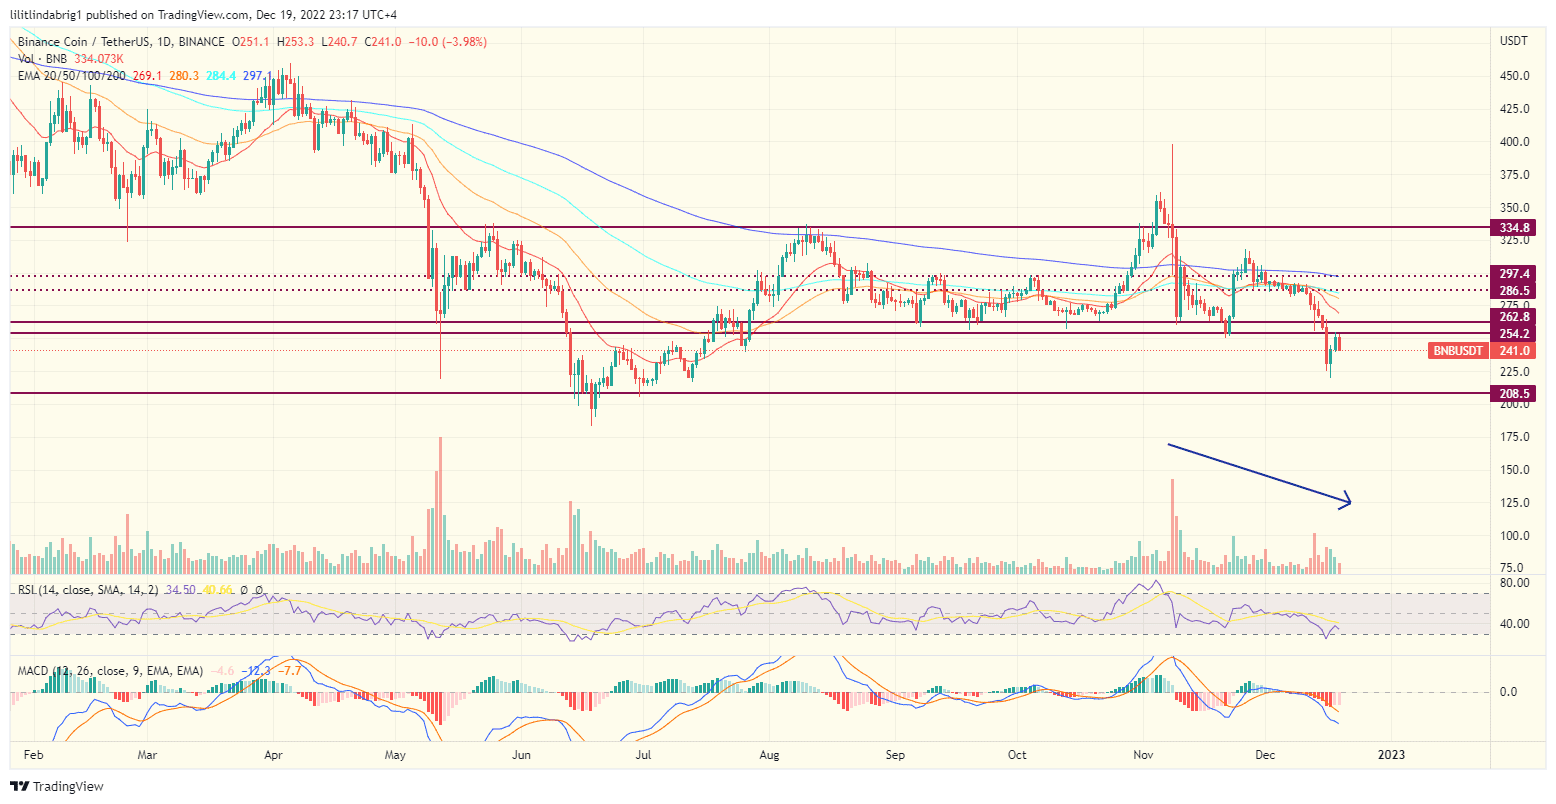
The trading volumes on the chart above have also declined since November, indicating a growing passivity among potential investors. Based on the traders’ slower pace, a bearish scenario appears likely, pinning a target price for BNB close to the next solid support at $208-218.
Also read: Binance FUD Continues With “Eye-Popping” Withdrawals — CZ Not Worried
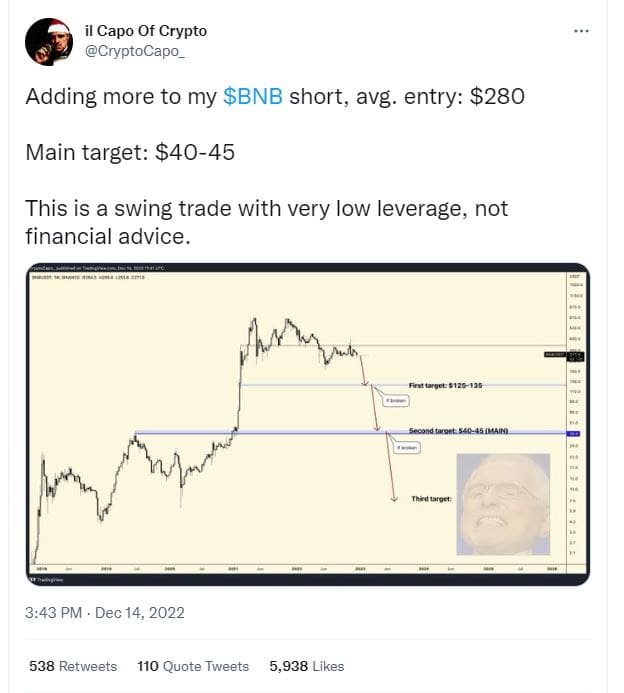
Analyst agrees on a bearish outlook.
Crypto analyst with the Twitter handle @CryptoCapo_ reiterated his short position on BNB, pinning the main target as low as $45-50. The analyst also indicated an intermediary target of $125-130 if BNB is not able to hold the support at the lower $200s.
Also read: Binance.US to acquire bankrupt Voyager, while its ties to parent exchange raise more FUD.
Notably, since the FUD around Binance and its possible insolvency started on Dec 12, the BNB token dove against Bitcoin as well. The chart below demonstrates a sharp decline in the BNB/BTC exchange rate and a death cross between the EMA-20 and the EMA-50 (red and orange waves, respectively).
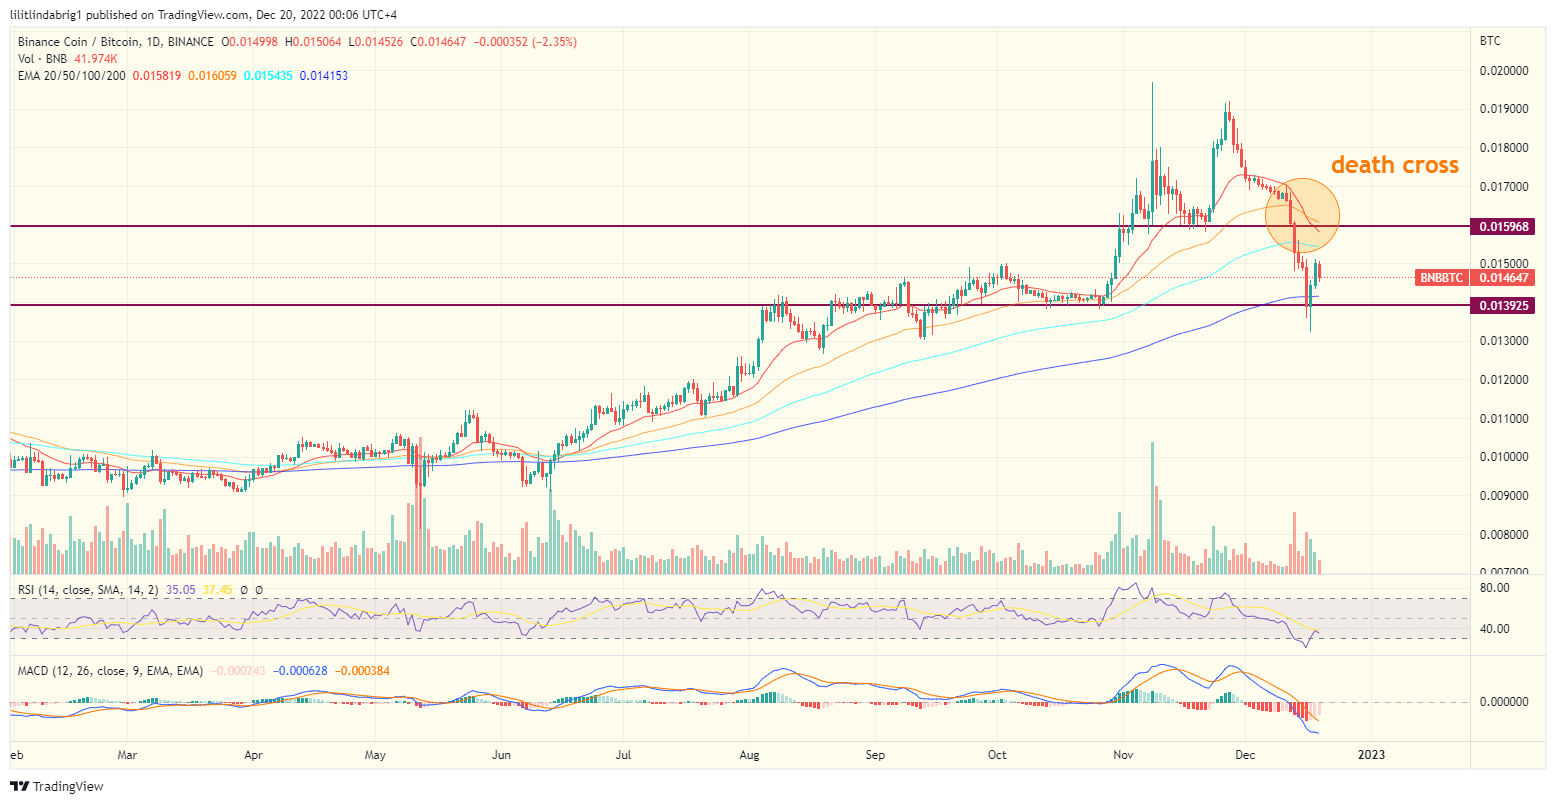
A death cross occurs when a short-term moving average crosses below a long-term one. Such a crossover signifies a bearish phase ahead — for as long as the long-term MA’s dominance over the long-term wave stands.
Click here to keep up with the ever-changing crypto market and never miss the scoop!

… [Trackback]
[…] Read More Info here on that Topic: coinchapter.com/what-is-wrong-with-bnb-price-these-days/ […]