 price up today?")
Key Takeaways:
- Stellar Foundation teased a mysterious upcoming update in an X post.
- XLM price rallied over 13% since Sept 2.
- The Stellar Lumens token is moving inside a bullish pattern.
NEW DELHI (CoinChapter.com) — Stellar’s native token Lumen’s (XLM) price has formed a bullish technical pattern called the ‘Falling Wedge.‘
In detail, the technical pattern forms when the price fluctuates inside a pair of falling trendlines that converge down the slope. The outcome of such downside patterns is typically a price breakout to the upside.
One key feature of the pattern is that volumes usually decline as the trendlines converge.
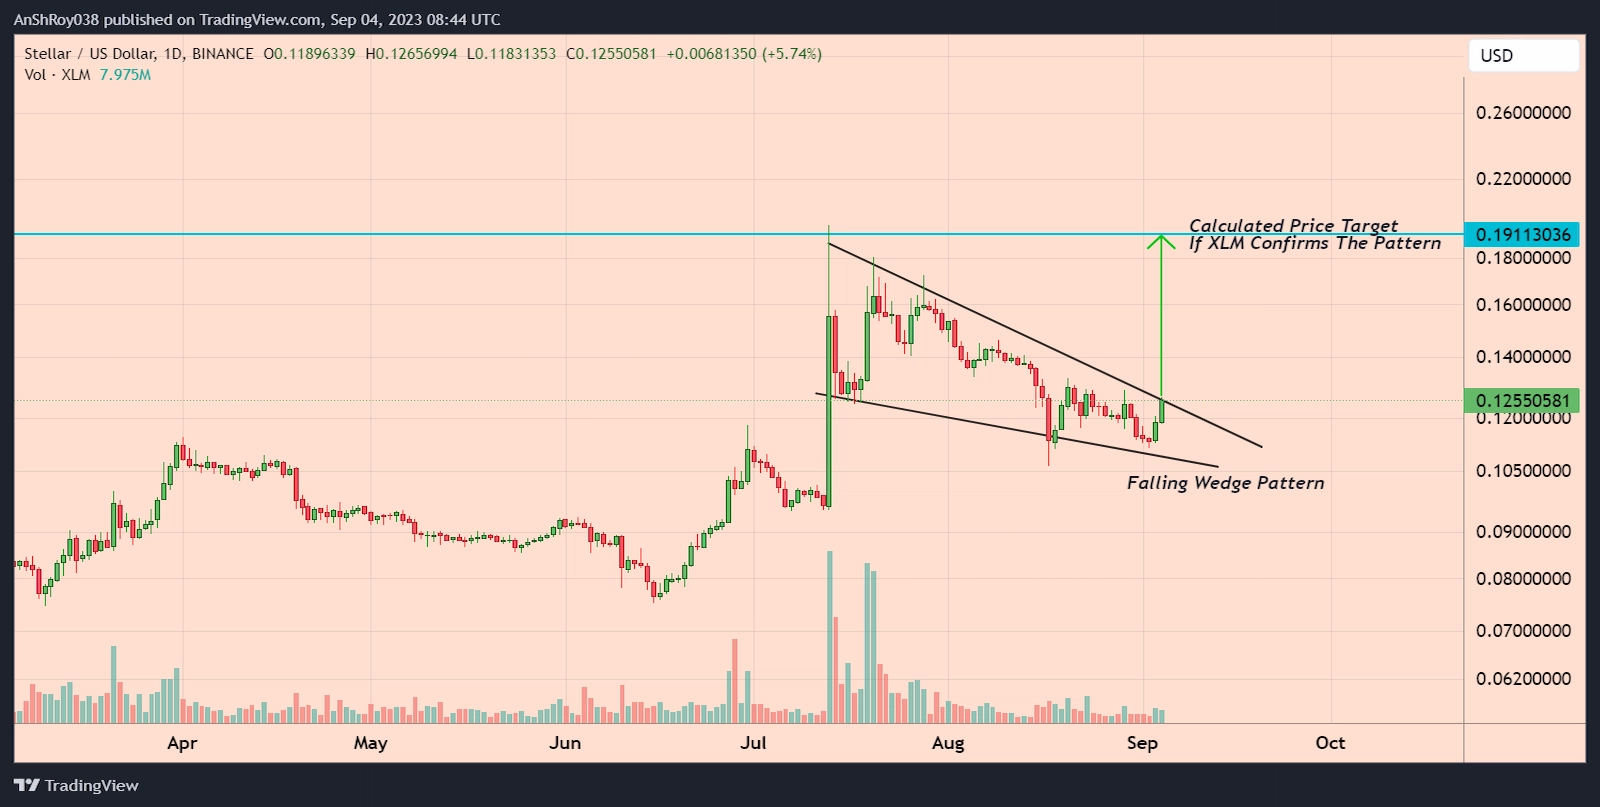
The upside target for the breakout is equal to the maximum distance between the falling wedge’s upper and lower trendlines. Per the rules of technical analysis, theoretically, if the wedge pans out, the Stellar token might rally nearly 52.3% to reach $0.191.
XLM Price Working To Break Above Falling Wedge Resistance
Meanwhile, XLM price rallied over 13.6% since Sept 2, starting the new week on Sept 4 with a 6.8% spike to form a daily high near $0.126. However, the falling wedge’s resistance has capped the token’s rally.
Furthermore, the 50-day EMA (purple wave) acts as a dynamic resistance for the Stellar token price. In addition, XLM price flipped the June-Aug ascending trendline support into a resistance on Aug 30.
The ascending trendline has formed a resistance confluence with the wedge resistance and the 50-day EMA. XLM price must break above the confluence resistance to confirm the pattern. Confirming the bullish wedge might help the Stellar token rise to the resistance near $0.135.
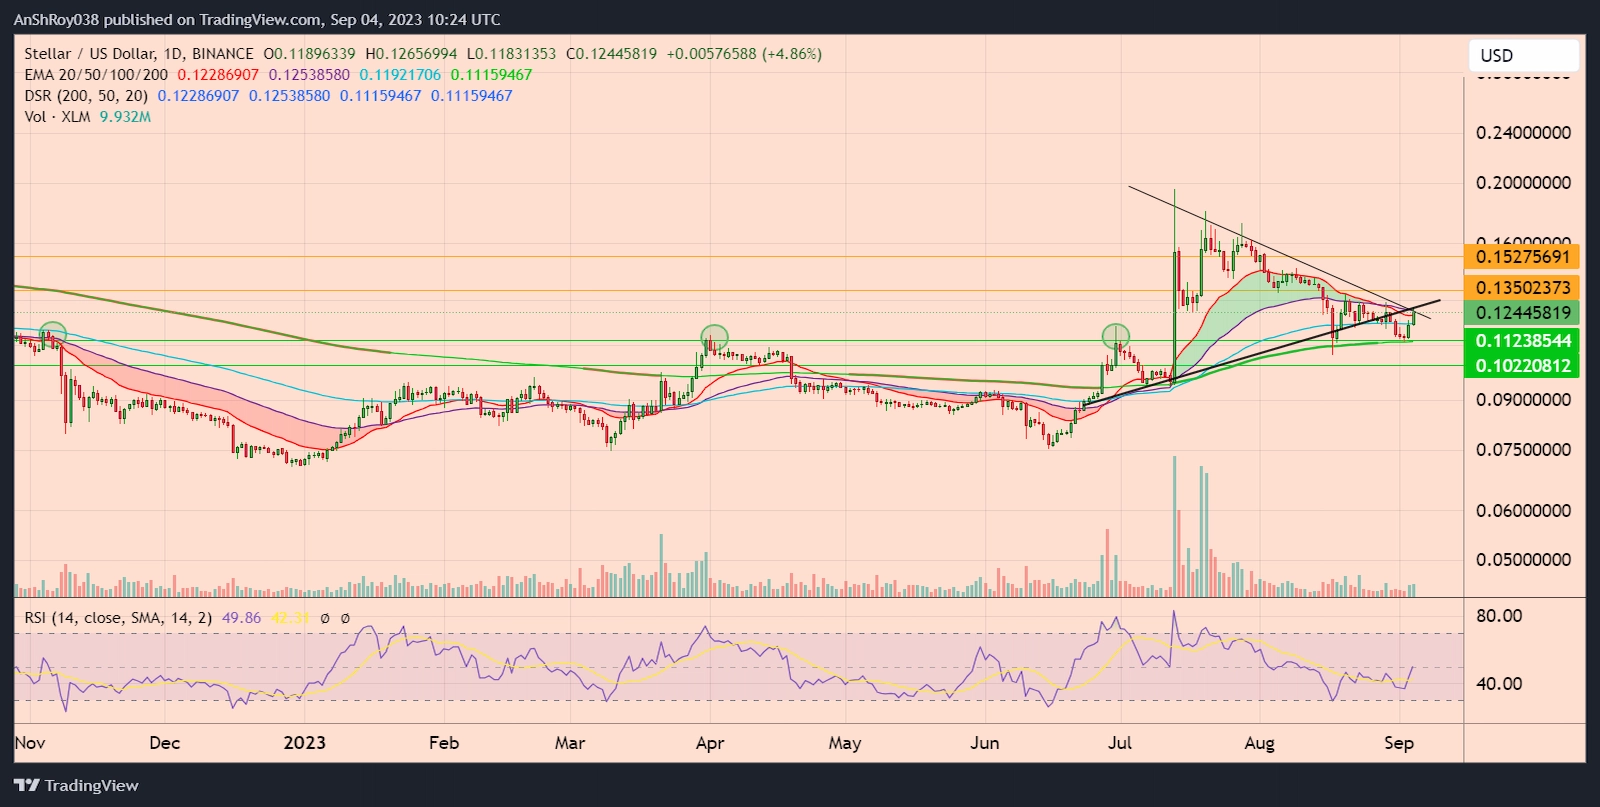
Moreover, breaking and consolidating above the resistance could help XLM price target the resistance near $0.153 before corrections pare gains.
Conversely, if the wedge’s resistance rebuffs XLM price’s uptrend, the Stellar token might drop to the 200-day EMA (green wave) support near $0.112. The EMA support previously acted as a resistance against the token, rebuffing XLM price’s uptrend thrice since Nov 2022 (green circles).
Hence, falling below the immediate support could force XLM price to test the support near $0.1.
The RSI for XLM remained neutral, with a score of 49.86 on the daily charts.
Stellar Teases Upcoming ‘Cool‘ Update
A likely reason behind XLM price’s recent rally might be a cryptic Sept 2 announcement from the Stellar Foundation about “something cool” happening in 10 days.
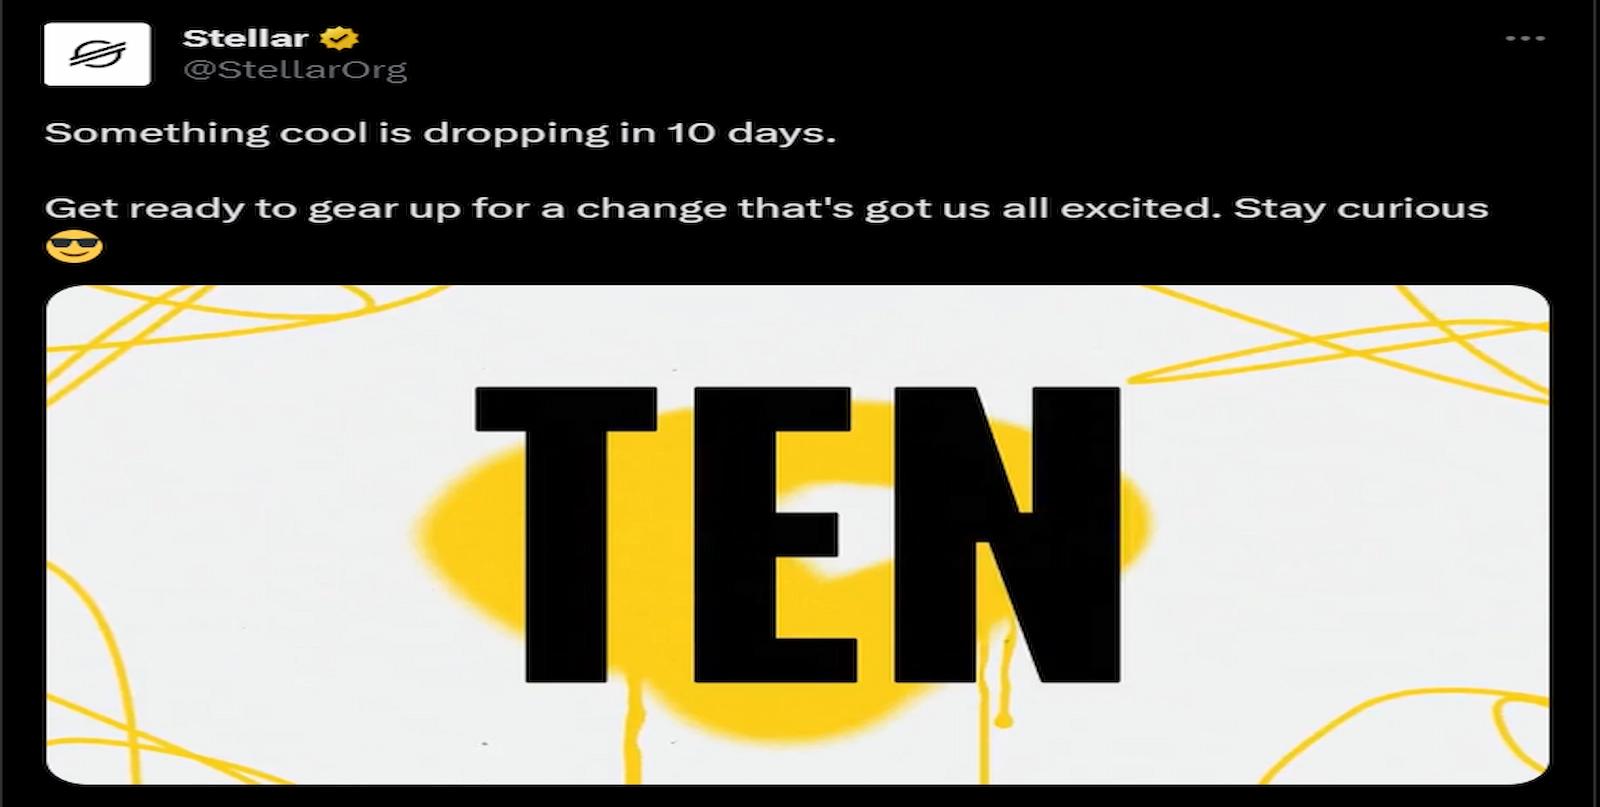
It remains unclear how the upcoming announcement would impact the XLM token. However, news of an update seemingly attracted buyers to the market, propelling XLM prices higher.
Another possible reason propelling XLM price could be the upcoming Meridian event, Stellar’s flagship annual event. Meridian would feature several prominent speakers, including Idris Elba, Teana Baker-Taylor of Circle, and Summer Mersinger, CFTC commissioner.
Traders Remain Bullish On XLM Price
The token’s recent uptrend resulted in several traders turning bullish on XLM’s prospects.
Furthermore, on-chain data provider Santiment noted that the Stellar token might be primed for a mini breakout. Santiment noted that the social volume for the XLM token spiked as the week began.
Traders have often shorted the XLM token, but the recent rally might liquidate the short positions. As a result, more buyers might enter the market, adding to the bullish cues for XLM price.

… [Trackback]
[…] Info on that Topic: coinchapter.com/why-is-stellar-xlm-price-up-today/ […]
… [Trackback]
[…] Find More Info here to that Topic: coinchapter.com/why-is-stellar-xlm-price-up-today/ […]
… [Trackback]
[…] Find More to that Topic: coinchapter.com/why-is-stellar-xlm-price-up-today/ […]
… [Trackback]
[…] Find More Info here on that Topic: coinchapter.com/why-is-stellar-xlm-price-up-today/ […]