Key Takeaways:
- Ripple native token XRP witnessed the highest inflow among altcoins
- XRP price has formed a bullish technical pattern
NEW DELHI (CoinChapter.com) — Fintech firm Ripple’s native token XRP enjoyed the highest weekly inflow among all other altcoins, according to the Coinshares digital asset fund flows report.
Overall, digital asset investment products had a rather “lackluster” week, with inflows totaling $2.5 million. Bitcoin (BTC) enjoyed positive market sentiment, leading the market with $8.8 million in inflows. However, Bitcoin shorts saw outflows of $2.5 million.
Multi-asset digital funds had the highest outflow of $3 million, followed closely by Ethereum (ETH), with $2.8 million in outflows.
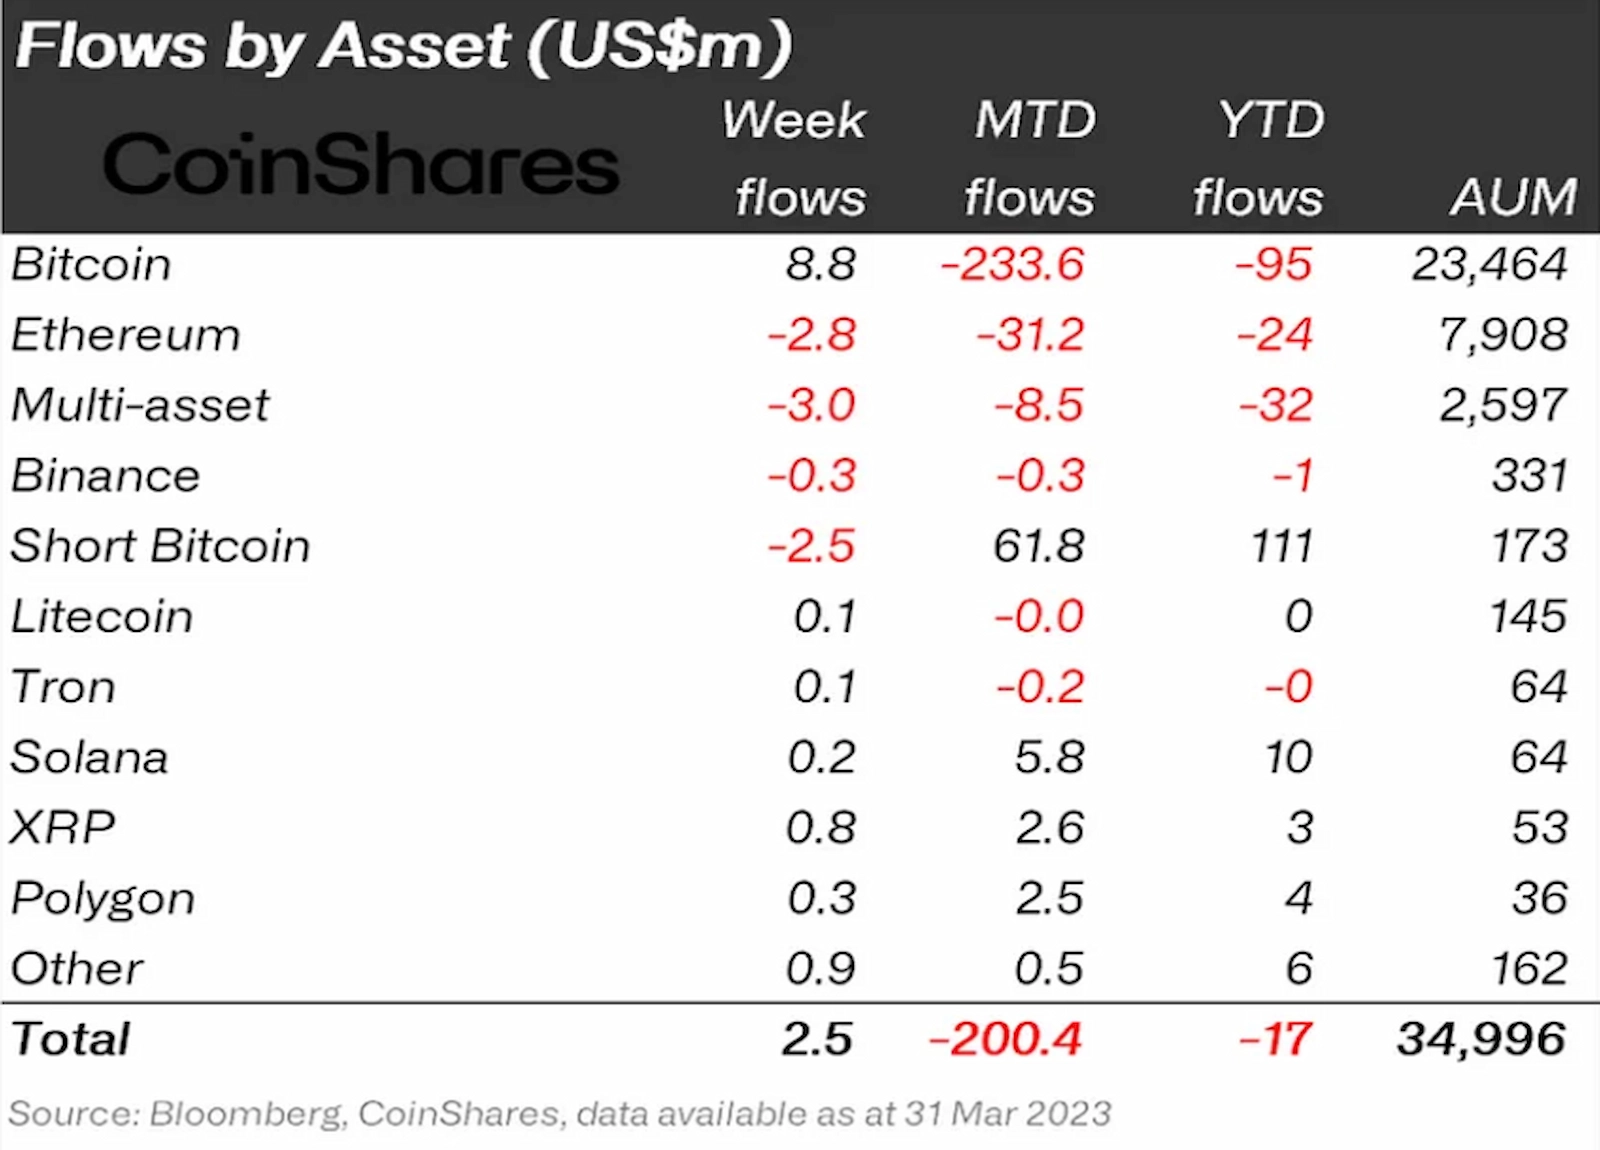
XRP saw inflows of $0.8 million, the highest among all altcoins. Polygon had the second-highest inflow, enjoying $0.3 million in inflows. XRP inflows suggest investors might be speculating a positive verdict in the Ripple-SEC lawsuit.
At the same time, Ethereum’s outflows might be linked to market sentiment around the upcoming Shanghai upgrade, which would allow validators to withdraw their staked ETH.
XRP Price Forms Bullish Technical Pattern
Meanwhile, the Ripple token formed a bullish technical pattern called the ascending triangle. A horizontal line connecting swing highs and a rising trendline connecting swing lows form the pattern.
In an ideal world, buyers would enter the market as the trendlines close the gap, pushing prices above horizontal resistance with heavy volumes. But, unfortunately, the horizontal trendline rebuffed XRP’s rally, forcing the token to pull back.
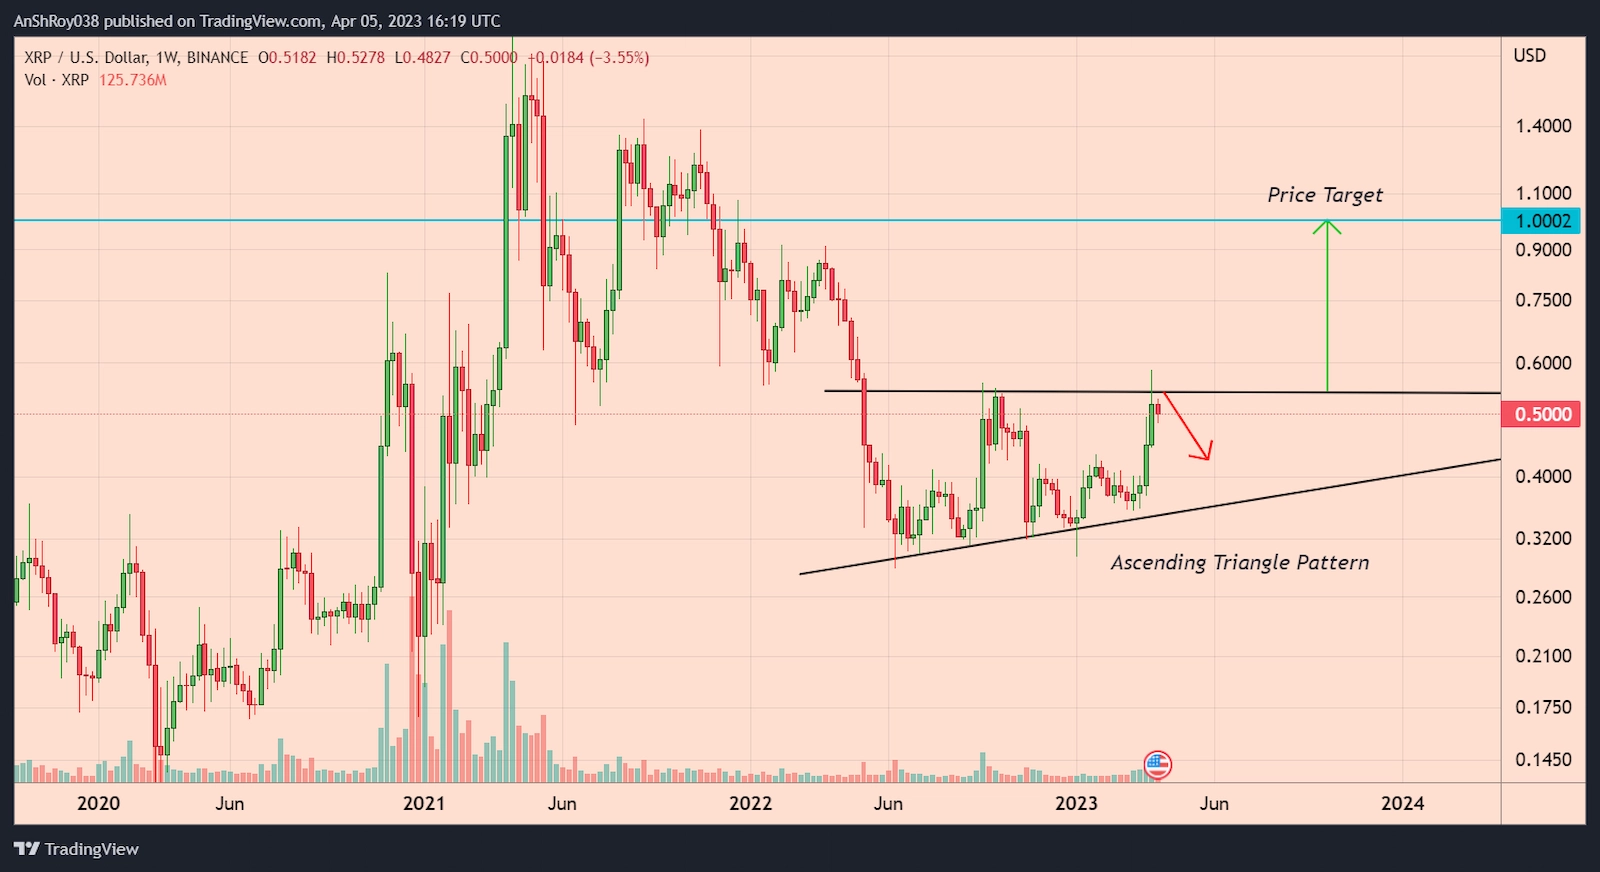
The price target for a breakout is equal to the triangle’s height at its thickest point. Hence, XRP price could rise 100% to reach $1 once the token exhausts the pattern.
Also Read: Ethereum token ETH on its way to $2K outpacing Bitcoin – altseason ahead?However, it is likely that XRP price would pull back from the upper trendline of the pattern before re-attempting a breakout. Hence, XRP’s prospects might be bearish in the short term.
Price Chart
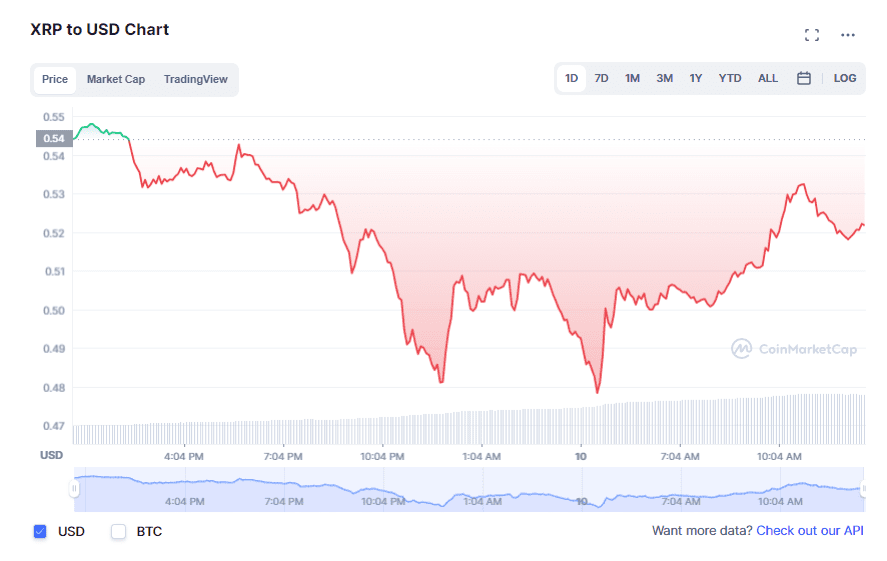
XRP price started rallying on March 25, but the bull run fizzled out around March 31. The Ripple token is down more than 7.4% in April. However, bulls seem to be aggressively defending ascending trendline support as XRP price swung 5.6% to form a daily high of $0.53 on April 5.
Long upper wicks on the daily candles underscore the bearish pressure against XRP prices. Moreover, the momentum oscillator MACD is on the verge of forming a bearish crossover.
Positive bars on the indicator’s histogram are contracting, indicating that the MACD line (difference between 12-day and 26-day EMA) is moving towards the MACD signal line (9-day EMA of MACD) and will soon cross below it.
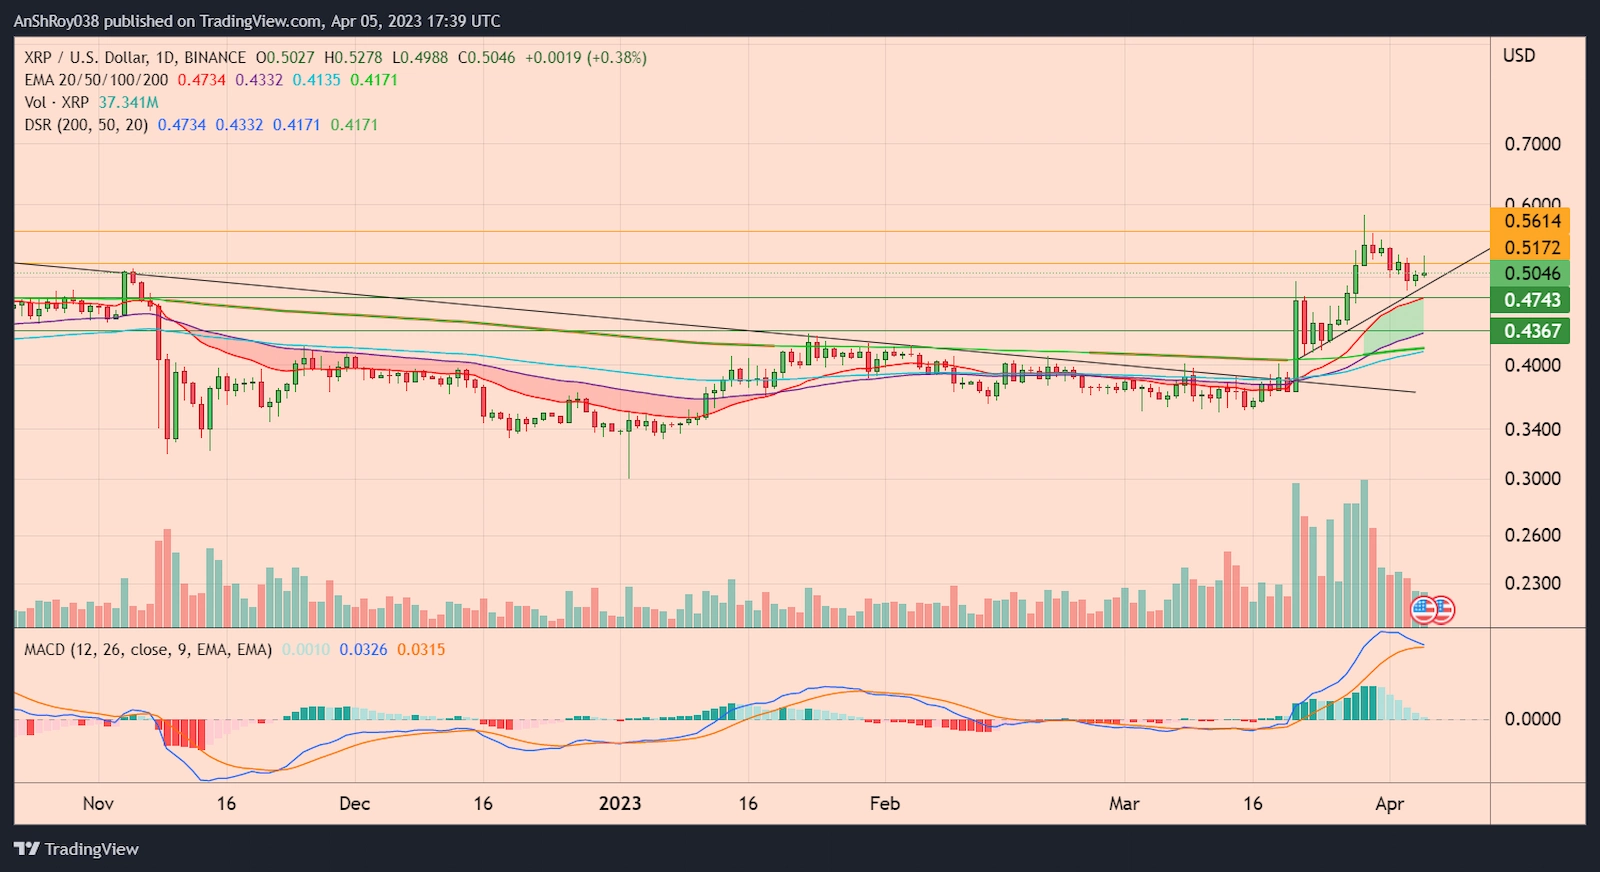
Traders often consider the pattern a sell signal which could increase the selling pressure against the Ripple token. As sellers enter the market, XRP price could break below the ascending trendline support and drop to its 20-day EMA (red wave) support near $0.474.
Breaching the immediate support level could force the Ripple token to drop 13.5% from the current level and fall to its 50-day EMA (purple wave) support near $0.437.
Conversely, if bulls hold XRP price above the trendline support, the token might break above the resistance near $0.52. Breaking above the immediate resistance could help XRP price target resistance near $0.56 before downside corrections pare gains.

… [Trackback]
[…] Find More Information here on that Topic: coinchapter.com/xrp-leads-altcoins-in-weekly-inflows-as-the-ripple-token-forms-bullish-pattern/ […]
… [Trackback]
[…] There you will find 10106 additional Information on that Topic: coinchapter.com/xrp-leads-altcoins-in-weekly-inflows-as-the-ripple-token-forms-bullish-pattern/ […]
… [Trackback]
[…] There you can find 19560 additional Information on that Topic: coinchapter.com/xrp-leads-altcoins-in-weekly-inflows-as-the-ripple-token-forms-bullish-pattern/ […]
… [Trackback]
[…] Find More on to that Topic: coinchapter.com/xrp-leads-altcoins-in-weekly-inflows-as-the-ripple-token-forms-bullish-pattern/ […]
… [Trackback]
[…] Information to that Topic: coinchapter.com/xrp-leads-altcoins-in-weekly-inflows-as-the-ripple-token-forms-bullish-pattern/ […]
… [Trackback]
[…] Find More Info here on that Topic: coinchapter.com/xrp-leads-altcoins-in-weekly-inflows-as-the-ripple-token-forms-bullish-pattern/ […]
… [Trackback]
[…] Information to that Topic: coinchapter.com/xrp-leads-altcoins-in-weekly-inflows-as-the-ripple-token-forms-bullish-pattern/ […]
… [Trackback]
[…] Info to that Topic: coinchapter.com/xrp-leads-altcoins-in-weekly-inflows-as-the-ripple-token-forms-bullish-pattern/ […]