

NOIDA (CoinChapter.com)— Bitcoin’s upcoming halving is the talk of the town, but Bitcoin’s bearish cues could upset traders’ predictions. Halving events have historically been a strong bullish cue for BTC price, and with the recent Bitcoin ATH still fresh in the market’s memory, traders anticipate a massive uptrend. However, a trifecta of indicators may point otherwise.
In a market where fortunes hang on fickle sentiment swings, Bitcoin’s halving might not result in the immediate rally that traders hoped for. Geopolitical, macroeconomic, and technical, the BTC price might be facing the complete trifecta of bearish cues.
The bearish cues in store for BTC might force the token to consolidate or even undergo a significant correction, according to crypto analysis X account ‘Stockmoney Lizards.’
The Crest of the Bearish Wave
A complex tapestry of interconnected bearish indicators could spell doom for Bitcoin prices.
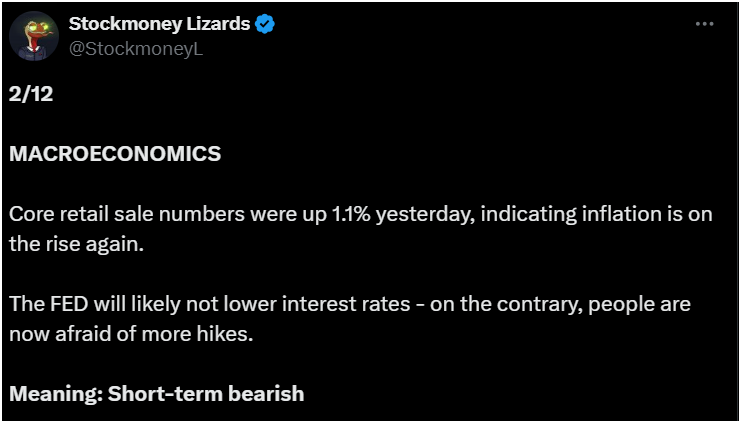
Recent CPI data showed an uptick in core retail sales figures, signaling a resurgence of inflation. This could lead the Federal Reserve to consider interest rate hikes—a traditional pressure point for asset prices, including Bitcoin.
Moreover, BitMEX founder Arthur Hayes suggested to traders that the immediate effects of the halving might be negative. Hayes bases his argument on the idea that when most market participants expect a specific outcome, the opposite often happens due to market dynamics.
Additionally, geopolitical tensions between Iran and Israel inject a layer of unpredictability that historically precedes market downturns. Analysts speculated that the Iran-Israel tensions were responsible for the April 12 market crash, though the crash was likely more about the US tax season.
Stockmoney analysts noted that Iran’s attack on Israel last week did create tension in the market. However, the market has not “fully priced in” a possible counterattack from Israel. If (and when) that happens, the market is likely to drop.
Bitcoin’s Bearish Technicals And Cooling Institutional Interest
Stockmoney Lizard highlighted more of Bitcoin’s bearish cues in the cryptocurrency’s price charts.
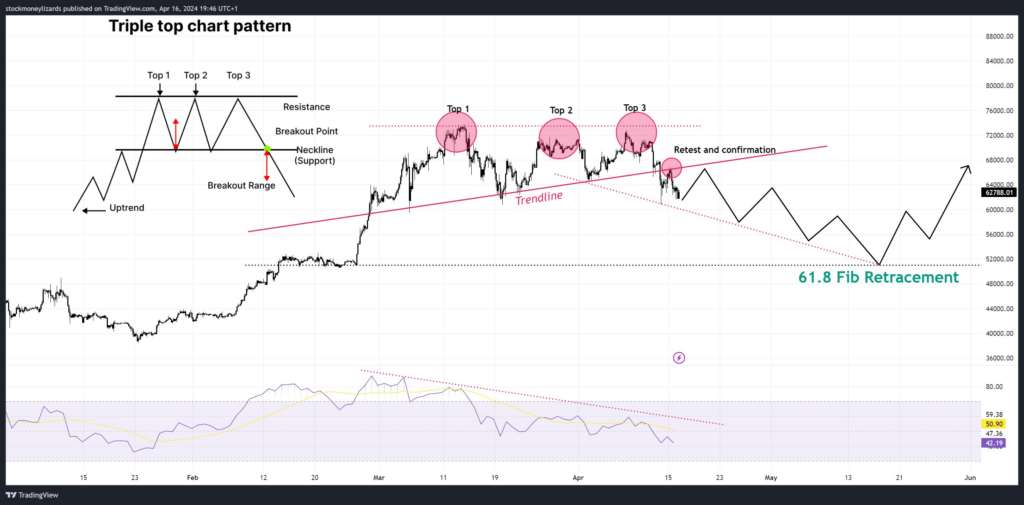
BTC price has formed a triple-top pattern that signals a formidable resistance level Bitcoin is struggling to break. Furthermore, Bitcoin price is also facing declining price momentum, evident from the lower highs on the Relative Strength Index (RSI).
Additionally, a broken and retested neckline of the triple top pattern highlights the bearish pressure challenging the Bitcoin price.
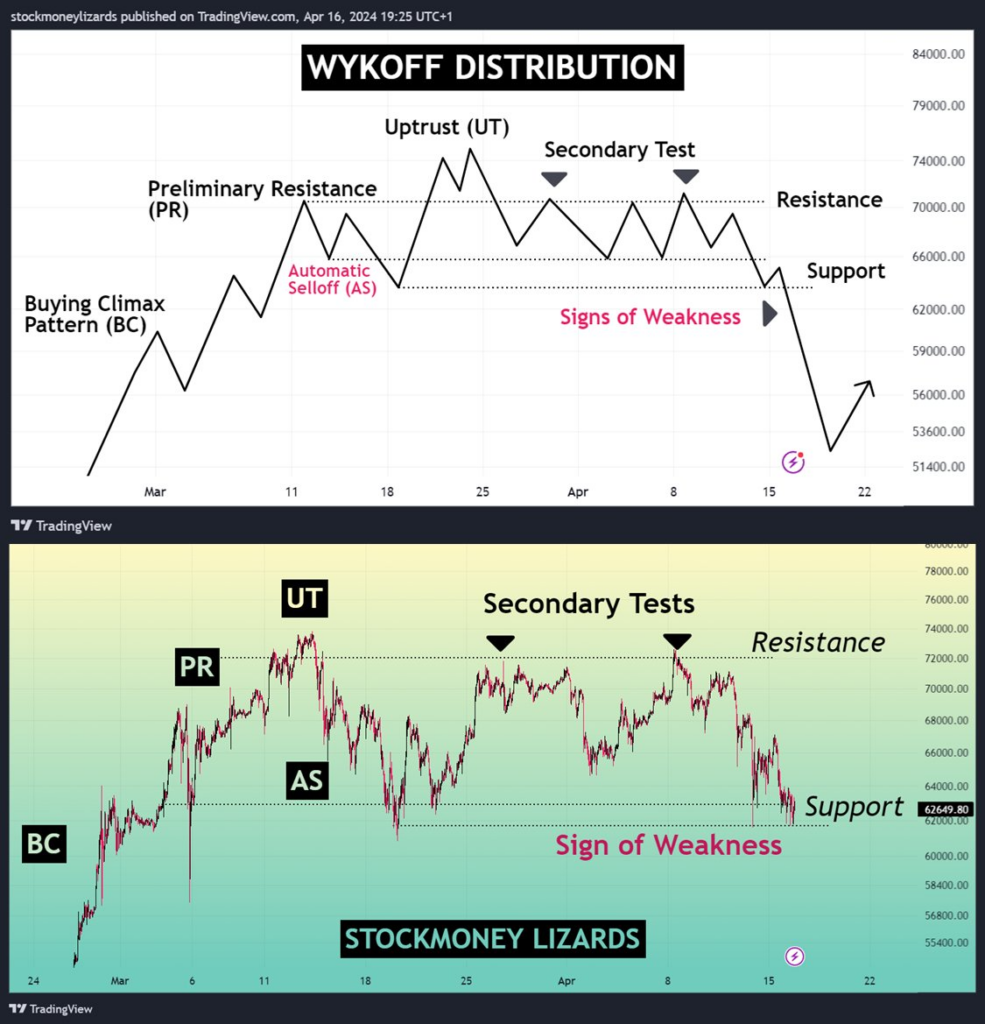
Furthermore, the current chart configuration mirrors a classic Wyckoff distribution pattern. This technical setup identifies potential price reversals and continuation through key phases of accumulation and distribution, hinting at a potential further downside.
A downtrend below the pattern’s support could drop the BTC price to around $50,000.
Moreover, a decline in inflows into Spot Bitcoin ETFs reflects institutional investors’ caution, suggesting the market participants are preparing for potential future market dips and setting a somber tone for Bitcoin’s short and medium-term outlook.
Bitcoin Price Still Has Some Bullish Beacons On The Horizon
Yet, all is not lost. Ironically, halving remains the strongest bullish cue for the BTC token. Historically, the halving event has thrice heralded significant upswings in value. Additionally, Bitcoin has a history of resilience, bouncing back from previous lows to achieve new highs.
Meanwhile, the OG crypto token has formed a bullish technical setup called the ‘Bull Flag pattern.’
Bull flags consist of a flag pole formed after a near-vertical rise in the crypto token’s prices. Assets in a strong uptrend often form the pattern.
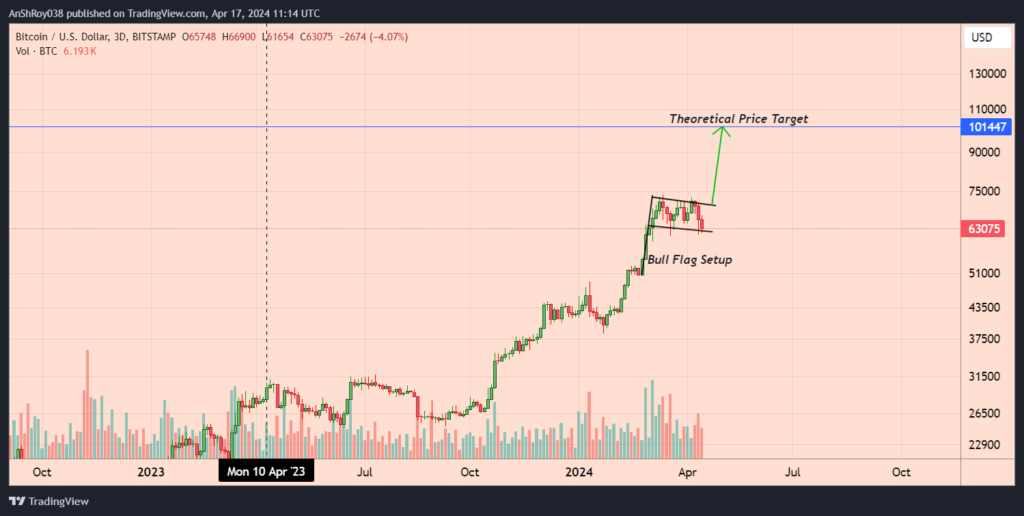
A period of consolidation succeeding the steep uptrend forms the flag of the pattern. Despite the strong vertical rally, the asset price does not drop as bulls maintain the buying pressure. As a result, the breakout from the flag pattern often results in a powerful uptrend.
The pattern is completed when the price breaks out of the flag area, continuing the previous upward trend. Traders calculate the price target of the breakout by adding the length of the flag pole to the breakout price level.
According to the rules of technical analysis, if the pattern is confirmed, the BTC price might rally over 61% to reach the theoretical price target near $101,400.
Moreover, the recent ETF approval in Hong Kong hints at a growing institutional and retail acceptance that could lead to increased demand.
Although big players are currently cautious, their interest in Bitcoin may not have waned completely, as evident from recent whale accumulations. These bullish signals, set against the backdrop of Bitcoin’s enduring narrative, might offer hope to those looking past the immediate turbulence.

