

NOIDA (CoinChapter.com)—The Open Network’s Toncoin (TON) saw a significant surge in its market value and capitalization recently, but although the price reached a new ATH on April 9, TON is not a buy now. Though the rally continued this week, bearish risks against the token compound.
The first cue against TON prices bull run is an obvious and familiar villain: profit booking.
It is common for a token to correct after reaching a new record high as traders who bought near the lows start selling to book profits. The simple principle of demand and supply results in a price drop for the token.
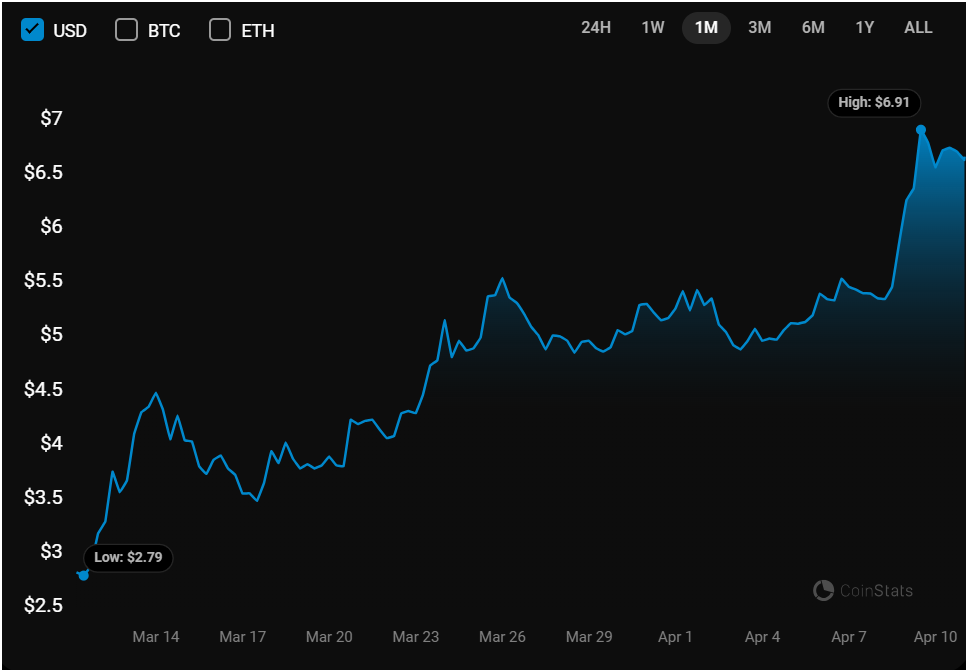
Toncoin price corrected more than 10% within 24 hours of reaching the ATH on April 9, resulting in TON price reaching a daily low near $6.4 on April 10.
The Open Network token has been on a bull run since Feb. 2024, which means even if a trader entered the market in mid-March, their gains are now close to 87%. Hence, the TON price could face more bearish headwinds in the coming days. A slight correction could open the FUD floodgates with traders pulling out of the market to secure their profits.
Toncoin Price Forms Bearish Pattern
TON is not a buy now due to another bearish cue: the token is forming a bearish pattern called the ‘Rising Wedge.‘
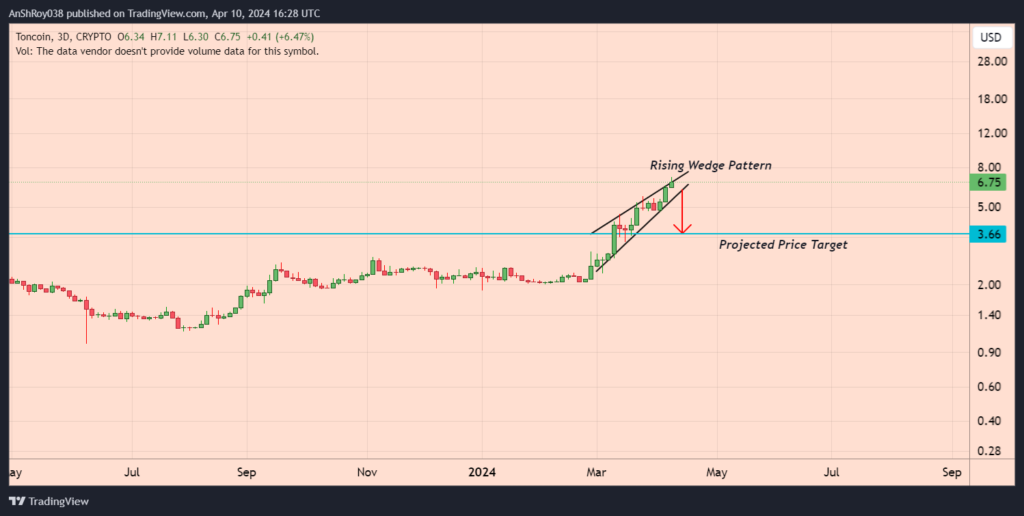
The pattern forms when an asset’s price consolidates between upward-sloping support and converging resistance lines resembling a wedge. Declining trading volumes often accompany a breakdown below the pattern.
The price target of the pattern is equal to the height of the back of the wedge. If the Toncoin token price breaks below the bearish pattern, TON price might fall to the theoretical price target of $3.66, a drop of nearly 46% from current levels.
If TON price starts breaking out below the pattern’s support trendline, traders could panic and sell their tokens to avoid bearing losses.
Bulls Struggle Against TON Bears
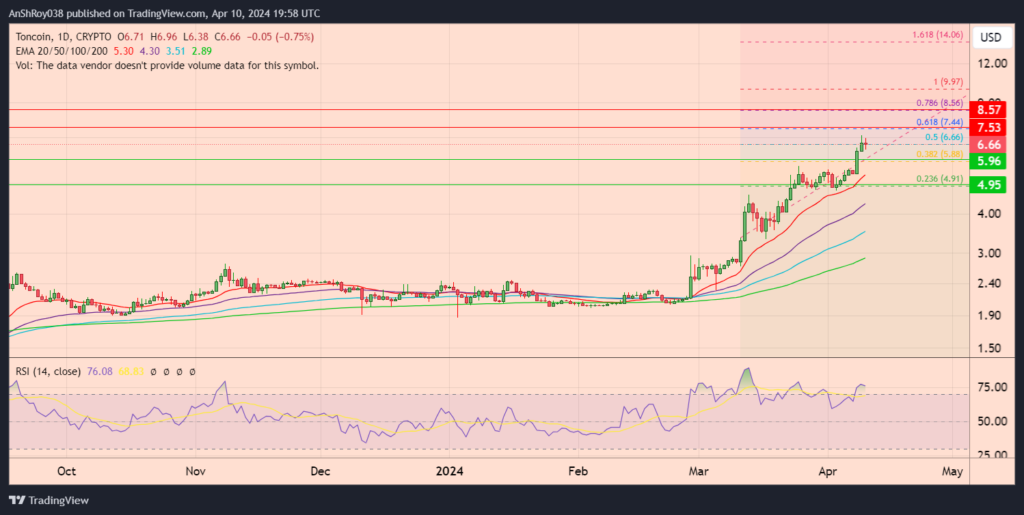
The bulls struggled to continue TON’s bull run on April 10. The long upper wicks on both ends of the token’s daily candle indicate both bears and bulls fighting to gain control over Toncoin’s price action.
Moreover, the relative strength index (RSI) for TON remained overbought, clocking a value of 76.08 on the daily charts. The RSI is a momentum indicator that measures asset price movements to identify overbought or oversold conditions.
Overbought RSI levels and upward-moving average trendlines indicate a strong presence of bulls in the market. However, traders often consider an overbought RSI level a bearish signal since the occurrence usually precedes a bearish reversal or consolidation phase for the underlying token.
As such, the TON price risks dropping to the $6 support level. Moreover, breaching the immediate support might force the Toncoin price to test the 0.236 FIB support near $4.9 before recovering.
However, if the token shrugs off the bearish cues against it, Toncoin price might rally to the resistance near $7.5, marking a new ATH. Breaching and consolidating above the immediate resistance might help TON price target the resistance near $8.6.

