
- Factom’s native token has been lingering within a sideways trading pattern since June 2021.
- But the FCT/USD pair tapped oversold levels and looked to print a 150% rally.
- Two bullish technical setups would fuel the upside move.
KOLKATA (CoinChapter.com) – Factom’s FCT looks to break out of its sideways trend on the back of two bullish technical formations. A combination of Ascending Channel, Falling Wedge patterns, and oversold relative strength index (RSI) numbers point to a 150% rally for the FCT/USD pair.
What Is Factom?
Factom is an enterprise-grade blockchain. Independent node operators secure data for private and public organizations by publishing cryptographically encrypted data on Factom’s immutable, distributed blockchain. Factoid (FCT) is Factom’s native cryptocurrency token.
The blockchain works atop the Bitcoin blockchain. And in the process leverages the top cryptocurrency’s hashrate to keep transaction records secure. According to the official website, “the layering effect of security ensures the immutability of its blocks.”
The Department of Homeland Security (DHS) Science and Technology Directorate (S&T) awarded a $192,380 grant to Factom’s parent company Factom, Inc., in June 2018 for testing blockchain technology’s potential to secure Internet of Things (IoT) data.
Essentially Factom scales up the Bitcoin blockchain by handling high transaction volumes. Factom was specially created to rid Bitcoin of its scalability inefficiencies. However, the brilliance of Factom’s technology didn’t do much to revive its market sentiment.
FCT/USD Technical Setup
The FCT/USD pair achieved its all-time high price of $75.64 on January 8, 2018. However, since then, the token has depreciated by nearly 99%. Factom’s native blockchain asset has even touched lows of $0.5 on October 1, 2020, despite the crypto market’s bullishness then.
But the cent percent erosion in FCT’s price has brought forth the occurrence of a bullish possibility in the near term. Two consecutive bullish formations signal a 150% rally for the Bitcoin scaling blockchain token. One is the Ascending Channel setup, while the other is the Falling Wedge formation.
Related: Bitcoin smart contracts protocol Stacks shoots up by 20%; what’s next for STX?
In detail, the Falling Wedge pattern hints at a recovery post a bottoming scenario, with the degree of recovery sharing congruence with the maximum distance (in price terms) between its upper and lower trendlines. In the FCT/USD pair’s case, the distance is $2.5. Thus, a $2.5 jump from current prices at $1.5 positions the pair at $4, a nearly 150% appreciation.
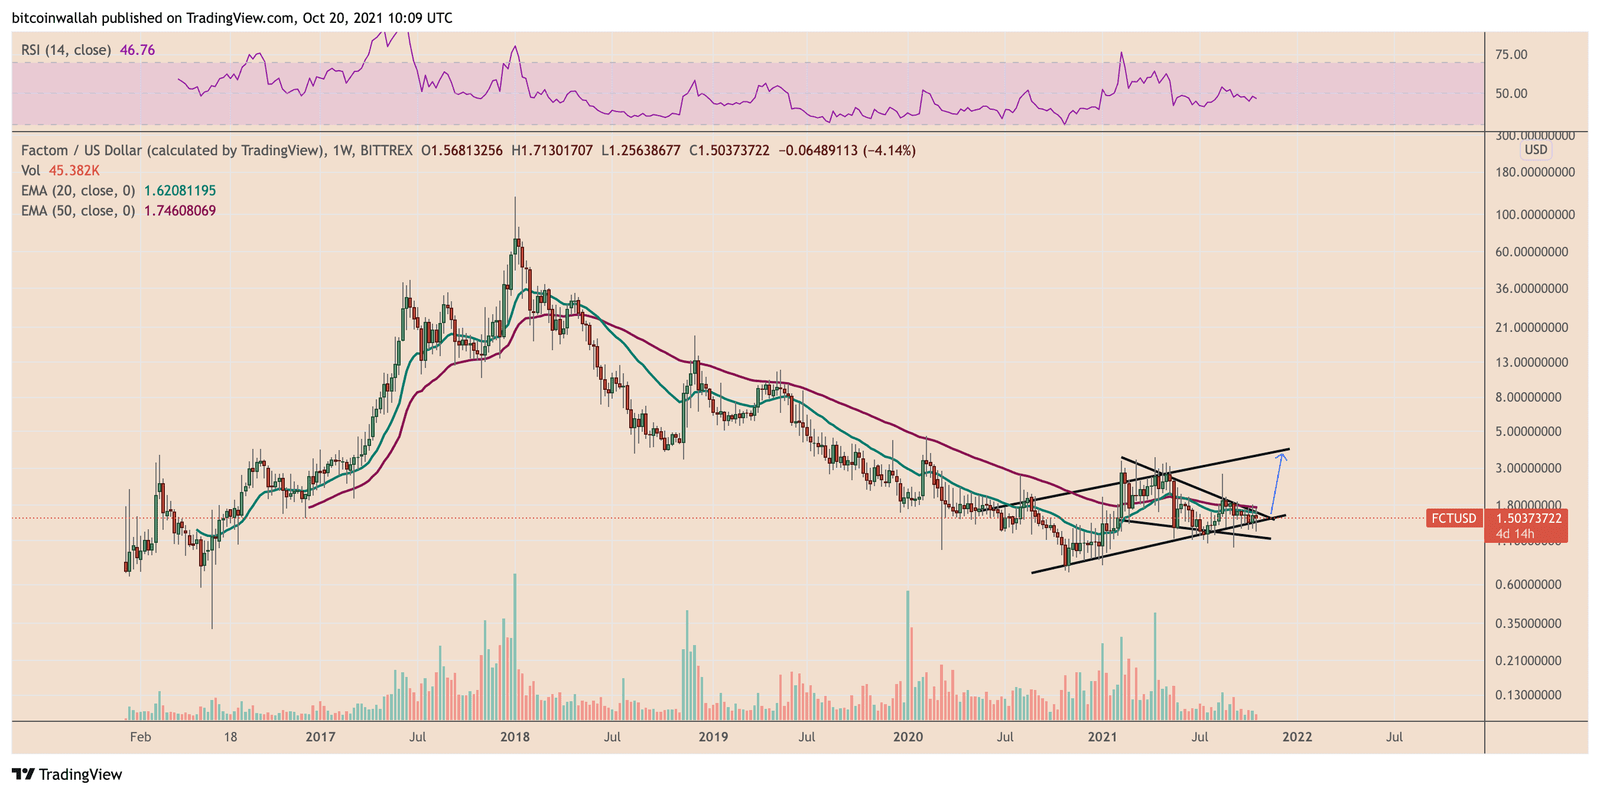
The confluence of the above scenario with FCT’s Ascending Channel formation implies that the token would eventually retest the channel’s upper trendline at $4.
Since cryptocurrency markets are already rallying hard, it is a good day to place buy bets on Factom’s underlying asset.

… [Trackback]
[…] Read More on on that Topic: coinchapter.com/a-150-price-rally-awaits-factom-as-fct-paints-two-convincing-bullish-patterns/ […]
… [Trackback]
[…] Read More Information here to that Topic: coinchapter.com/a-150-price-rally-awaits-factom-as-fct-paints-two-convincing-bullish-patterns/ […]