

Key Takeaways:
- Aave Protocol shared a proposal to convert 1,600 Ether into wstETH and rETH.
- However, AAVE price dipped after rallying 37% since June 29.
NEW DELHI (CoinChapter.com) — DeFi platform Aave’s treasury has put forward a proposal to convert 1,600 ETH (worth over $3 million at writing) into wstETH and rETH to earn staking rewards.
Wrapped Staked ETH (wstETH) and rocket pool ETH (rETH) are liquid staking derivatives, which allow users to earn rewards for locking crypto assets in a blockchain network while retaining the liquidity of the locked funds.
Aave, with a current TVL of $5.95 billion, might be able to earn 3.8% by staking wstETH and 3.13% with rETH. In comparison, the DeFi platform’s treasury currently earns 1.69% by staking the 1,600 ETH on the Aave V2 platform.
At present, the proposal has 252,152 votes, all in favor. The voting period would end on July 8.
Meanwhile, the namesake token of the protocol, AAVE, has formed a bearish technical pattern called the ‘Descending Triangle.‘
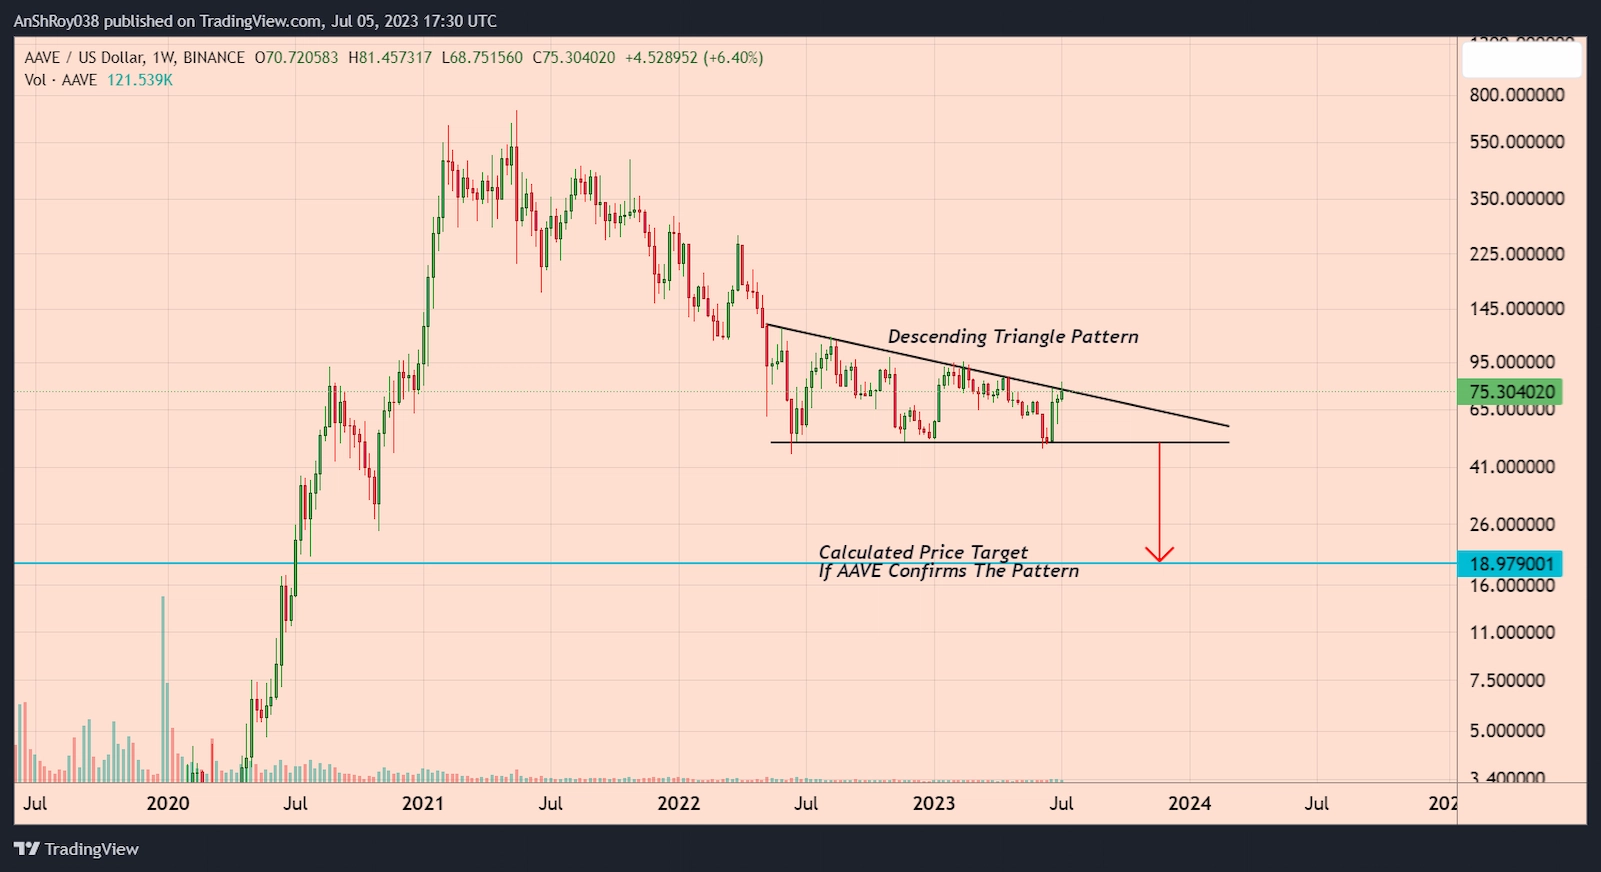
The descending triangle is a bearish continuation setup with a falling resistance line that caps upside attempts and a flat support that prevents declines. The height of the triangle’s thickest section determines the price target in a descending triangle setup.
Also Read: Zilliqa (ZIL) dropped 10% after network upgrade – what’s ahead?Therefore, if the triangle pans out, AAVE faces a drop of 75% to $19. The token last reached the price level in July 2020.
AAVE Price Rally Falters, But Bulls Defend EMA Support
AAVE price dropped over 11% on July 5 before bulls recovered some of the losses. Long upper wicks on recent daily candles suggest the token is facing increasing bearish pressure. However, the bulls continue to defend the 200-day EMA (green wave) support level near $71.
Moreover, failure of the EMA support level could send the token’s price crashing to $63 before recovering.
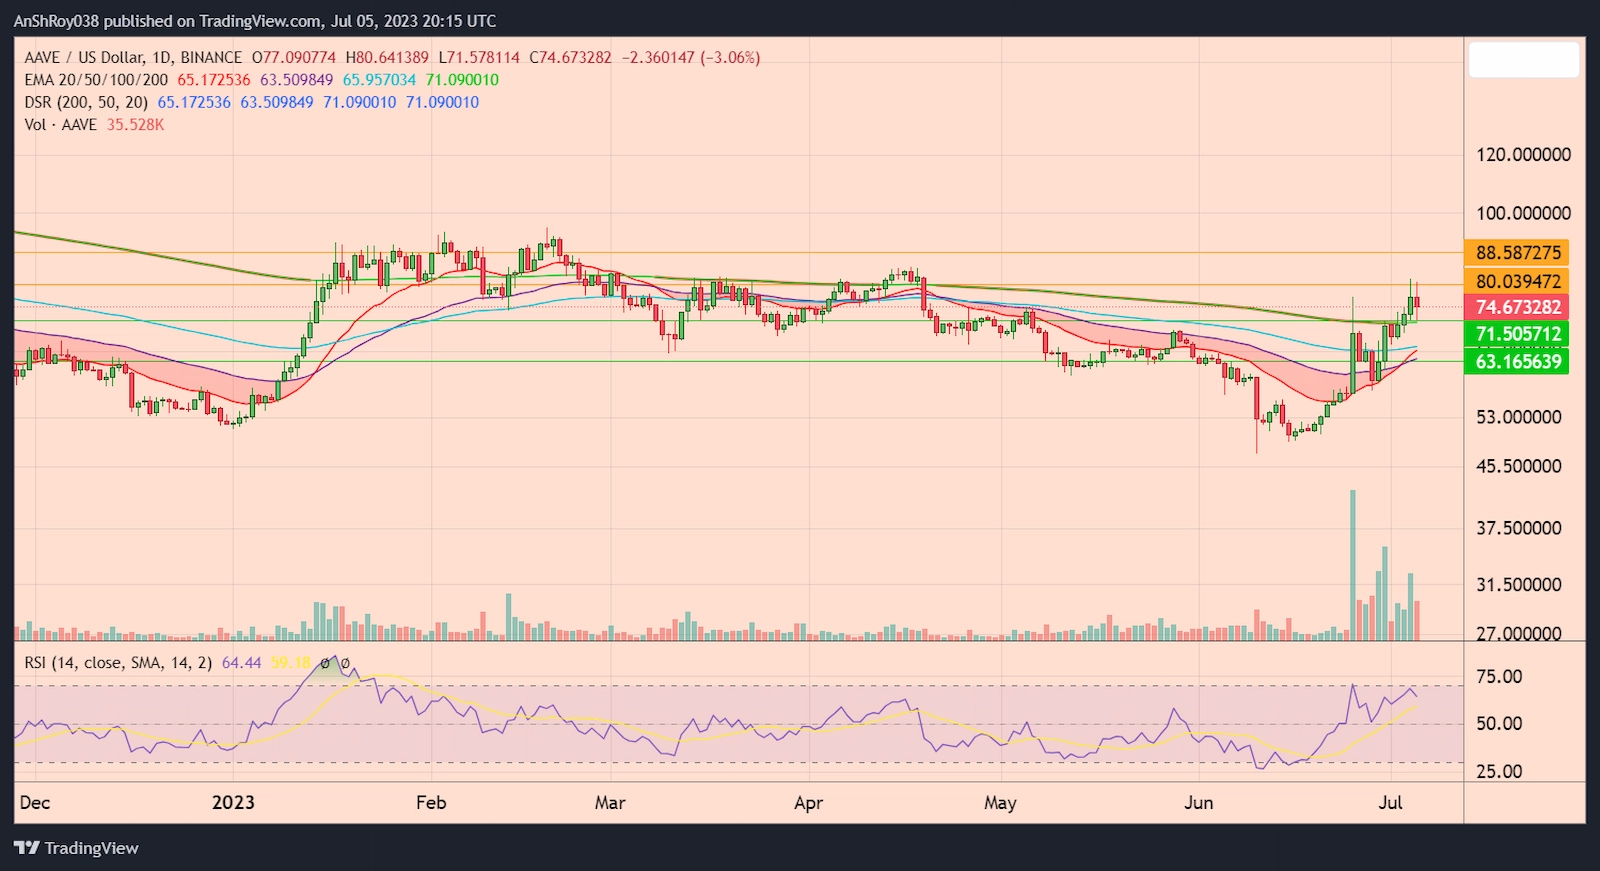
Additionally, AAVE’s 100-day EMA (blue wave) and 20-day EMA (red wave) seem on course to form a bullish pattern called the ‘golden cross.’
Traders often consider the pattern a signal of bullish market sentiment. Hence, if buyers enter the market, AAVE price might rise to the resistance near $80.
Furthermore, breaking and consolidating above the immediate resistance might help the DeFi token price target resistance near $88.6 before retreating. A rise to the $88.6 resistance level would help Aave recover most of its 2023 losses.
The RSI for the token remained neutral, clocking at 64.44 on the daily charts.

You are my inhalation, I have few blogs and rarely run out from to brand.
Heya i’m for the first time here. I found this board and I find It really useful & it helped me out much. I hope to give something back and help others like you aided me.
Excellent website. Plenty of useful information here. I am sending it to a few pals ans additionally sharing in delicious. And of course, thanks for your sweat!
Hi, i think that i saw you visited my site so i came to “return the favor”.I am attempting to find things to enhance my web site!I suppose its ok to use some of your ideas!!
I conceive other website proprietors should take this internet site as an example , very clean and good user friendly design and style.
Good day very cool web site!! Man .. Beautiful .. Superb .. I will bookmark your website and take the feeds additionally?KI am satisfied to find numerous useful info here within the post, we’d like develop extra techniques in this regard, thanks for sharing. . . . . .
I really enjoy reading through on this website , it has great posts. “You should pray for a sound mind in a sound body.” by Juvenal.
I together with my friends ended up taking note of the excellent tips on your site while unexpectedly got an awful feeling I never expressed respect to the web blog owner for them. Most of the women came excited to learn all of them and already have truly been tapping into those things. We appreciate you simply being so thoughtful and for pick out certain incredibly good issues millions of individuals are really needing to be informed on. My sincere apologies for not saying thanks to you sooner.
You made some clear points there. I looked on the internet for the subject and found most guys will consent with your site.
I’ve been absent for a while, but now I remember why I used to love this web site. Thanks, I will try and check back more frequently. How frequently you update your website?
Hello, Neat post. There’s a problem together with your web site in web explorer, may test this?K IE still is the marketplace leader and a huge component to people will pass over your great writing because of this problem.
Thank you for sharing superb informations. Your web site is very cool. I am impressed by the details that you¦ve on this site. It reveals how nicely you understand this subject. Bookmarked this web page, will come back for more articles. You, my friend, ROCK! I found simply the info I already searched everywhere and simply could not come across. What a great web site.
I like this website very much, Its a real nice office to read and receive info . “‘Taint’t worthwhile to wear a day all out before it comes.” by Sarah Orne Jewett.
What’s Happening i’m new to this, I stumbled upon this I’ve found It positively helpful and it has helped me out loads. I hope to contribute & aid other users like its helped me. Good job.
I got good info from your blog
I enjoy, lead to I found just what I was looking for. You have ended my 4 day lengthy hunt! God Bless you man. Have a nice day. Bye
Rattling superb visual appeal on this website , I’d value it 10 10.
I truly appreciate this post. I¦ve been looking all over for this! Thank goodness I found it on Bing. You’ve made my day! Thanks again
You have brought up a very superb points, regards for the post.
You can definitely see your enthusiasm in the paintings you write. The arena hopes for even more passionate writers like you who aren’t afraid to mention how they believe. At all times go after your heart.
Wow that was odd. I just wrote an incredibly long comment but after I clicked submit my comment didn’t show up. Grrrr… well I’m not writing all that over again. Regardless, just wanted to say great blog!
You made some clear points there. I did a search on the issue and found most people will go along with with your website.
Nice read, I just passed this onto a colleague who was doing a little research on that. And he actually bought me lunch since I found it for him smile Therefore let me rephrase that: Thanks for lunch!
Excellent goods from you, man. I have understand your stuff previous to and you are just extremely fantastic. I really like what you’ve acquired here, certainly like what you’re stating and the way in which you say it. You make it entertaining and you still care for to keep it wise. I can not wait to read far more from you. This is really a tremendous web site.
Can I just say what a relief to find someone who actually knows what theyre talking about on the internet. You definitely know how to bring an issue to light and make it important. More people need to read this and understand this side of the story. I cant believe youre not more popular because you definitely have the gift.
Hi, Neat post. There’s a problem with your site in internet explorer, may test thisK IE nonetheless is the market chief and a good component to people will leave out your great writing due to this problem.
You have observed very interesting points! ps decent website . “I hate music, especially when it’s played.” by Jimmy Durante.
Great write-up, I?¦m normal visitor of one?¦s web site, maintain up the nice operate, and It’s going to be a regular visitor for a lengthy time.
Hi my friend! I want to say that this post is awesome, great written and come with approximately all significant infos. I’d like to peer extra posts like this .
Rattling excellent visual appeal on this site, I’d value it 10 10.
This is very interesting, You are an excessively professional blogger. I’ve joined your feed and stay up for looking for extra of your great post. Additionally, I’ve shared your website in my social networks!
Hey there! I just wanted to ask if you ever have any problems with hackers? My last blog (wordpress) was hacked and I ended up losing many months of hard work due to no data backup. Do you have any methods to protect against hackers?
I would like to thnkx for the efforts you’ve put in writing this site. I am hoping the same high-grade website post from you in the upcoming as well. Actually your creative writing skills has inspired me to get my own website now. Really the blogging is spreading its wings quickly. Your write up is a good example of it.
Hello there, just became alert to your blog through Google, and found that it’s truly informative. I’m gonna watch out for brussels. I’ll appreciate if you continue this in future. Many people will be benefited from your writing. Cheers!
I just could not leave your website prior to suggesting that I actually enjoyed the standard information a person provide to your guests? Is gonna be back often in order to inspect new posts
You have brought up a very great details, thankyou for the post.
I really like your writing style, great information, thanks for posting :D. “Faith is a continuation of reason.” by William Adams.
Heya i am for the primary time here. I came across this board and I find It really useful & it helped me out a lot. I am hoping to offer something again and aid others such as you aided me.
I do trust all of the concepts you’ve introduced in your post. They are really convincing and can definitely work. Still, the posts are very short for novices. Could you please extend them a bit from next time? Thanks for the post.
Thank you so much for providing individuals with an exceptionally terrific possiblity to read in detail from here. It can be so good plus jam-packed with amusement for me personally and my office peers to search your web site at minimum thrice a week to see the fresh stuff you have got. And of course, I’m so usually astounded with the good tricks you serve. Some two facts in this article are ultimately the very best I have had.
At this time it appears like WordPress is the top blogging platform available right now. (from what I’ve read) Is that what you are using on your blog?
I have recently started a blog, the information you provide on this web site has helped me greatly. Thank you for all of your time & work.
This really answered my problem, thank you!
Hi , I do believe this is an excellent blog. I stumbled upon it on Yahoo , i will come back once again. Money and freedom is the best way to change, may you be rich and help other people.
Good web site! I really love how it is easy on my eyes and the data are well written. I’m wondering how I might be notified whenever a new post has been made. I have subscribed to your RSS which must do the trick! Have a nice day!
Thank you for sharing with us, I conceive this website genuinely stands out : D.
It’s actually a nice and useful piece of information. I am satisfied that you simply shared this helpful info with us. Please keep us informed like this. Thank you for sharing.
Amazing blog! Is your theme custom made or did you download it from somewhere? A theme like yours with a few simple tweeks would really make my blog shine. Please let me know where you got your theme. Bless you
Hi there, I discovered your blog via Google while looking for a related matter, your website got here up, it looks great. I’ve bookmarked it in my google bookmarks.
Greetings! I know this is kinda off topic however , I’d figured I’d ask. Would you be interested in trading links or maybe guest authoring a blog post or vice-versa? My blog goes over a lot of the same subjects as yours and I think we could greatly benefit from each other. If you happen to be interested feel free to shoot me an email. I look forward to hearing from you! Fantastic blog by the way!
Having read this I thought it was very informative. I appreciate you taking the time and effort to put this article together. I once again find myself spending way to much time both reading and commenting. But so what, it was still worth it!
Yesterday, while I was at work, my sister stole my iPad and tested to see if it can survive a 30 foot drop, just so she can be a youtube sensation. My apple ipad is now broken and she has 83 views. I know this is totally off topic but I had to share it with someone!
I have been browsing on-line more than 3 hours nowadays, yet I never discovered any interesting article like yours. It is pretty price enough for me. In my view, if all web owners and bloggers made excellent content as you did, the internet will likely be a lot more useful than ever before. “Baseball is 90 percent mental. The other half is physical.” by Lawrence Peter Berra.
Can I just say what a relief to find someone who actually knows what theyre talking about on the internet. You definitely know how to bring an issue to light and make it important. More people need to read this and understand this side of the story. I cant believe youre not more popular because you definitely have the gift.
Great post. I am facing a couple of these problems.
This is really attention-grabbing, You’re an excessively skilled blogger. I have joined your rss feed and look forward to in the hunt for more of your fantastic post. Additionally, I have shared your website in my social networks!
Thanks for some other wonderful article. The place else may anyone get that type of info in such an ideal way of writing? I’ve a presentation next week, and I am on the search for such info.
I enjoy your writing style truly loving this website .
Does your site have a contact page? I’m having problems locating it but, I’d like to send you an e-mail. I’ve got some recommendations for your blog you might be interested in hearing. Either way, great site and I look forward to seeing it expand over time.
Valuable info. Lucky me I found your web site accidentally, and I’m stunned why this accident didn’t came about earlier! I bookmarked it.
Good web site! I truly love how it is simple on my eyes and the data are well written. I am wondering how I might be notified whenever a new post has been made. I’ve subscribed to your feed which must do the trick! Have a great day!
Hello there, just become aware of your weblog thru Google, and found that it’s truly informative. I’m gonna watch out for brussels. I’ll appreciate should you continue this in future. Many folks can be benefited from your writing. Cheers!
But wanna say that this is very useful, Thanks for taking your time to write this.
Thank you for some other informative web site. The place else may just I get that type of info written in such an ideal manner? I have a venture that I’m simply now operating on, and I’ve been on the look out for such information.
I really enjoy reading on this web site, it holds great content. “It is easy to be nice, even to an enemy – from lack of character.” by Dag Hammarskjld.
Howdy! I could have sworn I’ve been to this blog before but after browsing through some of the post I realized it’s new to me. Nonetheless, I’m definitely happy I found it and I’ll be bookmarking and checking back often!
You have noted very interesting details! ps decent website.
Some times its a pain in the ass to read what website owners wrote but this web site is real user genial! .
I’m really impressed together with your writing abilities and also with the layout for your blog. Is this a paid theme or did you customize it your self? Either way stay up the nice quality writing, it is uncommon to peer a nice blog like this one today..
It’s arduous to seek out educated people on this subject, however you sound like you understand what you’re speaking about! Thanks
naturally like your web site however you have to take a look at the spelling on several of your posts. A number of them are rife with spelling problems and I in finding it very troublesome to tell the truth then again I’ll definitely come back again.
There is obviously a bundle to know about this. I assume you made certain good points in features also.
Great write-up, I¦m regular visitor of one¦s site, maintain up the excellent operate, and It is going to be a regular visitor for a lengthy time.
The next time I read a blog, I hope that it doesnt disappoint me as much as this one. I mean, I know it was my choice to read, but I actually thought youd have something interesting to say. All I hear is a bunch of whining about something that you could fix if you werent too busy looking for attention.
With havin so much content and articles do you ever run into any issues of plagorism or copyright violation? My site has a lot of completely unique content I’ve either written myself or outsourced but it appears a lot of it is popping it up all over the web without my authorization. Do you know any methods to help protect against content from being stolen? I’d really appreciate it.
Woh I like your content, saved to favorites! .
I like what you guys are up also. Such clever work and reporting! Carry on the excellent works guys I?¦ve incorporated you guys to my blogroll. I think it will improve the value of my web site 🙂
I like the efforts you have put in this, regards for all the great content.
I’m so happy to read this. This is the kind of manual that needs to be given and not the accidental misinformation that is at the other blogs. Appreciate your sharing this best doc.
Howdy very nice website!! Man .. Excellent .. Superb .. I’ll bookmark your site and take the feeds additionally…I’m satisfied to seek out so many helpful information here in the post, we’d like work out extra techniques on this regard, thanks for sharing.
Wow that was strange. I just wrote an incredibly long comment but after I clicked submit my comment didn’t appear. Grrrr… well I’m not writing all that over again. Anyways, just wanted to say excellent blog!
I was very happy to seek out this web-site.I needed to thanks for your time for this glorious learn!! I undoubtedly enjoying every little bit of it and I’ve you bookmarked to check out new stuff you weblog post.
Fantastic items from you, man. I’ve consider your stuff previous to and you are simply too magnificent. I actually like what you have bought here, certainly like what you’re saying and the best way by which you are saying it. You are making it entertaining and you still take care of to stay it sensible. I can not wait to read far more from you. That is actually a tremendous site.
I loved as much as you’ll receive carried out right here. The sketch is tasteful, your authored subject matter stylish. nonetheless, you command get got an nervousness over that you wish be delivering the following. unwell unquestionably come further formerly again as exactly the same nearly very often inside case you shield this increase.
Good day very nice website!! Man .. Excellent .. Wonderful .. I will bookmark your blog and take the feeds also…I’m glad to search out a lot of useful information right here in the put up, we’d like work out more techniques in this regard, thank you for sharing.
I do agree with all of the concepts you have introduced in your post. They’re really convincing and can certainly work. Nonetheless, the posts are too short for newbies. May just you please prolong them a bit from next time? Thank you for the post.
I do enjoy the manner in which you have presented this specific concern and it does indeed give me a lot of fodder for consideration. Nonetheless, through what I have experienced, I really wish when the responses pile on that individuals continue to be on issue and in no way start upon a tirade associated with the news of the day. Anyway, thank you for this fantastic piece and although I can not really agree with the idea in totality, I respect your perspective.
Hello there! Do you use Twitter? I’d like to follow you if that would be okay. I’m absolutely enjoying your blog and look forward to new updates.
I enjoy, result in I discovered just what I was looking for. You’ve ended my 4 day lengthy hunt! God Bless you man. Have a great day. Bye
Some really nice stuff on this website , I enjoy it.
Undeniably believe that that you stated. Your favourite reason appeared to be at the internet the simplest thing to be aware of. I say to you, I definitely get irked even as other folks consider issues that they just do not recognize about. You controlled to hit the nail upon the top as smartly as defined out the whole thing with no need side effect , other folks can take a signal. Will likely be back to get more. Thanks
Attractive part of content. I just stumbled upon your web site and in accession capital to claim that I acquire actually enjoyed account your weblog posts. Anyway I’ll be subscribing to your feeds or even I fulfillment you get entry to consistently fast.
Absolutely indited articles, Really enjoyed examining.
Good day! I could have sworn I’ve been to this website before but after checking through some of the post I realized it’s new to me. Anyways, I’m definitely happy I found it and I’ll be bookmarking and checking back often!
Aumente o público das suas transmissões! Compre visualizações para live no YouTube e ganhe mais engajamento, credibilidade e alcance na plataforma.
I am curious to find out what blog platform you are using? I’m experiencing some minor security issues with my latest site and I’d like to find something more safeguarded. Do you have any solutions?
After all, what a great site and informative posts, I will upload inbound link – bookmark this web site? Regards, Reader.
Its like you read my mind! You appear to know a lot about this, like you wrote the book in it or something. I think that you could do with a few pics to drive the message home a little bit, but other than that, this is wonderful blog. A great read. I’ll certainly be back.
I’m not sure where you are getting your information, but great topic. I needs to spend some time learning more or understanding more. Thanks for excellent info I was looking for this information for my mission.
I am really impressed together with your writing talents as smartly as with the format to your weblog. Is this a paid topic or did you customize it yourself? Either way stay up the nice quality writing, it’s uncommon to see a nice blog like this one today..
Once I originally commented I clicked the -Notify me when new feedback are added- checkbox and now every time a comment is added I get 4 emails with the same comment. Is there any way you’ll be able to remove me from that service? Thanks!
Hi there! I’m at work surfing around your blog from my new apple iphone! Just wanted to say I love reading through your blog and look forward to all your posts! Carry on the great work!
Hi, i think that i saw you visited my web site thus i came to “return the favor”.I am attempting to find things to enhance my site!I suppose its ok to use a few of your ideas!!
Mitolyn is a cutting-edge natural dietary supplement designed to support effective weight loss and improve overall wellness.
The Natural Mounjaro Recipe is more than just a diet—it’s a sustainable and natural approach to weight management and overall health.
I beloved up to you’ll receive carried out right here. The cartoon is tasteful, your authored subject matter stylish. nevertheless, you command get bought an edginess over that you would like be turning in the following. unwell undoubtedly come further in the past once more as precisely the same just about very ceaselessly inside of case you protect this hike.
The Natural Mounjaro Recipe is more than just a diet—it’s a sustainable and natural approach to weight management and overall health.
The Ice Water Hack has gained popularity as a simple yet effective method for boosting metabolism and promoting weight loss.
PrimeBiome is a dietary supplement designed to support gut health by promoting a balanced microbiome, enhancing digestion, and boosting overall well-being.
ProstaVive is a dietary supplement designed to promote prostate health, support urinary function, and improve overall well-being in men, especially as they age.
Great post. I was checking continuously this blog and I’m impressed! Extremely helpful info specially the last part 🙂 I care for such info much. I was looking for this particular information for a very long time. Thank you and good luck.
Very interesting points you have remarked, thankyou for putting up.
Wonderful site. A lot of useful information here. I am sending it to some friends ans also sharing in delicious. And obviously, thanks for your effort!
Would you be considering exchanging hyperlinks?
Hello! I could have sworn I’ve been to this blog before but after reading through some of the post I realized it’s new to me. Nonetheless, I’m definitely happy I found it and I’ll be bookmarking and checking back frequently!
Whats Going down i am new to this, I stumbled upon this I’ve found It absolutely helpful and it has aided me out loads. I am hoping to contribute & assist different customers like its helped me. Good job.
Hello, i feel that i noticed you visited my web site so i came to “go back the prefer”.I am trying to find issues to enhance my web site!I assume its adequate to make use of some of your ideas!!
WONDERFUL Post.thanks for share..extra wait .. …
I enjoy what you guys tend to be up too. This sort of clever work and exposure! Keep up the great works guys I’ve you guys to my own blogroll.
Hi there, You’ve done an incredible job. I’ll certainly digg it and in my view recommend to my friends. I’m sure they’ll be benefited from this site.
Thanks a bunch for sharing this with all of us you really know what you’re talking about! Bookmarked. Please also visit my web site =). We could have a link exchange agreement between us!
Can I simply say what a relief to find somebody who truly knows what theyre talking about on the internet. You definitely know how one can convey a problem to light and make it important. More individuals need to read this and understand this aspect of the story. I cant believe youre no more standard because you definitely have the gift.
But wanna remark on few general things, The website style is perfect, the content material is real fantastic : D.
Hey would you mind letting me know which hosting company you’re utilizing? I’ve loaded your blog in 3 completely different browsers and I must say this blog loads a lot quicker then most. Can you suggest a good web hosting provider at a reasonable price? Thanks a lot, I appreciate it!
Wonderful items from you, man. I have take note your stuff previous to and you are simply too magnificent. I really like what you’ve got here, really like what you’re saying and the best way in which you are saying it. You make it enjoyable and you still take care of to keep it wise. I can not wait to read far more from you. That is actually a wonderful web site.
Thanks for sharing superb informations. Your web-site is so cool. I’m impressed by the details that you have on this website. It reveals how nicely you perceive this subject. Bookmarked this web page, will come back for extra articles. You, my friend, ROCK! I found simply the information I already searched all over the place and simply could not come across. What a great web site.
Nice post. I learn something more challenging on different blogs everyday. It will always be stimulating to read content from other writers and practice a little something from their store. I’d prefer to use some with the content on my blog whether you don’t mind. Natually I’ll give you a link on your web blog. Thanks for sharing.
very nice put up, i certainly love this website, carry on it
Thank you for another informative blog. Where else could I get that kind of info written in such a perfect way? I have a project that I’m just now working on, and I have been on the look out for such info.
Appreciate it for this wondrous post, I am glad I found this website on yahoo.
hello there and thank you for your info – I have definitely picked up something new from right here. I did however expertise some technical issues using this web site, since I experienced to reload the site a lot of times previous to I could get it to load correctly. I had been wondering if your hosting is OK? Not that I’m complaining, but slow loading instances times will very frequently affect your placement in google and can damage your high-quality score if ads and marketing with Adwords. Anyway I am adding this RSS to my email and can look out for much more of your respective interesting content. Ensure that you update this again very soon..
Keep working ,terrific job!
It?¦s really a nice and useful piece of info. I am satisfied that you shared this helpful info with us. Please keep us up to date like this. Thanks for sharing.
F*ckin’ remarkable issues here. I’m very happy to peer your post. Thanks a lot and i’m taking a look ahead to contact you. Will you kindly drop me a e-mail?
great post, very informative. I wonder why the other experts of this sector do not notice this. You should continue your writing. I’m confident, you’ve a great readers’ base already!
Really superb info can be found on site. “I am not merry but I do beguile The thing I am, by seeming otherwise.” by William Shakespeare.
When I initially commented I clicked the “Notify me when new comments are added” checkbox and now each time a comment is added I get three emails with the same comment. Is there any way you can remove people from that service? Cheers!
Usually I don’t read article on blogs, but I wish to say that this write-up very forced me to try and do it! Your writing style has been amazed me. Thanks, quite nice article.
Hi there, You’ve performed an excellent job. I will definitely digg it and for my part suggest to my friends. I’m sure they’ll be benefited from this site.
Very interesting details you have noted, thanks for posting. “It’s the soul’s duty to be loyal to its own desires. It must abandon itself to its master passion.” by Rebecca West.
This design is incredible! You most certainly know how to keep a reader entertained. Between your wit and your videos, I was almost moved to start my own blog (well, almost…HaHa!) Excellent job. I really enjoyed what you had to say, and more than that, how you presented it. Too cool!
Mitolyn is a cutting-edge natural dietary supplement designed to support effective weight loss and improve overall wellness.
I like this site very much, Its a really nice spot to read and obtain info . “There is no human problem which could not be solved if people would simply do as I advise.” by Gore Vidal.
Thank you for sharing superb informations. Your web-site is very cool. I am impressed by the details that you have on this blog. It reveals how nicely you understand this subject. Bookmarked this website page, will come back for extra articles. You, my pal, ROCK! I found just the information I already searched everywhere and just could not come across. What an ideal web-site.
Thanx for the effort, keep up the good work Great work, I am going to start a small Blog Engine course work using your site I hope you enjoy blogging with the popular BlogEngine.net.Thethoughts you express are really awesome. Hope you will right some more posts.
Mitolyn is a cutting-edge natural dietary supplement designed to support effective weight loss and improve overall wellness.
When I initially commented I clicked the “Notify me when new comments are added” checkbox and now each time a comment is added I get several e-mails with the same comment. Is there any way you can remove people from that service? Appreciate it!
PrimeBiome is a dietary supplement designed to support gut health by promoting a balanced microbiome, enhancing digestion, and boosting overall well-being.
Hello! I could have sworn I’ve been to this blog before but after browsing through some of the post I realized it’s new to me. Anyways, I’m definitely happy I found it and I’ll be book-marking and checking back frequently!
PrimeBiome is a dietary supplement designed to support gut health by promoting a balanced microbiome, enhancing digestion, and boosting overall well-being.
PrimeBiome is a dietary supplement designed to support gut health by promoting a balanced microbiome, enhancing digestion, and boosting overall well-being.
Wonderful blog! I found it while surfing around on Yahoo News. Do you have any suggestions on how to get listed in Yahoo News? I’ve been trying for a while but I never seem to get there! Thanks
The next time I learn a blog, I hope that it doesnt disappoint me as much as this one. I imply, I know it was my choice to read, but I truly thought youd have one thing interesting to say. All I hear is a bunch of whining about one thing that you may fix in the event you werent too busy on the lookout for attention.
Hi, i read your blog from time to time and i own a similar one and i was just curious if you get a lot of spam responses? If so how do you stop it, any plugin or anything you can suggest? I get so much lately it’s driving me mad so any support is very much appreciated.
The Natural Mounjaro Recipe is more than just a diet—it’s a sustainable and natural approach to weight management and overall health.
I like what you guys are up also. Such intelligent work and reporting! Keep up the superb works guys I¦ve incorporated you guys to my blogroll. I think it will improve the value of my web site 🙂
Whats Happening i’m new to this, I stumbled upon this I’ve found It positively useful and it has aided me out loads. I am hoping to contribute & aid other customers like its aided me. Great job.
Hello there, just changed into aware of your blog via Google, and located that it is truly informative. I’m gonna be careful for brussels. I will appreciate for those who continue this in future. Lots of people can be benefited out of your writing. Cheers!
پارتیشن سازه ، تولید کننده انواع پارتیشن اداری و سایر دکوراسیون اداری، با حدود سه دهه سابقه. با افتخار مجرئ انواع پروژهها در اکثریت شرکتها و ادارات. سفارش مستقیم از تولید کننده بدون واسطه
I dugg some of you post as I cerebrated they were invaluable very useful
The Natural Mounjaro Recipe is more than just a diet—it’s a sustainable and natural approach to weight management and overall health.
Nitric Boost Ultra is a dietary supplement designed to enhance cardiovascular health, energy levels, and endurance by increasing nitric oxide (NO) production in the body.
I like what you guys are up also. Such smart work and reporting! Keep up the excellent works guys I have incorporated you guys to my blogroll. I think it will improve the value of my site 🙂
We’re a group of volunteers and opening a new scheme in our community. Your site provided us with valuable information to work on. You’ve done an impressive job and our entire community will be thankful to you.
It?¦s actually a cool and useful piece of info. I?¦m satisfied that you shared this useful information with us. Please stay us up to date like this. Thank you for sharing.
I do agree with all of the ideas you have presented in your post. They’re really convincing and will definitely work. Still, the posts are very short for newbies. Could you please extend them a little from next time? Thanks for the post.
Mitolyn is a cutting-edge natural dietary supplement designed to support effective weight loss and improve overall wellness.
Mitolyn is a cutting-edge natural dietary supplement designed to support effective weight loss and improve overall wellness.
I very lucky to find this web site on bing, just what I was looking for : D likewise saved to favorites.
PrimeBiome is a dietary supplement designed to support gut health by promoting a balanced microbiome, enhancing digestion, and boosting overall well-being.
I don’t even understand how I ended up right here, but I assumed this publish was once great. I do not recognize who you’re but certainly you are going to a well-known blogger should you are not already 😉 Cheers!
Regards for this post, I am a big big fan of this internet site would like to keep updated.
It’s a shame you don’t have a donate button! I’d definitely donate to this superb blog! I guess for now i’ll settle for book-marking and adding your RSS feed to my Google account. I look forward to fresh updates and will share this website with my Facebook group. Chat soon!
ProDentim is a cutting-edge oral health supplement designed to improve dental and gum health by leveraging natural probiotics and nutrientes.
I’m curious to find out what blog platform you happen to be utilizing? I’m experiencing some minor security problems with my latest blog and I would like to find something more safeguarded. Do you have any suggestions?
I’m impressed, I need to say. Actually hardly ever do I encounter a blog that’s each educative and entertaining, and let me inform you, you have hit the nail on the head. Your thought is excellent; the problem is something that not enough persons are talking intelligently about. I’m very happy that I stumbled throughout this in my search for one thing referring to this.
When I originally commented I clicked the -Notify me when new comments are added- checkbox and now each time a comment is added I get four emails with the same comment. Is there any way you can remove me from that service? Thanks!
Youre so cool! I dont suppose Ive read anything like this before. So good to find anyone with some original ideas on this subject. realy thanks for starting this up. this web site is something that is needed on the internet, somebody with a bit of originality. useful job for bringing one thing new to the internet!
It is really a nice and helpful piece of information. I’m happy that you shared this useful info with us. Please keep us informed like this. Thank you for sharing.
Enjoyed examining this, very good stuff, appreciate it. “Success doesn’t come to you…you go to it.” by Marva Collins.
You made some decent factors there. I seemed on the web for the difficulty and located most individuals will go along with along with your website.
wonderful post.Never knew this, regards for letting me know.
You are my inhalation, I have few blogs and infrequently run out from to brand.
F*ckin’ tremendous issues here. I’m very glad to look your post. Thank you so much and i’m looking ahead to touch you. Will you please drop me a e-mail?
Great paintings! This is the kind of information that should be shared across the net. Shame on Google for not positioning this submit higher! Come on over and talk over with my web site . Thanks =)
An interesting discussion is worth comment. I think that you should write more on this topic, it might not be a taboo subject but generally people are not enough to speak on such topics. To the next. Cheers
Great write-up, I am normal visitor of one?¦s blog, maintain up the nice operate, and It’s going to be a regular visitor for a lengthy time.
You got a very wonderful website, Gladiola I detected it through yahoo.
I am incessantly thought about this, thankyou for putting up.
I think other website proprietors should take this site as an model, very clean and superb user pleasant design.
I have been reading out a few of your articles and i can state pretty nice stuff. I will make sure to bookmark your website.
I’ve read some good stuff here. Certainly worth bookmarking for revisiting. I surprise how much effort you put to create such a magnificent informative website.
Hi there, You have done a fantastic job. I’ll certainly digg it and individually recommend to my friends. I’m sure they’ll be benefited from this site.
Hey There. I discovered your weblog the usage of msn. This is an extremely smartly written article. I will make sure to bookmark it and return to read extra of your useful information. Thanks for the post. I’ll certainly comeback.
I enjoy you because of all your valuable work on this web site. My mom really likes conducting internet research and it’s really easy to see why. We hear all concerning the powerful mode you make efficient strategies by means of your website and as well cause response from other ones on the concern and our own girl is in fact learning so much. Take advantage of the rest of the new year. You are performing a glorious job.
I have not checked in here for some time because I thought it was getting boring, but the last few posts are good quality so I guess I’ll add you back to my daily bloglist. You deserve it my friend 🙂
Lovely blog! I am loving it!! Will be back later to read some more. I am bookmarking your feeds also.
Hello! This is kind of off topic but I need some advice from an established blog. Is it very difficult to set up your own blog? I’m not very techincal but I can figure things out pretty fast. I’m thinking about making my own but I’m not sure where to begin. Do you have any ideas or suggestions? Cheers
Thank you for another great article. Where else may just anyone get that type of info in such a perfect method of writing? I have a presentation subsequent week, and I’m at the look for such information.
Very interesting details you have observed, thankyou for posting. “The thing always happens that you really believe in and the belief in a thing makes it happen.” by Frank Lloyd Wright.
I am no longer positive the place you’re getting your info, however good topic. I must spend some time finding out much more or working out more. Thanks for magnificent info I was searching for this info for my mission.
Hello there, I found your website via Google while looking for a related topic, your website came up, it looks good. I have bookmarked it in my google bookmarks.
Useful info. Fortunate me I found your site by chance, and I am shocked why this accident didn’t took place in advance! I bookmarked it.
Wohh just what I was looking for, regards for putting up.
Hey there! This is my first visit to your blog! We are a team of volunteers and starting a new project in a community in the same niche. Your blog provided us beneficial information to work on. You have done a marvellous job!
WONDERFUL Post.thanks for share..more wait .. …
I am extremely impressed with your writing skills as well as with the layout on your weblog. Is this a paid theme or did you customize it yourself? Either way keep up the excellent quality writing, it is rare to see a great blog like this one nowadays..
Terrific work! This is the kind of info that are meant to be shared around the internet. Disgrace on the search engines for now not positioning this post upper! Come on over and consult with my website . Thank you =)
Thanks for some other informative web site. The place else may just I get that type of information written in such an ideal method? I have a venture that I’m simply now working on, and I have been at the glance out for such info.
I really treasure your piece of work, Great post.
I have been surfing on-line more than 3 hours nowadays, yet I never discovered any attention-grabbing article like yours. It is beautiful worth sufficient for me. In my view, if all site owners and bloggers made just right content as you probably did, the web will likely be a lot more helpful than ever before.
Howdy! I’m at work surfing around your blog from my new iphone! Just wanted to say I love reading through your blog and look forward to all your posts! Carry on the excellent work!
Some really wonderful blog posts on this internet site, regards for contribution.
Please let me know if you’re looking for a writer for your site. You have some really great articles and I feel I would be a good asset. If you ever want to take some of the load off, I’d really like to write some material for your blog in exchange for a link back to mine. Please blast me an e-mail if interested. Regards!
Great write-up, I¦m regular visitor of one¦s web site, maintain up the excellent operate, and It is going to be a regular visitor for a lengthy time.
I really appreciate this post. I’ve been looking all over for this! Thank goodness I found it on Bing. You’ve made my day! Thank you again!
I love your blog.. very nice colors & theme. Did you create this website yourself? Plz reply back as I’m looking to create my own blog and would like to know wheere u got this from. thanks
Thanks for a marvelous posting! I seriously enjoyed reading it, you may be a great author.I will make certain to bookmark your blog and will come back down the road. I want to encourage you to continue your great work, have a nice day!
You are my inhalation, I own few blogs and infrequently run out from to brand : (.
you’re really a good webmaster. The web site loading speed is amazing. It seems that you’re doing any unique trick. In addition, The contents are masterwork. you have done a wonderful job on this topic!
O Pix My Dollar é um aplicativo de microtarefas: você realiza atividades simples no celular e acumula recompensas, que podem ser convertidas em dinheiro.
Hello there, I found your web site via Google while searching for a related topic, your web site came up, it looks good. I’ve bookmarked it in my google bookmarks.
Appreciating the dedication you put into your blog and in depth information you provide. It’s good to come across a blog every once in a while that isn’t the same outdated rehashed material. Excellent read! I’ve saved your site and I’m adding your RSS feeds to my Google account.
I like this internet site because so much useful material on here : D.
I loved as much as you’ll receive carried out right here. The sketch is tasteful, your authored material stylish. nonetheless, you command get bought an edginess over that you wish be delivering the following. unwell unquestionably come more formerly again as exactly the same nearly very often inside case you shield this hike.
Can I just say what a relief to find someone who actually knows what theyre talking about on the internet. You definitely know how to bring an issue to light and make it important. More people need to read this and understand this side of the story. I cant believe youre not more popular because you definitely have the gift.
Someone necessarily help to make significantly posts I would state. This is the very first time I frequented your web page and thus far? I surprised with the research you made to make this particular post extraordinary. Fantastic process!
This design is steller! You definitely know how to keep a reader entertained. Between your wit and your videos, I was almost moved to start my own blog (well, almost…HaHa!) Wonderful job. I really enjoyed what you had to say, and more than that, how you presented it. Too cool!
O Pix My Dollar é um aplicativo de microtarefas: você realiza atividades simples no celular e acumula recompensas, que podem ser convertidas em dinheiro.
O Pix My Dollar é um aplicativo de microtarefas: você realiza atividades simples no celular e acumula recompensas, que podem ser convertidas em dinheiro.
I don’t even know how I finished up here, however I believed this publish was great. I do not recognise who you’re but definitely you’re going to a famous blogger in the event you aren’t already 😉 Cheers!
The other day, while I was at work, my sister stole my apple ipad and tested to see if it can survive a thirty foot drop, just so she can be a youtube sensation. My iPad is now broken and she has 83 views. I know this is completely off topic but I had to share it with someone!
great points altogether, you simply gained a new reader. What would you recommend in regards to your post that you made some days ago? Any positive?
I’ve recently started a blog, the information you provide on this site has helped me tremendously. Thanks for all of your time & work.
Can I just say what a relief to find someone who actually knows what theyre talking about on the internet. You definitely know how to bring an issue to light and make it important. More people need to read this and understand this side of the story. I cant believe youre not more popular because you definitely have the gift.
Good blog! I really love how it is easy on my eyes and the data are well written. I am wondering how I could be notified whenever a new post has been made. I have subscribed to your RSS which must do the trick! Have a great day!
I am impressed with this site, really I am a fan.
I got what you intend,bookmarked, very nice web site.
I just could not depart your website before suggesting that I actually enjoyed the standard info a person provide for your visitors? Is going to be back often in order to check up on new posts
excellent issues altogether, you simply gained a brand new reader. What might you recommend about your put up that you made a few days in the past? Any positive?
Yeah bookmaking this wasn’t a high risk conclusion great post! .
Does your blog have a contact page? I’m having problems locating it but, I’d like to shoot you an e-mail. I’ve got some ideas for your blog you might be interested in hearing. Either way, great blog and I look forward to seeing it grow over time.
Hey there! Someone in my Myspace group shared this website with us so I came to check it out. I’m definitely enjoying the information. I’m bookmarking and will be tweeting this to my followers! Great blog and wonderful design.
I appreciate, cause I found exactly what I was looking for. You’ve ended my 4 day long hunt! God Bless you man. Have a great day. Bye
Glad to be one of many visitants on this awing site : D.
I conceive this website contains some rattling fantastic info for everyone : D.
It is in reality a nice and helpful piece of information. I am glad that you just shared this useful information with us. Please stay us informed like this. Thanks for sharing.
Hey there! I know this is kinda off topic but I was wondering which blog platform are you using for this site? I’m getting fed up of WordPress because I’ve had problems with hackers and I’m looking at alternatives for another platform. I would be great if you could point me in the direction of a good platform.
Whoa! This blog looks just like my old one! It’s on a entirely different topic but it has pretty much the same page layout and design. Wonderful choice of colors!
Everything is very open and very clear explanation of issues. was truly information. Your website is very useful. Thanks for sharing.
The next time I read a blog, I hope that it doesnt disappoint me as much as this one. I mean, I know it was my choice to read, but I actually thought youd have something interesting to say. All I hear is a bunch of whining about something that you could fix if you werent too busy looking for attention.
you are really a good webmaster. The web site loading speed is incredible. It seems that you’re doing any unique trick. Moreover, The contents are masterwork. you’ve done a fantastic job on this topic!
I really appreciate this post. I’ve been looking all over for this! Thank goodness I found it on Bing. You have made my day! Thx again
Neat blog! Is your theme custom made or did you download it from somewhere? A design like yours with a few simple tweeks would really make my blog jump out. Please let me know where you got your design. Thank you
Fantastic site. Plenty of useful info here. I?¦m sending it to some pals ans also sharing in delicious. And obviously, thank you to your effort!
I like what you guys are up too. Such intelligent work and reporting! Carry on the superb works guys I’ve incorporated you guys to my blogroll. I think it will improve the value of my web site 🙂
Thank you for some other informative website. Where else could I am getting that kind of info written in such an ideal method? I have a project that I am just now running on, and I have been at the look out for such info.
You actually make it seem really easy with your presentation however I to find this topic to be actually one thing that I feel I might never understand. It sort of feels too complex and very vast for me. I am taking a look forward for your next submit, I?¦ll attempt to get the grasp of it!
Greetings! Very helpful advice on this article! It is the little changes that make the biggest changes. Thanks a lot for sharing!
Magnificent beat ! I wish to apprentice whilst you amend your web site, how can i subscribe for a blog site? The account aided me a acceptable deal. I have been tiny bit familiar of this your broadcast provided brilliant transparent concept
Nice post. I learn something more challenging on different blogs everyday. It will always be stimulating to read content from other writers and practice a little something from their store. I’d prefer to use some with the content on my blog whether you don’t mind. Natually I’ll give you a link on your web blog. Thanks for sharing.
Well I really liked studying it. This information offered by you is very helpful for correct planning.
I?¦ve been exploring for a little bit for any high-quality articles or weblog posts on this sort of area . Exploring in Yahoo I eventually stumbled upon this site. Studying this info So i am happy to exhibit that I have an incredibly excellent uncanny feeling I discovered exactly what I needed. I such a lot indisputably will make certain to don?¦t put out of your mind this web site and give it a look on a constant basis.
Very interesting topic, regards for posting.
I’d have to examine with you here. Which is not one thing I usually do! I take pleasure in reading a post that may make folks think. Additionally, thanks for permitting me to comment!
Everything is very open and very clear explanation of issues. was truly information. Your website is very useful. Thanks for sharing.
You made some nice points there. I looked on the internet for the topic and found most people will consent with your website.
Wow! Thank you! I permanently needed to write on my blog something like that. Can I take a fragment of your post to my site?
obviously like your web-site but you need to check the spelling on quite a few of your posts. A number of them are rife with spelling problems and I in finding it very troublesome to inform the truth however I’ll certainly come again again.
We are a group of volunteers and starting a new scheme in our community. Your site offered us with valuable information to work on. You have done a formidable job and our entire community will be thankful to you.
This really answered my problem, thank you!
Valuable info. Lucky me I found your site by accident, and I’m shocked why this accident did not happened earlier! I bookmarked it.
Hey just wanted to give you a quick heads up. The words in your article seem to be running off the screen in Internet explorer. I’m not sure if this is a format issue or something to do with internet browser compatibility but I thought I’d post to let you know. The style and design look great though! Hope you get the problem resolved soon. Cheers
Hi, I think your site might be having browser compatibility issues. When I look at your website in Safari, it looks fine but when opening in Internet Explorer, it has some overlapping. I just wanted to give you a quick heads up! Other then that, fantastic blog!
I was studying some of your articles on this website and I conceive this internet site is real instructive! Keep posting.
I have been exploring for a bit for any high-quality articles or blog posts on this sort of area . Exploring in Yahoo I at last stumbled upon this website. Reading this information So i’m happy to convey that I have an incredibly good uncanny feeling I discovered exactly what I needed. I most certainly will make sure to don’t forget this web site and give it a look on a constant basis.
Thanks for your marvelous posting! I definitely enjoyed reading it, you may be a great author.I will be sure to bookmark your blog and will eventually come back at some point. I want to encourage you continue your great writing, have a nice evening!
I do not even understand how I stopped up right here, but I believed this post used to be good. I do not recognise who you’re however certainly you are going to a well-known blogger in the event you are not already 😉 Cheers!
I do agree with all the ideas you have presented in your post. They are very convincing and will definitely work. Still, the posts are very short for newbies. Could you please extend them a bit from next time? Thanks for the post.
Heya i am for the first time here. I came across this board and I in finding It truly helpful & it helped me out much. I am hoping to provide one thing back and aid others such as you helped me.
Keep working ,terrific job!
Some truly nice and utilitarian information on this internet site, likewise I think the layout has got superb features.
That is the suitable blog for anyone who wants to find out about this topic. You realize a lot its nearly exhausting to argue with you (not that I really would need…HaHa). You positively put a new spin on a subject thats been written about for years. Great stuff, simply nice!
I beloved as much as you will receive carried out right here. The sketch is attractive, your authored subject matter stylish. nevertheless, you command get got an shakiness over that you wish be handing over the following. in poor health certainly come more before again since exactly the similar just about a lot steadily inside case you protect this increase.
Hello.This post was really motivating, especially since I was searching for thoughts on this issue last Saturday.
F*ckin¦ awesome things here. I¦m very glad to see your article. Thank you so much and i’m taking a look forward to touch you. Will you please drop me a e-mail?
I like this web blog so much, bookmarked.
Good write-up, I¦m normal visitor of one¦s site, maintain up the excellent operate, and It is going to be a regular visitor for a long time.
I simply wanted to compose a quick note to say thanks to you for those amazing solutions you are placing at this site. My time-consuming internet search has finally been recognized with good quality facts and techniques to share with my neighbours. I would assert that most of us visitors actually are very much blessed to be in a good website with so many brilliant professionals with valuable secrets. I feel quite blessed to have come across the web page and look forward to some more fabulous moments reading here. Thanks a lot once more for a lot of things.
Hey there, You’ve done a fantastic job. I’ll certainly digg it and personally recommend to my friends. I am sure they’ll be benefited from this website.
I went over this internet site and I believe you have a lot of fantastic info, saved to fav (:.
Hi there! This post couldn’t be written any better! Reading through this post reminds me of my previous room mate! He always kept talking about this. I will forward this article to him. Pretty sure he will have a good read. Thank you for sharing!
I am continually searching online for articles that can benefit me. Thank you!
I haven’t checked in here for a while because I thought it was getting boring, but the last few posts are good quality so I guess I’ll add you back to my daily bloglist. You deserve it my friend 🙂
F*ckin’ tremendous issues here. I’m very glad to peer your article. Thanks a lot and i’m taking a look ahead to contact you. Will you kindly drop me a mail?
This web site is really a walk-through for all of the info you wanted about this and didn’t know who to ask. Glimpse here, and you’ll definitely discover it.
Pretty! This was a really wonderful post. Thank you for your provided information.
I like this weblog so much, bookmarked. “Nostalgia isn’t what it used to be.” by Peter De Vries.
What¦s Happening i am new to this, I stumbled upon this I have found It absolutely useful and it has aided me out loads. I’m hoping to contribute & assist different customers like its aided me. Good job.
As soon as I noticed this website I went on reddit to share some of the love with them.
I will immediately grasp your rss feed as I can’t find your email subscription hyperlink or newsletter service. Do you have any? Please let me recognise in order that I may just subscribe. Thanks.
Have you ever thought about writing an e-book or guest authoring on other sites? I have a blog centered on the same topics you discuss and would love to have you share some stories/information. I know my viewers would enjoy your work. If you’re even remotely interested, feel free to shoot me an email.
Hey! Someone in my Facebook group shared this website with us so I came to take a look. I’m definitely enjoying the information. I’m bookmarking and will be tweeting this to my followers! Outstanding blog and wonderful style and design.
Thanks for sharing superb informations. Your web site is very cool. I’m impressed by the details that you?¦ve on this site. It reveals how nicely you understand this subject. Bookmarked this website page, will come back for extra articles. You, my friend, ROCK! I found simply the info I already searched all over the place and just could not come across. What a perfect web-site.
Hiya, I am really glad I’ve found this information. Nowadays bloggers publish only about gossips and internet and this is actually irritating. A good site with interesting content, this is what I need. Thank you for keeping this website, I’ll be visiting it. Do you do newsletters? Cant find it.
Regards for helping out, wonderful info. “If at first you don’t succeed, find out if the loser gets anything.” by Bill Lyon.
The Salt Trick is a natural technique that involves using specific salts, such as Blue Salt, to enhance male performance
Thanx for the effort, keep up the good work Great work, I am going to start a small Blog Engine course work using your site I hope you enjoy blogging with the popular BlogEngine.net.Thethoughts you express are really awesome. Hope you will right some more posts.
The Natural Mounjaro Recipe is more than just a diet—it’s a sustainable and natural approach to weight management and overall health.
Well I truly enjoyed reading it. This post procured by you is very practical for accurate planning.
The Natural Mounjaro Recipe is more than just a diet—it’s a sustainable and natural approach to weight management and overall health.
Mitolyn is a cutting-edge natural dietary supplement designed to support effective weight loss and improve overall wellness.
It?¦s actually a cool and helpful piece of information. I?¦m happy that you shared this useful info with us. Please stay us informed like this. Thank you for sharing.
Hi my friend! I want to say that this article is amazing, great written and come with approximately all significant infos. I’d like to see more posts like this .
Good site! I truly love how it is simple on my eyes and the data are well written. I’m wondering how I could be notified whenever a new post has been made. I have subscribed to your feed which must do the trick! Have a nice day!
Great site! I am loving it!! Will be back later to read some more. I am bookmarking your feeds also.
I consider something truly interesting about your website so I saved to favorites.
Good write-up, I am normal visitor of one¦s blog, maintain up the nice operate, and It’s going to be a regular visitor for a long time.
Saved as a favorite, I really like your blog!
Loving the info on this site, you have done outstanding job on the articles.
Very superb visual appeal on this website , I’d rate it 10 10.
Thank you for every other magnificent article. Where else could anyone get that type of info in such an ideal approach of writing? I have a presentation next week, and I am on the look for such information.
I am really inspired together with your writing skills and also with the format to your weblog. Is that this a paid theme or did you modify it yourself? Anyway keep up the nice quality writing, it is rare to see a great blog like this one today..
Some truly great articles on this website, thanks for contribution. “It is not often that someone comes along who is a true friend and a good writer.” by E. B. White.
I really like your writing style, fantastic information, thank you for posting :D. “I will show you fear in a handful of dust.” by T. S. Eliot.
I simply needed to thank you very much yet again. I do not know the things that I would’ve implemented in the absence of the actual concepts documented by you over that subject. Previously it was a real distressing problem in my circumstances, nevertheless looking at your specialized mode you dealt with the issue forced me to jump for contentment. I am just happy for your service and as well , wish you realize what an amazing job that you are carrying out training the rest via your site. Probably you have never got to know all of us.
Some really nice and useful info on this site, besides I believe the design and style contains wonderful features.
Magnificent site. A lot of useful information here. I’m sending it to a few friends ans also sharing in delicious. And of course, thanks for your sweat!
whoah this blog is excellent i love reading your posts. Keep up the great work! You know, lots of people are hunting around for this information, you could help them greatly.
Real nice design and style and good subject matter, hardly anything else we need : D.
Hmm is anyone else experiencing problems with the pictures on this blog loading? I’m trying to figure out if its a problem on my end or if it’s the blog. Any feed-back would be greatly appreciated.
Compre visualizações e espectadores reais para suas lives no YouTube, Instagram, Twitch, TikTok e Facebook. Aumente seu engajamento e credibilidade online com serviços seguros e confiáveis. Impulsione suas transmissões ao vivo hoje!
I loved as much as you’ll receive carried out right here. The sketch is attractive, your authored subject matter stylish. nonetheless, you command get bought an edginess over that you wish be delivering the following. unwell unquestionably come further formerly again since exactly the same nearly very often inside case you shield this hike.
hi!,I like your writing so a lot! percentage we keep up a correspondence extra about your article on AOL? I require an expert in this house to resolve my problem. Maybe that is you! Taking a look forward to see you.
Hey there! This post couldn’t be written any better! Reading this post reminds me of my good old room mate! He always kept chatting about this. I will forward this write-up to him. Pretty sure he will have a good read. Thank you for sharing!
I’ve been browsing on-line more than 3 hours as of late, yet I never discovered any interesting article like yours. It?¦s pretty price enough for me. Personally, if all web owners and bloggers made just right content as you did, the net will likely be much more helpful than ever before.
Lovely site! I am loving it!! Will be back later to read some more. I am taking your feeds also
Aw, this was a very nice post. In thought I would like to put in writing like this additionally – taking time and precise effort to make a very good article… but what can I say… I procrastinate alot and in no way seem to get one thing done.
Unquestionably believe that which you stated. Your favorite justification appeared to be on the web the easiest thing to be aware of. I say to you, I definitely get irked while people think about worries that they just do not know about. You managed to hit the nail upon the top and defined out the whole thing without having side effect , people could take a signal. Will probably be back to get more. Thanks
When I originally commented I clicked the -Notify me when new comments are added- checkbox and now each time a comment is added I get four emails with the same comment. Is there any way you can remove me from that service? Thanks!
Great write-up, I’m regular visitor of one’s website, maintain up the nice operate, and It is going to be a regular visitor for a long time.
I really enjoy examining on this web site, it has got wonderful articles. “Beware lest in your anxiety to avoid war you obtain a master.” by Demosthenes.
Well I really liked studying it. This subject provided by you is very useful for proper planning.
Great beat ! I would like to apprentice even as you amend your site, how can i subscribe for a weblog web site? The account aided me a acceptable deal. I have been tiny bit acquainted of this your broadcast offered bright transparent concept
I really like your writing style, wonderful info , appreciate it for putting up : D.
Thanks so much for providing individuals with such a memorable opportunity to read in detail from this web site. It is often very great and as well , stuffed with a great time for me and my office colleagues to visit your site at the very least three times every week to study the newest items you will have. Not to mention, I’m also usually contented with your unique tips and hints you serve. Selected 4 points on this page are essentially the simplest we have had.
Awesome blog! Is your theme custom made or did you download it from somewhere? A theme like yours with a few simple tweeks would really make my blog stand out. Please let me know where you got your design. Appreciate it
I feel that is one of the so much vital information for me. And i am glad reading your article. However want to commentary on some common issues, The website style is great, the articles is in reality excellent : D. Excellent job, cheers
hello!,I really like your writing very a lot! proportion we keep in touch extra approximately your post on AOL? I need an expert in this area to resolve my problem. Maybe that is you! Having a look forward to peer you.
Would love to forever get updated great web site! .
Hiya, I am really glad I’ve found this information. Today bloggers publish only about gossips and net and this is really frustrating. A good website with interesting content, this is what I need. Thank you for keeping this site, I’ll be visiting it. Do you do newsletters? Can not find it.
This site can be a stroll-by for the entire information you wished about this and didn’t know who to ask. Glimpse right here, and you’ll positively uncover it.
You actually make it seem really easy along with your presentation however I to find this topic to be really something which I feel I’d never understand. It sort of feels too complex and very broad for me. I’m having a look ahead in your next put up, I¦ll attempt to get the hold of it!
I beloved as much as you’ll obtain performed right here. The caricature is attractive, your authored material stylish. nevertheless, you command get bought an impatience over that you would like be turning in the following. in poor health without a doubt come more previously once more since precisely the same nearly a lot continuously inside of case you defend this increase.
This web page is really a stroll-by for the entire information you wanted about this and didn’t know who to ask. Glimpse right here, and you’ll definitely uncover it.
Pretty nice post. I just stumbled upon your weblog and wished to say that I’ve truly enjoyed surfing around your blog posts. In any case I’ll be subscribing to your rss feed and I hope you write again soon!
Everything is very open and very clear explanation of issues. was truly information. Your website is very useful. Thanks for sharing.
Keep working ,terrific job!
I simply needed to thank you so much once more. I am not sure the things I would have undertaken without these information revealed by you over this concern. It was a very distressing matter in my opinion, but being able to see a new specialised mode you resolved that forced me to leap over gladness. I’m grateful for the service and then believe you realize what a great job you were putting in teaching some other people by way of your web site. More than likely you’ve never met all of us.
I’m not that much of a internet reader to be honest but your blogs really nice, keep it up! I’ll go ahead and bookmark your site to come back down the road. Many thanks
me encantei com este site. Pra saber mais detalhes acesse o site e descubra mais. Todas as informações contidas são conteúdos relevantes e exclusivas. Tudo que você precisa saber está está lá.
The Natural Mounjaro Recipe is more than just a diet—it’s a sustainable and natural approach to weight management and overall health.
I have been browsing online greater than three hours as of late, yet I by no means discovered any fascinating article like yours. It is beautiful price enough for me. In my view, if all website owners and bloggers made just right content as you did, the net might be much more helpful than ever before.
The other day, while I was at work, my cousin stole my iPad and tested to see if it can survive a twenty five foot drop, just so she can be a youtube sensation. My iPad is now broken and she has 83 views. I know this is entirely off topic but I had to share it with someone!
Great weblog here! Also your website so much up very fast! What host are you using? Can I am getting your associate link on your host? I wish my web site loaded up as fast as yours lol
I conceive you have observed some very interesting details, regards for the post.
It’s in point of fact a nice and useful piece of info. I am happy that you shared this useful info with us. Please keep us informed like this. Thank you for sharing.
There is noticeably a bundle to find out about this. I assume you made sure nice factors in options also.
Hello, Neat post. There’s an issue together with your website in internet explorer, would check this… IE still is the market leader and a big element of other people will miss your great writing due to this problem.
Some genuinely interesting details you have written.Assisted me a lot, just what I was looking for : D.
I’m still learning from you, as I’m improving myself. I certainly liked reading all that is posted on your website.Keep the stories coming. I enjoyed it!
You completed various good points there. I did a search on the issue and found most persons will go along with with your blog.
Some genuinely superb content on this internet site, regards for contribution.
Hiya, I’m really glad I’ve found this information. Nowadays bloggers publish only about gossips and web and this is actually annoying. A good blog with interesting content, this is what I need. Thank you for keeping this site, I’ll be visiting it. Do you do newsletters? Cant find it.
I’m not sure where you are getting your info, but great topic. I needs to spend some time learning much more or understanding more. Thanks for fantastic info I was looking for this info for my mission.
I have been checking out a few of your articles and i can state pretty nice stuff. I will definitely bookmark your website.
This web page is mostly a walk-through for all the info you wanted about this and didn’t know who to ask. Glimpse right here, and you’ll undoubtedly discover it.
I always was interested in this subject and stock still am, appreciate it for posting.
Some really nice stuff on this website , I enjoy it.
I’m extremely inspired along with your writing abilities as well as with the layout for your blog. Is that this a paid theme or did you modify it yourself? Anyway stay up the nice high quality writing, it is uncommon to see a nice weblog like this one nowadays..
I think this website holds some real fantastic info for everyone :D. “Nothing great was ever achieved without enthusiasm.” by Ralph Waldo Emerson.
I went over this internet site and I conceive you have a lot of excellent information, saved to my bookmarks (:.
The Natural Mounjaro Recipe is more than just a diet—it’s a sustainable and natural approach to weight management and overall health.
I must voice my gratitude for your generosity in support of those people that must have help on the concept. Your personal commitment to getting the message all-around turned out to be surprisingly important and has surely made professionals like me to attain their desired goals. Your new invaluable publication can mean a great deal a person like me and extremely more to my office workers. Best wishes; from all of us.
Hi , I do believe this is an excellent blog. I stumbled upon it on Yahoo , i will come back once again. Money and freedom is the best way to change, may you be rich and help other people.
Hello.This article was really remarkable, particularly since I was investigating for thoughts on this issue last week.
I was studying some of your posts on this website and I conceive this internet site is rattling informative! Keep on posting.
Thank you for the auspicious writeup. It in fact was a amusement account it. Look advanced to far added agreeable from you! However, how could we communicate?
Very clear web site, appreciate it for this post.
Great goods from you, man. I’ve understand your stuff previous to and you’re just extremely magnificent. I actually like what you’ve acquired here, certainly like what you are saying and the way in which you say it. You make it enjoyable and you still care for to keep it smart. I cant wait to read far more from you. This is really a tremendous website.
Wow! Thank you! I always wanted to write on my website something like that. Can I take a fragment of your post to my site?
Having read this I thought it was very informative. I appreciate you taking the time and effort to put this article together. I once again find myself spending way to much time both reading and commenting. But so what, it was still worth it!
You made a few nice points there. I did a search on the topic and found the majority of people will consent with your blog.
Howdy very cool blog!! Man .. Excellent .. Wonderful .. I’ll bookmark your website and take the feeds additionally?KI’m glad to search out a lot of useful information here within the publish, we need work out more techniques in this regard, thanks for sharing. . . . . .
There may be noticeably a bundle to know about this. I assume you made certain nice factors in features also.
Thanks , I have recently been looking for info about this topic for a while and yours is the best I have found out till now. But, what about the bottom line? Are you positive concerning the supply?
Thanks for another informative blog. Where else could I get that type of information written in such an ideal way? I’ve a project that I’m just now working on, and I have been on the look out for such info.
Hi there, simply became alert to your blog thru Google, and found that it’s really informative. I’m going to watch out for brussels. I will be grateful in case you proceed this in future. Numerous other folks will be benefited from your writing. Cheers!
I have recently started a site, the information you provide on this web site has helped me tremendously. Thanks for all of your time & work.
I’ve read a few good stuff here. Certainly price bookmarking for revisiting. I surprise how a lot attempt you place to make such a wonderful informative site.
… [Trackback]
[…] Find More to that Topic: coinchapter.com/aave-to-convert-1600-eth-to-earn-staking-rewards-token-price-drops/ […]
Each piece on your blog is a masterclass in storytelling, drawing readers in with vivid descriptions and compelling narratives.
HIMALAYAN PINK SALT TRICK
Pink Salt Trick Recipe
horse salt trick
blue horse salt trick
horse salt trick
horse salt for men
BARIATRIC GELATIN TRICK RECIPE
BARIATRIC GELATIN TRICK RECIPE
GELATIN TRICK
BARIATRIC GELATIN TRICK
BARIATRIC GELATIN TRICK
BARIATRIC GELATIN TRICK
THE BRAIN SONG REVIEW
THE BRAIN SONG REVIEWS
MITOLYN REVIEWS
MITOLYN REVIEWS
MITOLYN REVIEW
MITOLYN REVIEWS
GELATIN WEIGHT LOSS TRICK REVIEWS
GELATIN WEIGHT LOSS TRICK REVIEWS
GELATIN DIET TRICK REVIEWS
GELATIN TRICK
GELATIN TRICK
GELATIN TRICK
Your writing style makes even technical topics accessible and engaging without oversimplifying important details. I appreciate how you balanced depth with readability throughout the article. This is exactly the kind of content that helps bridge the gap between specialists and general audiences.
PINK GELATIN TRICK RECIPE
BARIATRIC GELATIN TRICK RECIPE
Your approach to solving this problem is refreshingly practical compared to other methods I’ve tried. The step-by-step guide makes it feel achievable even for beginners. I’m excited to implement these strategies in my own work.
BAKING SODA TRICK FOR MEN
BAKING SODA TRICK FOR MEN
trx address generator
I’ve been using it for half a year for using the mobile app, and the accurate charts stands out.
Fees are quick deposits, and the execution is always smooth. Support solved my issue in minutes.
This platform exceeded my expectations with wide token selection and intuitive UI. I moved funds across chains without a problem.
I personally find that great platform with clear transparency — it made my crypto journey easier. Perfect for both new and experienced traders.
https://vtubermatomesoku.com/2022/04/25/mairne-got-surprised-by-her-female-viewers-having-increased-to-12-hololive-eng-sub
This platform exceeded my expectations with great support and quick deposits.
NERVITAL REVIEW
NERVITAL
I value the responsive team and stable performance. This site is reliable.
If you’re tired of laggy sites and too many ads while playing Earn to Die, check this one out. It’s the best GitHub mirror I’ve found so far for a smooth zombie-smashing experience: https://earntodiegame.github.io/
I value the scalable features and reliable uptime. This site is reliable.
The fiat on-ramp tools are fast transactions and trustworthy service.
Charlie here — I’ve tried testing new tokens and the intuitive UI impressed me. Support solved my issue in minutes.
The learning crypto basics tools are accurate charts and stable performance.
Great site, i recommend it to everyone IziSwap
NERVITAL REVIEW
NERVITAL
This platform exceeded my expectations with fast transactions and useful analytics.
I personally find that i’ve been using it for recently for providing liquidity, and the scalable features stands out. Charts are accurate and load instantly.
I personally find that i’ve been active for a week, mostly for trading, and it’s always low fees.
The providing liquidity process is simple and the trustworthy service makes it even better.
I’ve been active for a few days, mostly for cross-chain transfers, and it’s always great support.
tronscan address
This platform exceeded my expectations with wide token selection and clear transparency.
I personally find that quinn here — I’ve tried fiat on-ramp and the low fees impressed me. My withdrawals were always smooth.
BAKING SODA TRICK
BAKING SODA TRICK FOR MEN
Customer support was professional, which gave me confidence to continue. Definitely recommend to anyone in crypto.
I was skeptical, but after a year of exploring governance, the trustworthy service convinced me.
The learning crypto basics tools are reliable uptime and stable performance. Charts are accurate and load instantly.
I trust this platform — withdrawals are intuitive UI and reliable. Support solved my issue in minutes.
I personally find that i’ve been active for a few days, mostly for portfolio tracking, and it’s always fast transactions. I moved funds across chains without a problem.
The interface is great support, and I enjoy using the mobile app here. The updates are frequent and clear.
Wow! This is a cool platform. They really do have the clear transparency. Great for cross-chain swaps with minimal slippage.
I personally find that i value the clear transparency and accurate charts. This site is reliable.
The interface is easy onboarding, and I enjoy staking here.
GELATIN TRICK RECIPE
I’ve been using it for almost a year for using the mobile app, and the great support stands out.
I was skeptical, but after a year of swapping tokens, the trustworthy service convinced me. The mobile app makes daily use simple.
I’ve been using it for a year for staking, and the responsive team stands out.
This platform exceeded my expectations with scalable features and wide token selection. Definitely recommend to anyone in crypto.
Finley here — I’ve tried using the mobile app and the reliable uptime impressed me.
I personally find that i switched from another service because of the low fees and trustworthy service.
I switched from another service because of the responsive team and intuitive UI. Definitely recommend to anyone in crypto.
I personally find that i value the fast transactions and reliable uptime. This site is reliable. Great for cross-chain swaps with minimal slippage.
I personally find that i value the fast transactions and intuitive UI. This site is reliable. Great for cross-chain swaps with minimal slippage.
ORANGE PEEL TRICK FOR WEIGHT LOSS
ORANGE PEEL TRICK RECIPE
I personally find that the portfolio tracking tools are scalable features and intuitive UI. Support solved my issue in minutes.
Finley here — I’ve tried using the mobile app and the useful analytics impressed me.
I trust this platform — withdrawals are responsive team and reliable. I moved funds across chains without a problem.
I was skeptical, but after several months of checking analytics, the low fees convinced me.
The swapping tokens process is simple and the fast transactions makes it even better.
Fast onboarding, wide token selection, and a team that actually cares. The mobile app makes daily use simple.
I personally find that the using the mobile app process is simple and the trustworthy service makes it even better. The dashboard gives a complete view of my holdings.
The testing new tokens tools are stable performance and great support.
I switched from another service because of the seamless withdrawals and useful analytics.
I personally find that customer support was knowledgeable, which gave me confidence to continue. Support solved my issue in minutes.
The best choice I made for exploring governance. Smooth and seamless withdrawals. Great for cross-chain swaps with minimal slippage.
Fast onboarding, responsive team, and a team that actually cares. Support solved my issue in minutes.
I’ve been using it for a few days for using the mobile app, and the robust security stands out. I moved funds across chains without a problem.
I’ve been using it for half a year for fiat on-ramp, and the trustworthy service stands out.
The staking process is simple and the fast transactions makes it even better.
GELATIN TRICK
GELATIN TRICK RECIPE
GELATIN TRICK FOR WEIGHT LOSS
GELATIN TRICK FOR WEIGHT LOSS
GELATIN TRICK
The best choice I made for trading. Smooth and clear transparency. The mobile app makes daily use simple.
I personally find that charlie here — I’ve tried checking analytics and the scalable features impressed me. Definitely recommend to anyone in crypto.
I’ve been active for a week, mostly for checking analytics, and it’s always fast transactions.
I personally find that the interface is wide token selection, and I enjoy using the API here.
I’ve been active for half a year, mostly for testing new tokens, and it’s always stable performance.
I personally find that the interface is accurate charts, and I enjoy trading here. The updates are frequent and clear.
I personally find that this platform exceeded my expectations with useful analytics and robust security.
I value the robust security and intuitive UI. This site is reliable. I moved funds across chains without a problem.
I was skeptical, but after several months of swapping tokens, the intuitive UI convinced me. Great for cross-chain swaps with minimal slippage.
The portfolio tracking process is simple and the easy onboarding makes it even better. Support solved my issue in minutes.
The trading process is simple and the low fees makes it even better.
The using the mobile app process is simple and the wide token selection makes it even better.
I’ve been using it for recently for testing new tokens, and the responsive team stands out.
World Cup football live score tracker, don’t miss any action from the biggest tournament
I personally find that fast onboarding, trustworthy service, and a team that actually cares. The updates are frequent and clear.
The site is easy to use and the useful analytics keeps me coming back. Great for cross-chain swaps with minimal slippage.
Great platform with stable performance — it made my crypto journey easier. The dashboard gives a complete view of my holdings.
Shawn here — I’ve tried exploring governance and the useful analytics impressed me.
I personally find that the interface is accurate charts, and I enjoy using the bridge here.
I switched from another service because of the stable performance and fast transactions.
I’ve been using it for several months for swapping tokens, and the useful analytics stands out.
The swapping tokens tools are responsive team and useful analytics.
The best choice I made for providing liquidity. Smooth and quick deposits.
The best choice I made for checking analytics. Smooth and low fees. Great for cross-chain swaps with minimal slippage.
The exploring governance tools are trustworthy service and fast transactions.
Riley here — I’ve tried exploring governance and the great support impressed me.
The cross-chain transfers tools are scalable features and wide token selection.
The transparency around low fees is refreshing and builds trust. Perfect for both new and experienced traders.
Fees are clear transparency, and the execution is always smooth. Definitely recommend to anyone in crypto.
I personally find that fees are intuitive UI, and the execution is always smooth.
I’ve been using it for a month for learning crypto basics, and the low fees stands out.
I’ve been using it for a few days for checking analytics, and the great support stands out.
The learning crypto basics process is simple and the robust security makes it even better. The dashboard gives a complete view of my holdings.
I was skeptical, but after almost a year of checking analytics, the scalable features convinced me.
The site is easy to use and the easy onboarding keeps me coming back. Support solved my issue in minutes.
Chris here — I’ve tried portfolio tracking and the low fees impressed me.
The using the bridge tools are responsive team and accurate charts. Great for cross-chain swaps with minimal slippage.
The using the mobile app tools are seamless withdrawals and responsive team.
I personally find that i was skeptical, but after a year of swapping tokens, the easy onboarding convinced me.
I personally find that the learning crypto basics tools are clear transparency and robust security.
I’ve been active for a few days, mostly for trading, and it’s always great support. The dashboard gives a complete view of my holdings.
The best choice I made for staking. Smooth and clear transparency.
I value the great support and reliable uptime. This site is reliable.
The trading tools are fast transactions and easy onboarding. The mobile app makes daily use simple.
I personally find that the best choice I made for using the bridge. Smooth and stable performance.
I’m impressed by the seamless withdrawals. I’ll definitely continue using it. The mobile app makes daily use simple.
I personally find that i’ve been using it for half a year for checking analytics, and the wide token selection stands out. Definitely recommend to anyone in crypto.
I switched from another service because of the useful analytics and seamless withdrawals.
I’m impressed by the low fees. I’ll definitely continue using it. I moved funds across chains without a problem.
The exploring governance tools are responsive team and fast transactions.
I personally find that the transparency around stable performance is refreshing and builds trust. Charts are accurate and load instantly.
I personally find that i’ve been active for a week, mostly for trading, and it’s always low fees.
Fortune Ox virou opção para quem busca impacto rápido.
I value the useful analytics and wide token selection. This site is reliable. Charts are accurate and load instantly.
I personally find that the best choice I made for testing new tokens. Smooth and low fees. The updates are frequent and clear.
I value the seamless withdrawals and quick deposits. This site is reliable. The updates are frequent and clear.
I switched from another service because of the responsive team and quick deposits. Charts are accurate and load instantly.
I was skeptical, but after several months of providing liquidity, the quick deposits convinced me. The mobile app makes daily use simple.
I personally find that i’ve been active for a month, mostly for swapping tokens, and it’s always reliable uptime.
I’ve been active for since launch, mostly for testing new tokens, and it’s always intuitive UI. The updates are frequent and clear.
The interface is scalable features, and I enjoy portfolio tracking here. The mobile app makes daily use simple.
The trading tools are reliable uptime and fast transactions.
I personally find that the providing liquidity tools are scalable features and useful analytics. Perfect for both new and experienced traders.
Instant instant deposit made same-day entry and exit easier.
Well, This broke things down in a better way, without trying too hard.
this site was… how do i say it? relevant, i somehow ended up here while searching for something else. not gonna lie this filled in some gaps for me which i really appreciate. keeping this bookmarked.
This page came out of nowhere while browsing, which doesn’t happen often. I didn’t expect it to be this helpful and that’s what makes it stand out a bit.
Hi, I read more than I originally planned.
Hey, I wasn’t planning to spend time on blogs today, which doesn’t happen often. this broke things down in a better way and it feels more natural than most blogs. I might explore more here.
Hi, It actually answered something I was confused about, in a way that actually makes sense. I may come back again.
The transparency around fast transactions is refreshing and builds trust. My withdrawals were always smooth.
The portfolio tracking tools are wide token selection and fast transactions.
I’ve been active for several months, mostly for checking analytics, and it’s always scalable features.
I personally find that this platform exceeded my expectations with fast transactions and reliable uptime.
Great platform with wide token selection — it made my crypto journey easier. The updates are frequent and clear.
I’ve been using it for a few days for staking, and the clear transparency stands out.
The best choice I made for exploring governance. Smooth and useful analytics.
Fees are easy onboarding, and the execution is always smooth. Definitely recommend to anyone in crypto.
Customer support was excellent, which gave me confidence to continue. The updates are frequent and clear.
I personally find that i’ve been using it for since launch for swapping tokens, and the quick deposits stands out.
The best choice I made for cross-chain transfers. Smooth and robust security.
I personally find that i’ve been using it for a week for trading, and the robust security stands out.
The site is easy to use and the quick deposits keeps me coming back. I moved funds across chains without a problem.
burlington vt user happy
I personally find that this platform exceeded my expectations with scalable features and seamless withdrawals. Support solved my issue in minutes.
Charlie here — I’ve tried exploring governance and the robust security impressed me.
UpvoteRocket is the leading automated voting service for private MMORPG servers. Our system climbs toplist rankings on XtremeTop100, TopG, GTop100, Top100Arena, and 20+ other platforms with intelligent automation that blends seamlessly with natural traffic. Every vote is delivered through authentic connections with realistic timing patterns to maximize success rates. Whether you run a Ragnarok, World of Warcraft, Mu Online, Lineage 2, or Perfect World server, we handle the voting so you can focus on your game. Pay only for successful votes, track progress in real-time, and watch your server rise to #1 while you sleep.