Key Takeaways:
- AI-related crypto tokens spiked following Nvidia stock hitting a new record high.
- However, three of the top 15 tokens reacted more aggressively.
- FET, AGIX, and RNDR prices registered impressive gains.

NEW DELHI (CoinChapter.com) — Crypto tokens associated with artificial intelligence projects went into a tizzy after graphics processing units (GPU) manufacturing firm Nvidia’s (NVDA) stock prices reached a new record high on Aug 22.
The surge resulted from the AI giant beating Wall Street expectations in its latest earnings report. Interestingly, the profits were largely from Nvidia’s AI unit, with revenue of its data center unit spiking by 171% YoY to reach $10.32 billion in Q2 2024.
The advent of crypto tools like ChatGPT created significant hype around the sector. Crypto AI tokens rode the hype to record massive gains in 2023.
Investors seemed convinced that crypto AI tokens might help them make millions in profits.
The Nvidia earnings report renewed investor interest in crypto AI tokens, with the sector’s market cap seeing a spike of nearly 3.7% over the past 24 hours to reach nearly $4.5 billion. Moreover, the 24-hour trading volume for the AI and big data-related tokens rose by 10.2% to reach $271.5 million (in writing).
However, of the top 15 AI-related crypto tokens, three tokens outperformed the others — SingularityNET (AGIX), Render Network (RNDR), and Fetch.AI (FET).
#1 AGIX Price Rally Faces EMA Resistance
SingularityNET, a blockchain platform that allows users to “create, share, and monetize” AI services, saw its native token AGIX’s coin price spike by nearly 17.5% since Aug 22 to form a daily high near $0.195 on Aug 24.
AGIX coin price rallied nearly 8.5% on Aug 24 before bears pared gains.
The SingularityNET token’s price rally stuttered after failing to move above its 20-day EMA (red wave) trendline, suggesting that bears are aggressively defending the dynamic resistance level. If the AGIX price rally stalls, the AI crypto token price might drop to the support near $0.177.

Moreover, sustained selling pressure could force AGIX coin to test the support level near $0.15 before recovering.
Bulls would need to flip the 20-day EMA resistance before forcing the AGIX price to reach its 50-day EMA (purple wave) resistance near $0.213 for the rally to continue.
Furthermore, breaking and consolidating the immediate resistance could help the SingularityNET token price target the 200-day EMA (green wave) resistance near $0.247 before retreating, jumping nearly 33% from current levels.
The RSI for AGIX remained neutral, with a value of 41.19 on the daily charts.
#2 FET Price Moving Inside A Bullish Technical Pattern
Fetch.AI is a blockchain-based AI platform that helps users automate everyday tasks using its tools, such as booking tickets. The native token of the platform is FET, whose prices have formed a bullish technical pattern called the ‘Falling Wedge.‘

In detail, the technical pattern forms when the price fluctuates inside a pair of falling trendlines that converge down the slope. The outcome of such downside patterns is typically a price breakout to the upside.
One key feature of the pattern is that volumes usually decline as the trendlines converge.
The upside target for the breakout is equal to the maximum distance between the falling wedge’s upper and lower trendlines. Per the rules of technical analysis, theoretically, if the wedge pans out, the FET price might rise nearly 184% to reach $0.606 before retreating.
EMA Resistance Zone Troubles FET Price Rally
The Nvidia earnings hype-fueled rally helped the Fetch.AI coin’s price flip its 20-day EMA (red wave) trendline resistance on Aug 23.
However, the token’s 50-day EMA (purple wave) rebuffed FET’s coin price rally, forcing it to pare some gains after spiking nearly 5.1% to form a daily high near $0.217 on Aug 24. The crypto AI token price would need to conquer the 50-day EMA trendline to infuse confidence in its price action,
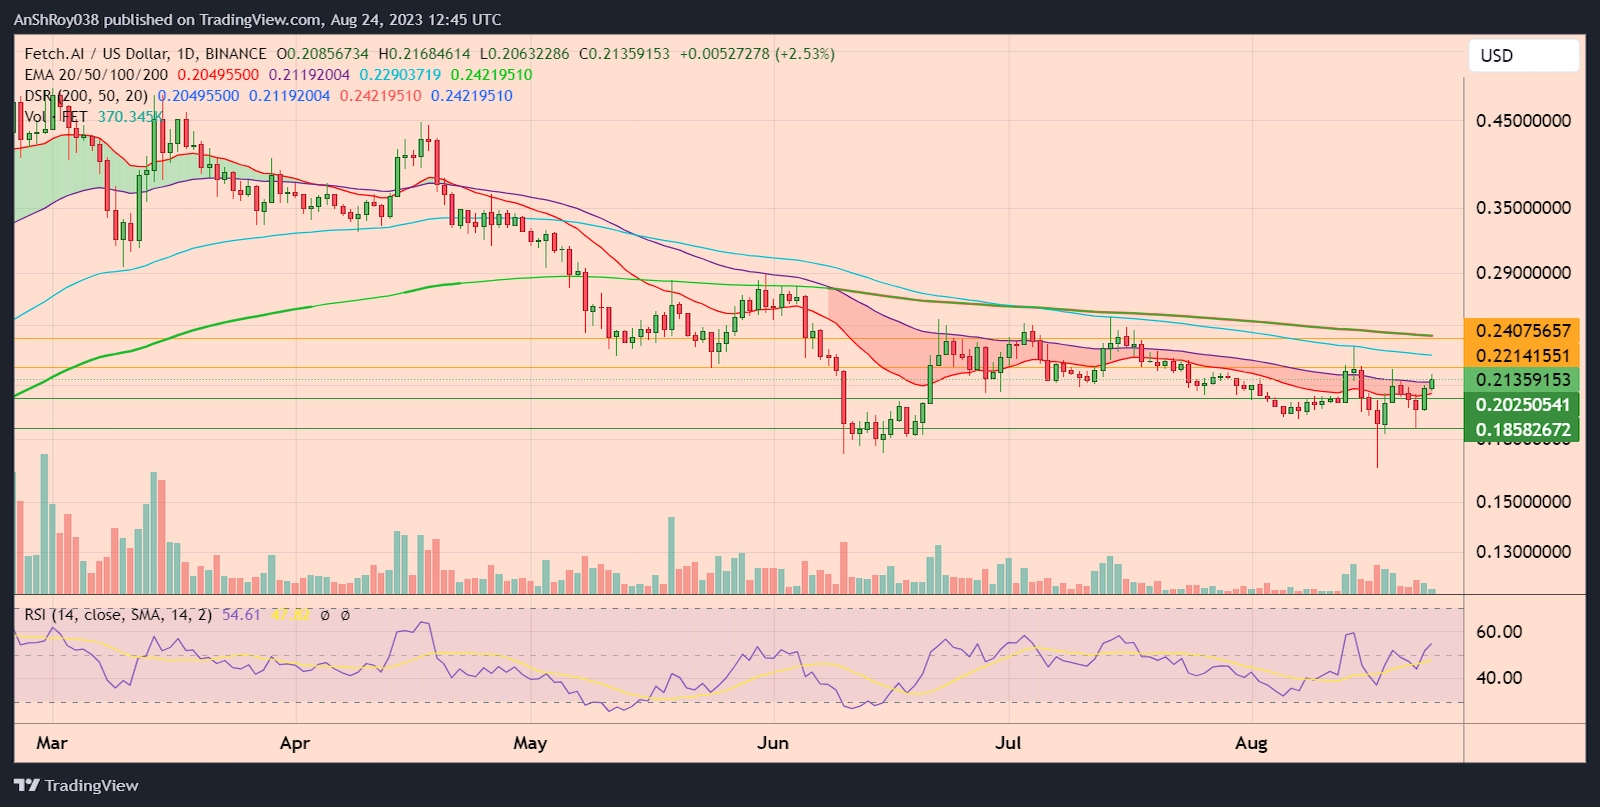
Moving above the 20-day EMA and 50-day EMA resistance zone would help the FET coin price reach the resistance near $0.221.
Moreover, flipping the immediate resistance level could provide the Fetch.AI token price the impetus to target its 200-day EMA (green wave) resistance near $0.241 before retreating.
On the other hand, if the ongoing rally fails, the FET coin price would likely drop to its support level near $0.202.
Breaching the immediate support level might result in FET price testing the support level near $0.186 before recovering.
The relative strength index for FET remained neutral, with a value of 54.61 on the daily timeframe.
#3 RNDR Price Rally Rebuffed By EMA Resistance
Render Network is a blockchain project that allows users to contribute their computational power to 3D rendering projects or other graphic projects and earn crypto tokens in return. The project is built on Ethereum, and its native token is RNDR.
RNDR recorded impressive gains after Nvidia released its quarterly earnings report, spiking by more than 16% since Aug 22 to form a daily high near $1.55 on Aug 24. However, the token’s 20-day EMA (red wave) dynamic resistance forced the Render Network token to pare gains.

RNDR bulls must flip the 20-day EMA resistance before shooting at the 200-day EMA (green wave) and 50-day EMA (purple wave) resistance confluence near $1.7.
Moreover, breaking and consolidating above the immediate resistance could help the Render network token price target the resistance near $1.92 before downside corrections pare gains.
However, RNDR’s 50-day EMA seems poised to move below the token’s 200-day EMA and form a bearish technical pattern called the death cross. Traders consider the pattern an indicator of negative market sentiment and a sell signal.
As such, the RNDR price risks dropping to the immediate support level near $1.34. Moreover, failure of immediate support could force the Render Network token to test the support near $1.15, which would erase all RNDR’s coin gains since late March this year.
The relative strength index for RNDR price remained neutral, clocking at 36.94 on the daily charts.

Cryptocurrency mining news
Crypto market predictions
… [Trackback]
[…] Information on that Topic: coinchapter.com/ai-crypto-tokens-rally-after-nvidia-stock-hits-record-high/ […]
… [Trackback]
[…] Find More on that Topic: coinchapter.com/ai-crypto-tokens-rally-after-nvidia-stock-hits-record-high/ […]
… [Trackback]
[…] Here you can find 26096 additional Info to that Topic: coinchapter.com/ai-crypto-tokens-rally-after-nvidia-stock-hits-record-high/ […]