
Key Takeaways:
- ApeCoin price is trading near its all-time low levels.
- APE price have formed a bullish technical pattern.
- On-chain metrics for the token remain bullish.

NEW DELHI (CoinChapter.com) — ApeCoin, the native token of the Bored Ape Yacht Club ecosystem, is trading near its all-time lows after being in a downtrend since Jan. 2023.
However, the token’s on-chain metrics hint towards bullish market sentiment for APE. Per on-chain data provider Santiment, the APE token price has entered the “historical buy zone” based on the MVRV ratio.
The metric divides the market capitalization by the realized capitalization to determine an asset’s fair value.
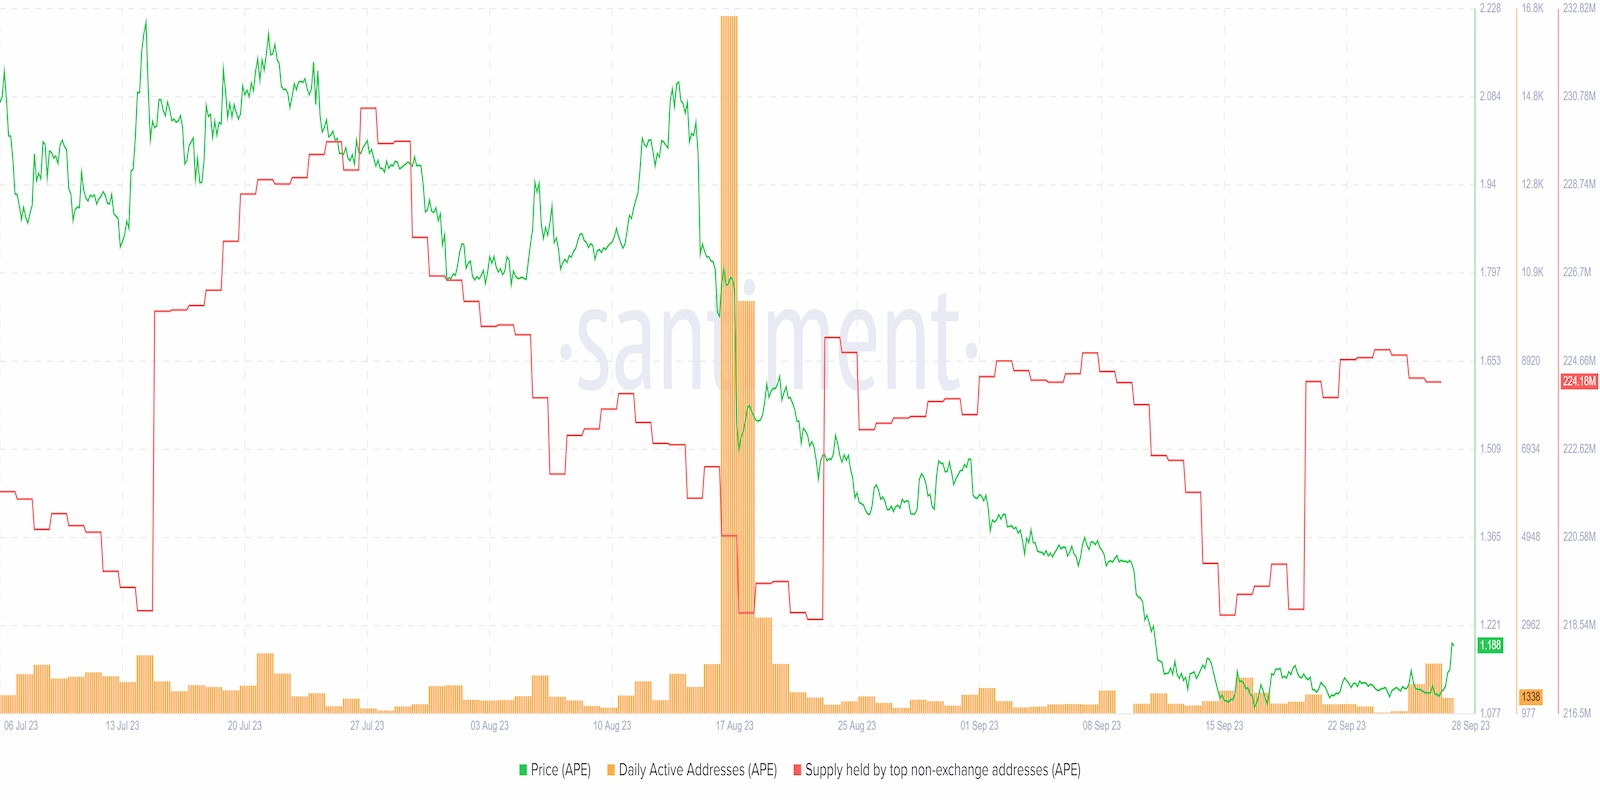
APE’s MVRV ratio has increased, suggesting that Apecoin prices might have bottomed out.
Meanwhile, the number of APE daily active addresses has spiked since Sept. 26, showing increased investor interest in the token. The increased investor interest is also apparent from the increase in non-exchange addresses holding APE tokens.
The increase in bullish sentiment seems to come from the news of ApeCoin DAO’s decision to create a sister DAO through the platform’s Governance Working Group (GWG) “adopting a new non-profit DAO LLC structure.”
ApeCoin DAO claimed the proposal would help enhance operational efficiency, better legal framework, responsible DAO spending, etc.
The APE community approved the proposal with over 64% of votes in favor.
APE Price Moving Inside Bullish Pattern
The ApeCoin token price has formed a bullish technical pattern called the ‘Falling Wedge.’
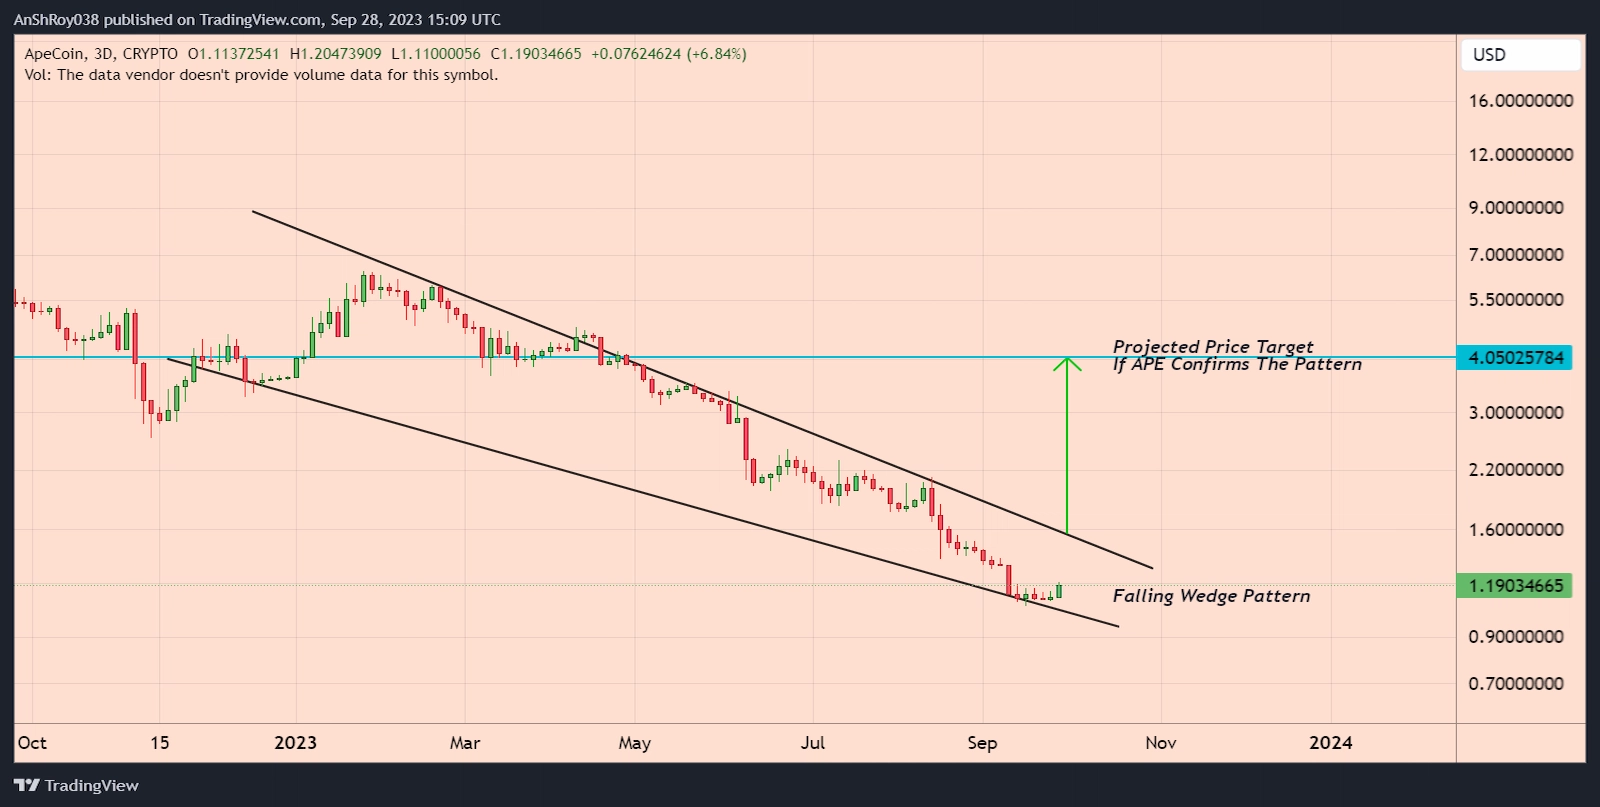
The technical pattern forms when the price fluctuates inside a pair of falling trendlines that converge down the slope. The outcome of such downside patterns is typically a price breakout to the upside.
One key feature of the pattern is that volumes usually decline as the trendlines converge.
The upside target for the breakout is equal to the maximum distance between the falling wedge’s upper and lower trendlines. Thus, confirming the pattern could theoretically result in the Apecoin token price rallying over 240% to reach the calculated price target near $4.
APE Price Rally Faces EMA Resistance
Approval of the DAO’s AIP-317 proposal brought buyers to the market, helping APE price spike 8.5% to reach a daily high near $1.2 on Sep. 28. However, bears are defending the 20-day EMA (red wave) dynamic resistance, paring gains.
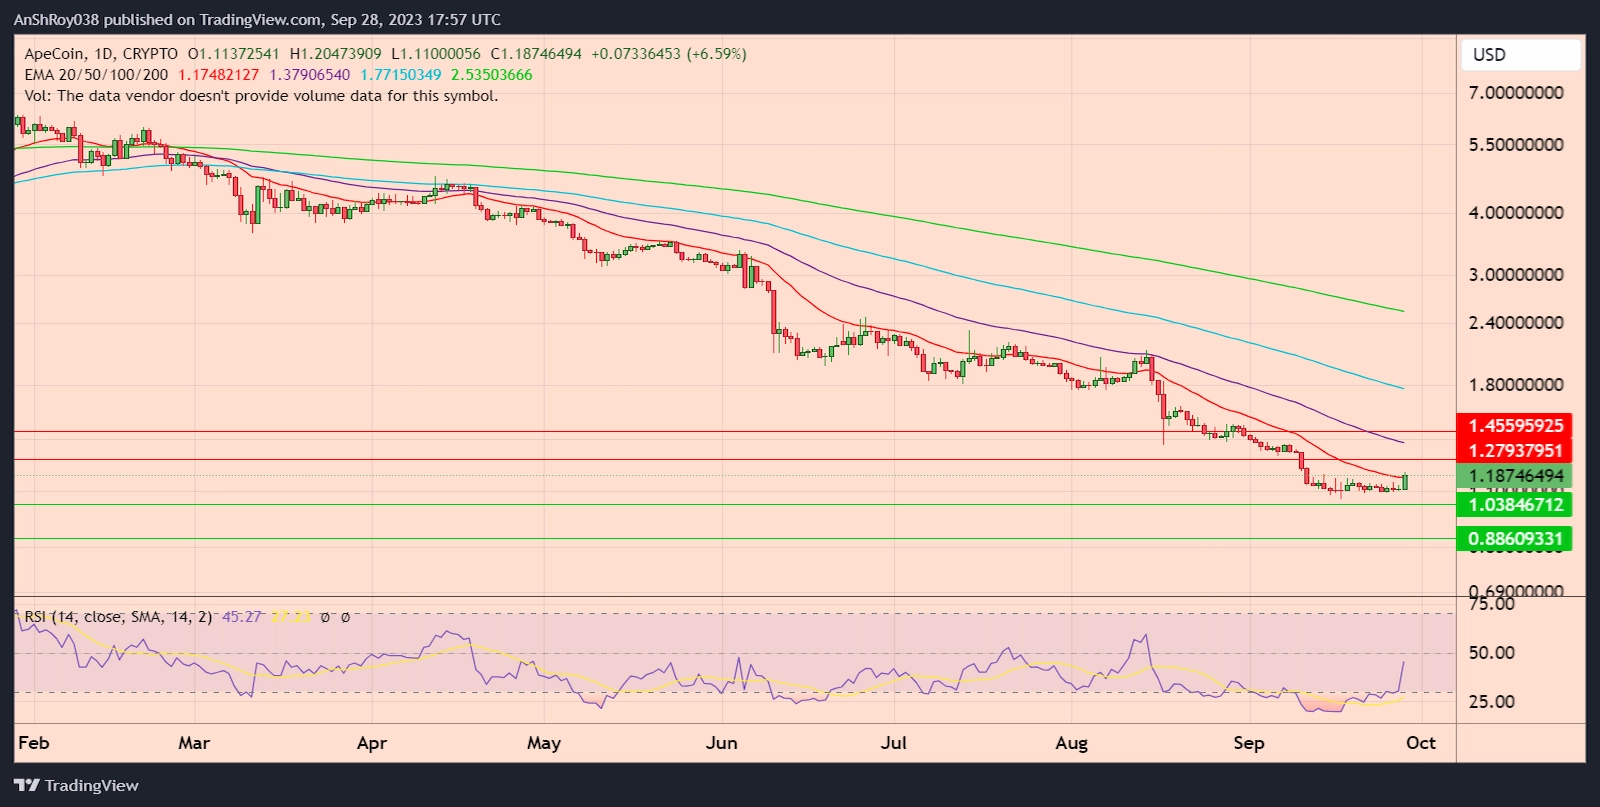
If the bulls manage to turn Sep. 28’s rally into an uptrend. The resulting rally would bring the APE price near the resistance of $1.28. Moreover, breaking and consolidating above the immediate resistance might help Apecoin price target the resistance near $1.456 before retreating.
Conversely, if the 20-day EMA resistance rejects the rally, the APE price might drop to the support near $1.04. Failure of the immediate support level could push ApeCoin price to test the support near $0.89 before recovering.
The RSI for APE remained neutral, with a score of 45.27 on the daily charts.

… [Trackback]
[…] Find More to that Topic: coinchapter.com/apecoin-price-recovers-after-reaching-all-time-low-on-chain-metrics-bullish/ […]
… [Trackback]
[…] Information to that Topic: coinchapter.com/apecoin-price-recovers-after-reaching-all-time-low-on-chain-metrics-bullish/ […]
… [Trackback]
[…] Read More on on that Topic: coinchapter.com/apecoin-price-recovers-after-reaching-all-time-low-on-chain-metrics-bullish/ […]