

Key Takeaways:
- ARK coin prices dropped after Binance launched perpetual contracts for the token.
- The token rose by more than 224% in Sept. 2023.
- ARK coin price has formed a bullish technical pattern.
NEW DELHI (CoinChapter.com) — ARK coin, a native token of Layer-1 blockchain solution ARK Public Network, saw its price spike 224% to a monthly high of $0.73 on Sept. 20.
However, the rally stuttered after Binance announced the launch of USDⓈ-M ARK perpetual contracts on Sept. 19. The token dropped over 25% since Sept. 20, reaching a daily low near $0.477 before recovering.
ARK’s price action resembled that of HIFI token, which plummeted after reaching a new all-time high on Sept. 16, after Binance launched HIFI perpetual contracts on its platform.
Following the launch of HIFI perpetual contracts, the token’s price action went haywire, resulting in massive liquidations of HIFI positions, both short and long
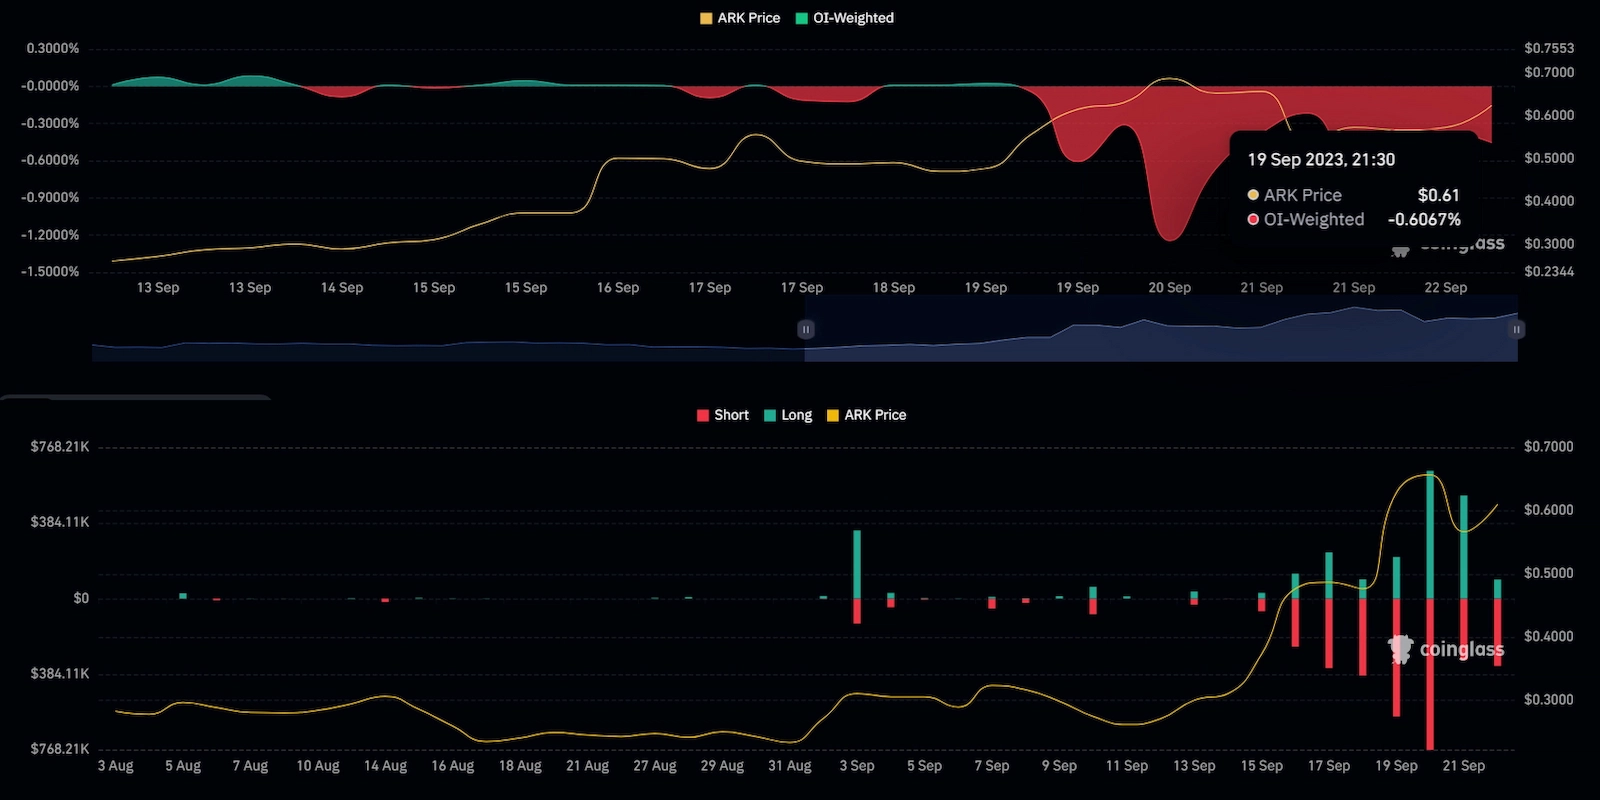
ARK price action painted a similar scene, with the token’s recent rally resulting in massive liquidations between Sept. 15 and Sept. 19. However, following the drop in price on Sept. 20, nearly $648,900 worth of long positions got liquidated. At the same time, traders liquidated about $768,210 in short positions.
On Sept. 21, long position led the liquidations, with traders liquidating over $0.5 million in longs. However, the token’s price recovered on Sept. 21, forcing more shorts liquidations, which might have led to traders panic buying the tokens to maintain margins.
ARK Price Forms Bullish Pattern
The ARK coin price is moving inside a bullish technical setup called the ‘Falling Wedge.’
The technical pattern forms when the price fluctuates inside a pair of falling trendlines that converge down the slope.

The outcome of such downside patterns is typically a price breakout to the upside. One key feature of the pattern is that volumes usually decline as the trendlines converge.
The upside target for the breakout is equal to the maximum distance between the falling wedge’s upper and lower trendlines. Thus, confirming the pattern could theoretically see ARK price rally 928% to reach the calculated price target near $7.4.
ARK Bulls Keep The Party Going
Meanwhile, ARK token bulls’ aggressive buying spree, likely combined with short traders’ panic buying, helped the token rally nearly 20% on Sept. 22 to reach a daily high near $0.69. The spike helped the crypto token price recover most of its losses since Sept. 20.
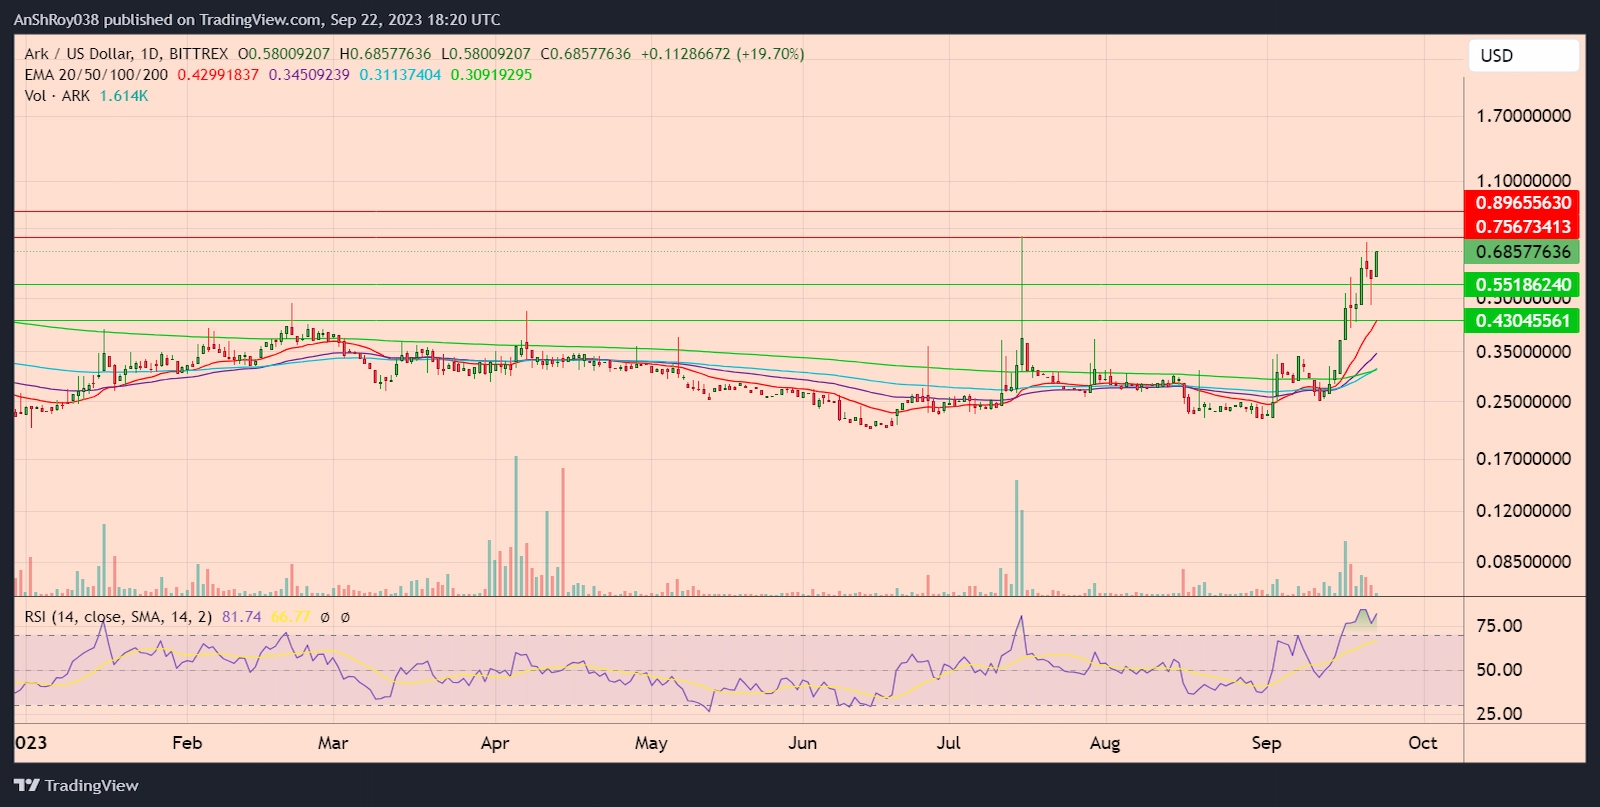
However, the RSI for ARK remained overbought, clocking a score of 81.74 on the daily charts. Usually, overbought RSI levels herald a bearish reversal or a consolidation phase for the underlying token. The high buying pressure for ARK tokens has likely helped the token defy the overbought RSI levels.
Yet, should more sellers enter the market, ARK price could drop to the support near $0.552. Failure of the immediate support level might force the token’s price to test the 20-day EMA (red wave) support near $0.43 before recovering.
Conversely, if the rally continues, ARK price could reach the resistance near its 2023 high of $0.76. Moreover, breaking and consolidating above the immediate support level might help the token target the resistance near $0.9.
