Key Takeaways:
- Staking rewards for the P2E game Axie Infinity are set to unlock soon.
- The bearish cue might force the AXS price to confirm a bearish technical setup.
NEW DELHI (CoinChapter.com) — Play to earn (P2E) blockchain-based game Axie Infinity’s native token AXS might be headed for bearish waters. The token ended April with a 5% negative position.
The last token unlock on April 23 saw AXS price waver as traders started selling to book profits. Axie Infinity’s last token unlock introduced roughly 19 million tokens.
The P2E game’s next unlock event will occur on July 22, releasing over 3.4 million AXS tokens worth more than $22.8 million. As a result, AXS token holders have been piling on sell orders across exchanges. As the selling pressure increases, the Axie Infinity token price might plummet.

A lack of bullish cues might hamper demand for the Axie Infinity token. Since Aug 2022, the number of unique users and transactions has steadily declined on the Axie Infinity network. As such, the demand for the AXS token might be declining.
AXS Price Forms Bearish Technical Pattern
AXS prices move inside a bearish technical pattern called the ‘Descending Triangle.’
The descending triangle is a bearish continuation setup with a falling resistance line that caps upside attempts and a flat support that prevents declines. The height of the triangle’s thickest section determines the price target in a descending triangle setup.
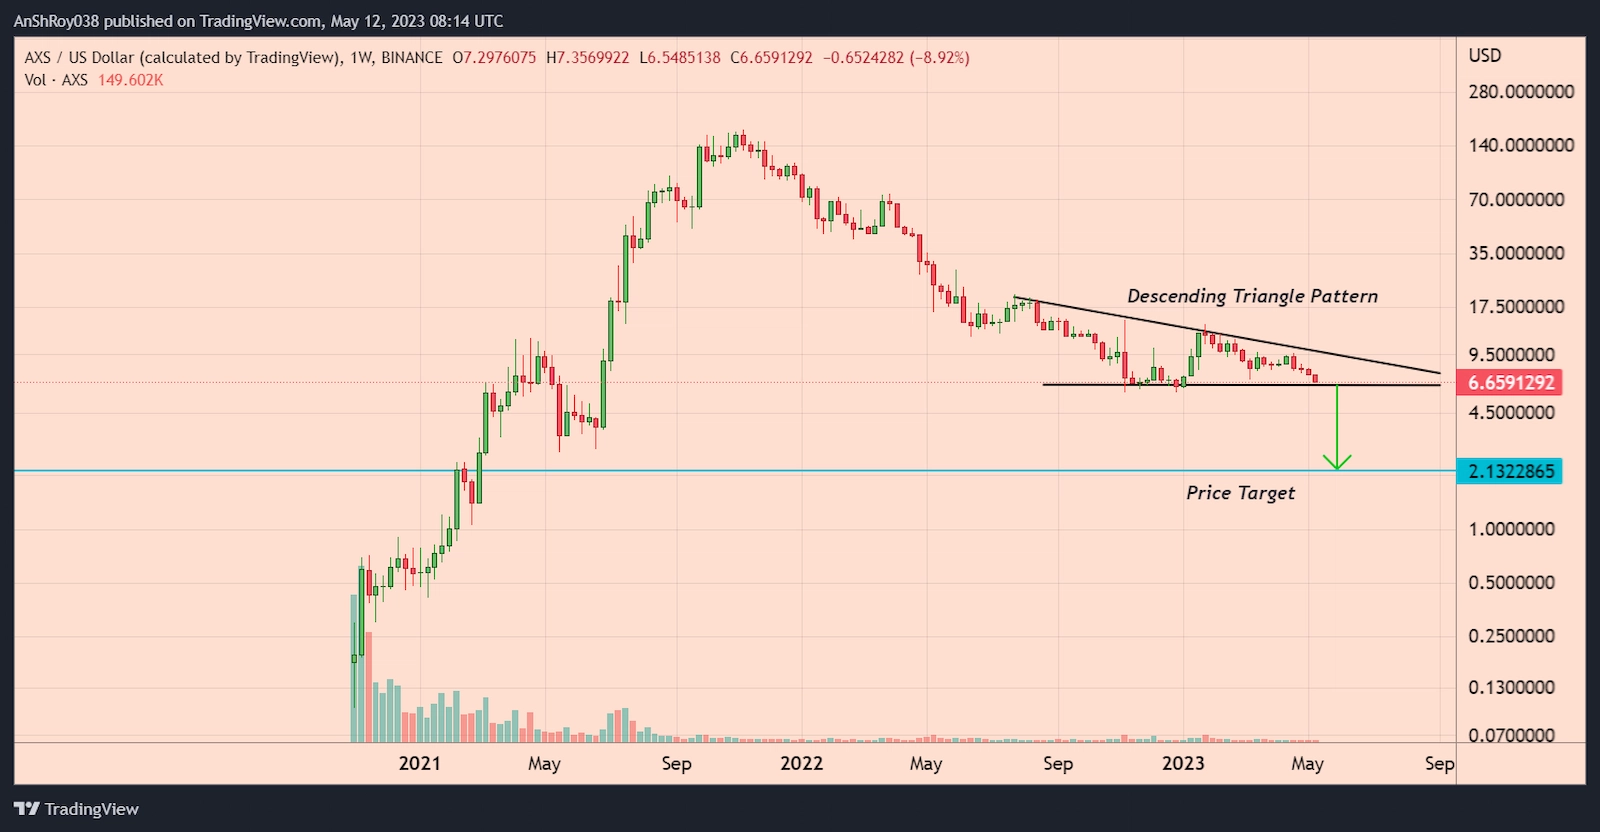
Given the upcoming token unlock and the resulting increase in selling pressure, it is likely that the AXS price would confirm the pattern. As a result, the Axie Infinity token price might drop 68% from its current levels to reach $2.13 if the token confirms the pattern.
Also Read: Bitcoin Price Tumbles – Main Reasons Bears Could Target $24KMeanwhile, AXS price dropped 3.12% to form a daily low of $6.58 on May 12 before bulls pared some of the day’s gains. The drop extended the Axie Infinity token price’s May losses to over 17%.
Even the recent meme coin frenzy failed to buoy the P2E token price. However, the downtrend forced the relative strength index for AXS to become oversold, clocking at 28.21 on the daily chart.
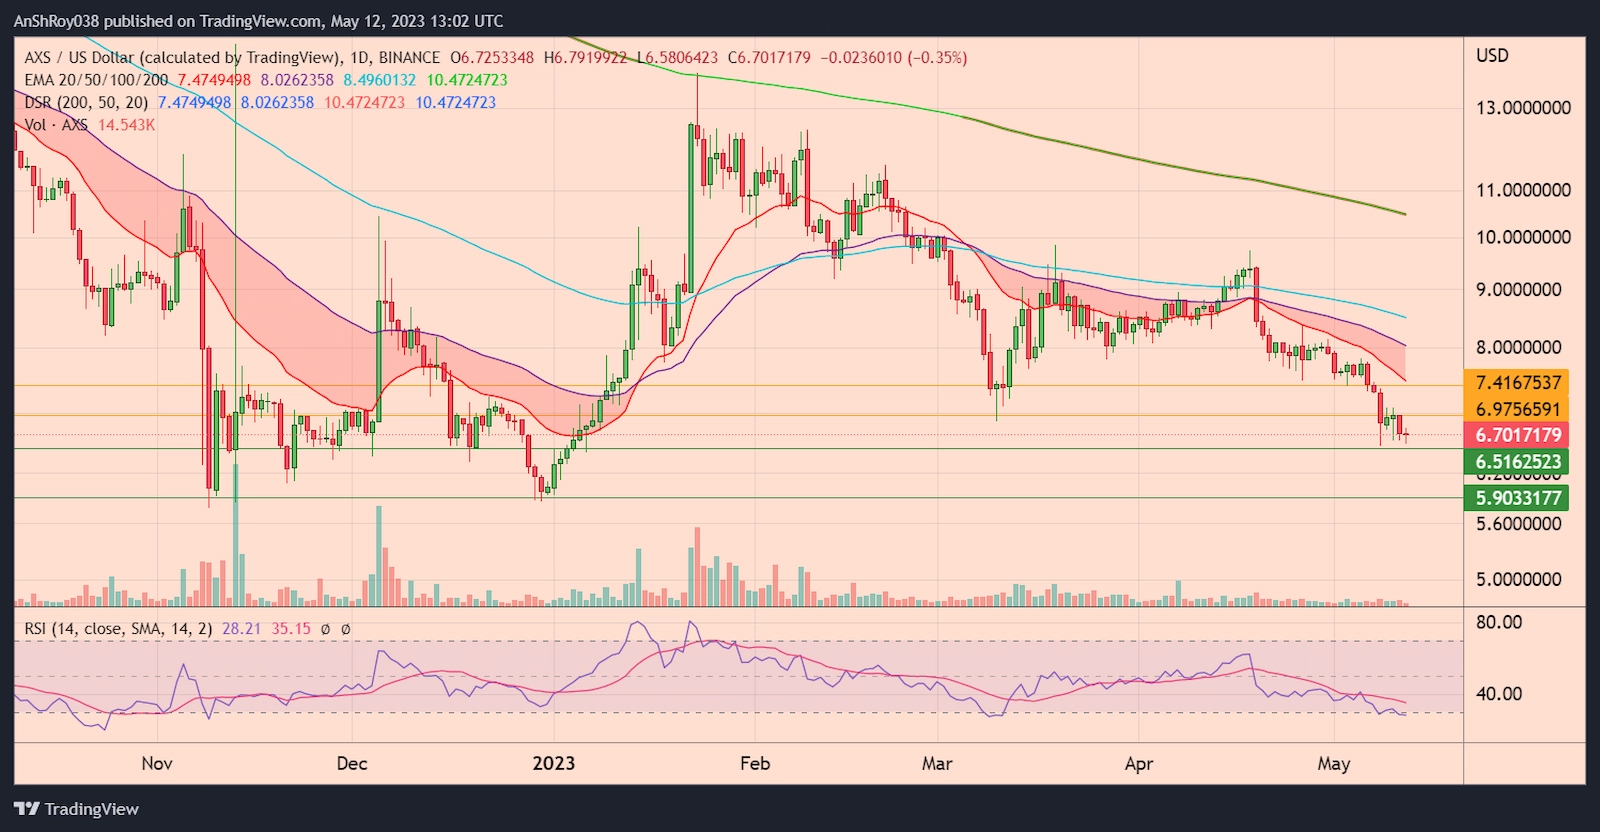
Oversold RSI levels often precede a bullish trend reversal for an asset, which is why traders consider the occurrence a buy signal. If buyers enter the market, AXS’s price might rise to resistance near $6.98.
Breaking and consolidating above the immediate resistance level might help AXS price challenge the 20-day EMA (red wave) EMA resistance near $7.42 before downside corrections pare gains.
Conversely, if the selling pressure increases, AXS’s price might drop to support nearly $6.52. Moreover, breaching the immediate support level could force AXS price to test support near $5.9 before recovering.

… [Trackback]
[…] Find More on on that Topic: coinchapter.com/axs-price-threatens-68-drop-as-token-unlock-looms/ […]
… [Trackback]
[…] There you will find 94777 additional Information on that Topic: coinchapter.com/axs-price-threatens-68-drop-as-token-unlock-looms/ […]
… [Trackback]
[…] Find More on that Topic: coinchapter.com/axs-price-threatens-68-drop-as-token-unlock-looms/ […]
… [Trackback]
[…] Read More here on that Topic: coinchapter.com/axs-price-threatens-68-drop-as-token-unlock-looms/ […]
… [Trackback]
[…] Here you will find 38046 more Information on that Topic: coinchapter.com/axs-price-threatens-68-drop-as-token-unlock-looms/ […]