Key Takeaways:
- Solana prices dropped 56% in Jan.
- A looming death cross might spell sustained bearish trend for SOL.
NEW DELHI (CoinChapter.com) — Blockchain platform Solana (SOL) had a horrid Jan, with prices falling 56% at one point to reach $80.85 from a monthly high of $181.08.
The downtrend, likely due to Solana’s recent network outage mishaps combined with a nearly 44% decline in TVL, has pushed Solana’s prices to levels last seen in early Sept 2021. However, over the last seven days, Solana recovered some lost ground.
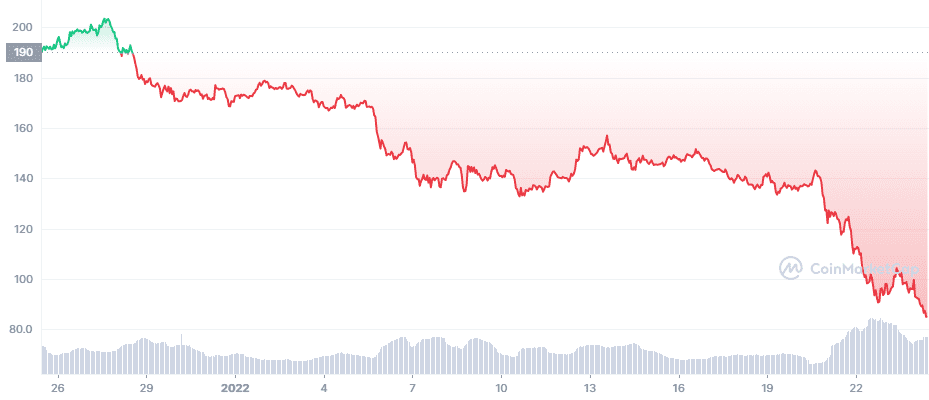
SOL prices gained 6.6% to close at $99.5 on Jan 31. Tuesday saw SOL continue its upside momentum to move above $100, jumping 10.6% between Feb 1’s low of $99.2 to reach an intraday high of $109.7. Despite the recent recovery, SOL prices are still red when viewed in the 30-day time frame.
A bearish technical pattern might raise selling pressure for the Solana token.
Solana: Death Cross Ahead
Solana’s 50-day Exponential moving average (purple wave) is moving to close below SOL’s 200-day EMA to form a bearish chart pattern called the death cross.
In detail, a death cross forms when a token’s short-term moving average trendline moves below a relative long-term moving average. Traders believe the technical pattern signals negative sentiment and weakness.
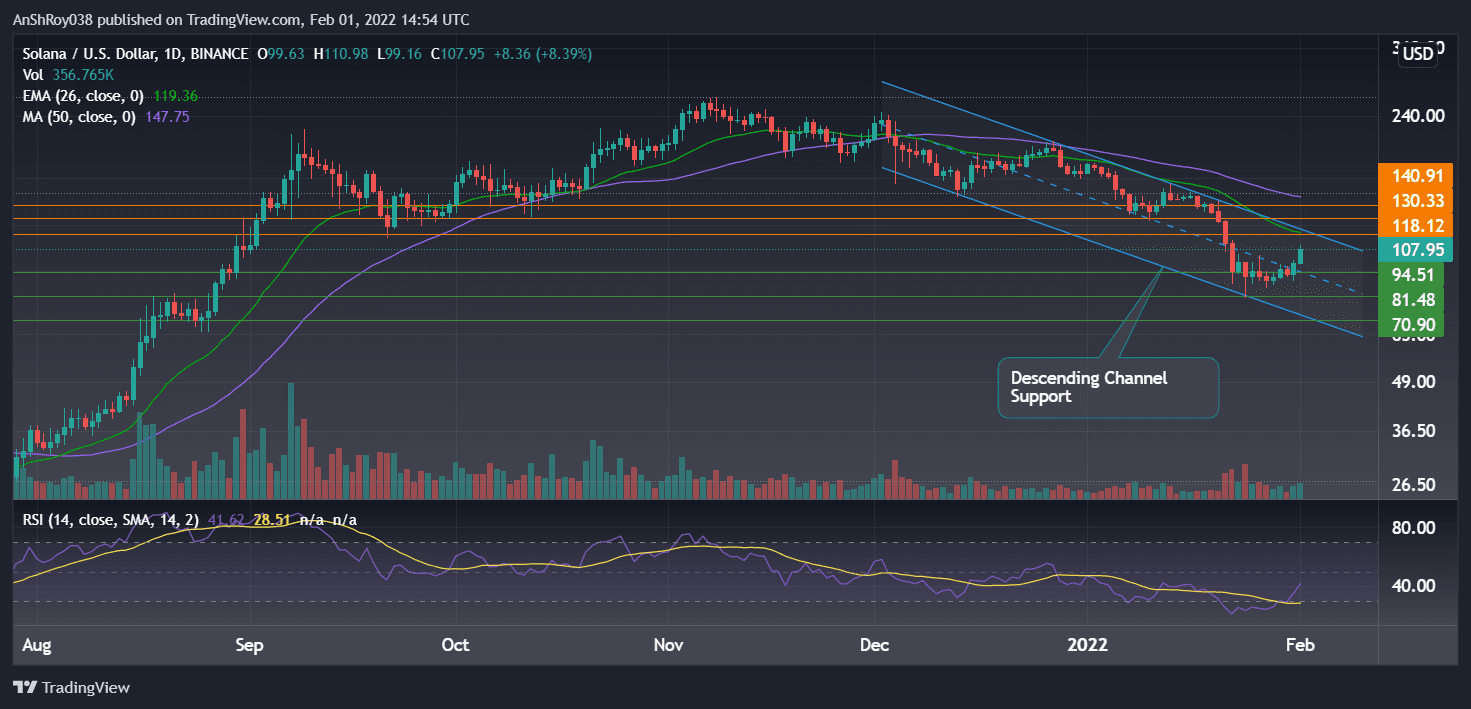
Also Read: Ethereum killers Solana (SOL), Terra (LUNA), and Avalanche (AVAX), back on track after brutal January—what to expect?The death cross often indicates the onset of bearish price action, resulting in significant selling pressure. SOL prices have been moving in a descending channel pattern since Nov 2021. Solana’s 26-day EMA acts as immediate resistance near $107.5.
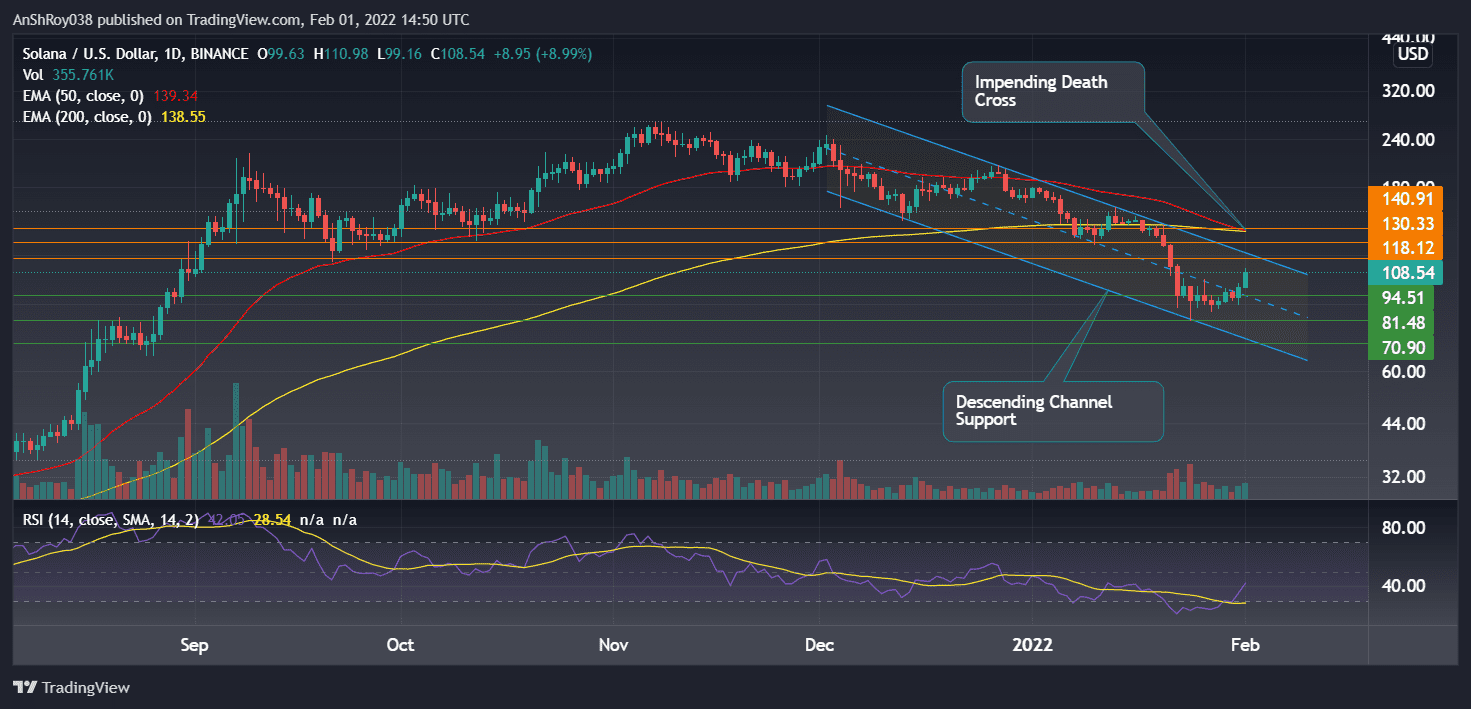
If bulls push prices further, SOL could challenge resistance at $130. Moreover, the 50-day EMA and 200-day EMA form a confluence resistance near the $140 price level. Solana prices are moving upwards towards the upper trendline of the descending channel.
Meanwhile, the relative strength index bounced from oversold levels on Jan 30 and steadily increased. As a result, the RSI is currently neutral, clocking 41.25 on the daily chart.
MACD Bullish For SOL
On the other hand, if SOL were to fall, bulls would try to arrest its descent above immediate support near $94. However, if bulls engage in profit booking, the resulting sell-off would likely pull down prices further, bringing the support near $81 into play.
Also Read: Another Scam: Solana NFT project Big Daddy Ape Club cons investors of $1.3M.A sustained downtrend would bring SOL near the descending channel support before Solana could recover, likely bringing prices near $40, resulting in a 62% drop from current prices.
Trend-based momentum oscillator MACD moved into bullish regions on Jan 31 after charting a bullish crossover. In detail, a bullish crossover occurs when the MACD line (difference between 12-day and 26-day EMA) moves above the MACD signal line (9-day EMA of MACD).
Bars on the MACD histogram expand into the bullish regions, indicating the bullish momentum is strengthening.
At the time of writing, SOL was trading at $108.2, up 8.59% on the day.

… [Trackback]
[…] Find More Information here on that Topic: coinchapter.com/bearish-times-ahead-for-solana-as-sol-forms-ominous-death-cross/ […]
… [Trackback]
[…] Find More Information here on that Topic: coinchapter.com/bearish-times-ahead-for-solana-as-sol-forms-ominous-death-cross/ […]
… [Trackback]
[…] Read More Info here to that Topic: coinchapter.com/bearish-times-ahead-for-solana-as-sol-forms-ominous-death-cross/ […]
… [Trackback]
[…] Read More here to that Topic: coinchapter.com/bearish-times-ahead-for-solana-as-sol-forms-ominous-death-cross/ […]