Key Takeaways:
- Solana Network went down for the second time in Jan amid crypto market crash.
- Meanwhile, Solana’s native token SOL is painting a bearish technical pattern on its weekly charts.
NEW DELHI (CoinChapter.com) — Blockchain platform Solana suffered another network hiccup, the network’s second in Jan, that hampered Solana’s operations for nearly 48 hours. The outage caused panic among DeFi users and traders.
As per a notice on the Solana website on Jan 22, excessive duplicate transactions caused issues for the network validators. The network congestion also led to massive liquidation among Solana DeFi users. In detail, DeFi users who have taken loans from Solana DeFi lending protocols need to top-up their collateral to avoid getting liquidated.
As SOL prices fell during the crypto market rout on Friday, DeFi users raced to top-up their collateral, but the congestion blocked their efforts. As a result, several borrowers lost their funds.
Solana engineers released version 1.8.14 to attempt to ‘to mitigate the worst effects of this issue,’ adding that they would release more updates in the next 8-12 weeks. The team also stated that they would ‘rigorously‘ test the new features in the coming updates.
Solana Labs co-founder Anatoly Yakovenko retweeted a post from an unverified account attributing the network’s issues to ‘current market volatility. Moreover, the latest issue is not Solana’s first tryst with instability. The network attributed a 17-hour outage in Sept to ‘resource exhaustion.’
Also Read: Fantom (FTM) will replace Solana (SOL) by TVL in 2022, according to predictions.Harper Collins’ author Mark Jeffrey called Solana a failure, highlighting the network’s outage was the sixth in the last three months.
Solana (SOL) Paints Bearish Chart Pattern
Solana’s native token SOL fell more than 32% last week. However, more downtrend is likely, seeing that the SOL has painted a head and shoulders (H&S) pattern on its weekly chart. In detail, the pattern forms as a baseline, called the neckline, with three peaks.
When an asset’s price rises to a peak and declines to the base of the last upside move, it forms the shoulder. Prices then start another rally which charts a higher high before retreating to the original base, forming the head. Finally, prices rise again to the initial peak level, the first shoulder, before declining to complete the pattern.
 Paints Bearish Chart Pattern")
The breakout target for the H&S pattern is equal to the distance between the head and the neckline. As a result, the Solana token could fall to $68.5 in the current bear run, seeing that SOL broke out of the bearish pattern last week.
Solana Price Charts
Solana’s bearish forecast comes on the back of a sustained downtrend that saw SOL lose over 53% in 24 days since the new year started.
Also Read: FTX founder believes Solana could be the next Bitcoin but SOL continues to fall.Furthermore, the Solana token has lost nearly 70% of its value after charting a new ATH ($267) in early Nov. SOL continues to fall on Monday, opening the day at $99.85 before rising to $100. Afterward, the token fell nearly 18% to reach an intraday low of $82.16

The freefalling Solana token has support near the $81.9 price level. SOL could see further downside movement since it broke out of the bearish Head and Shoulder pattern with a breakout target near $68. If prices continue downwards, the Solana token price could rally near support at $67.7.
On the other hand, if Solana manages to break out of the freefall, upside movement would face a challenge from immediate resistance at $102. Moreover, a sustained upside rally could push prices to $116.7. Meanwhile, the Solana token is bearish across all time horizons, trading below its short, mid, and long-term moving average trendlines.
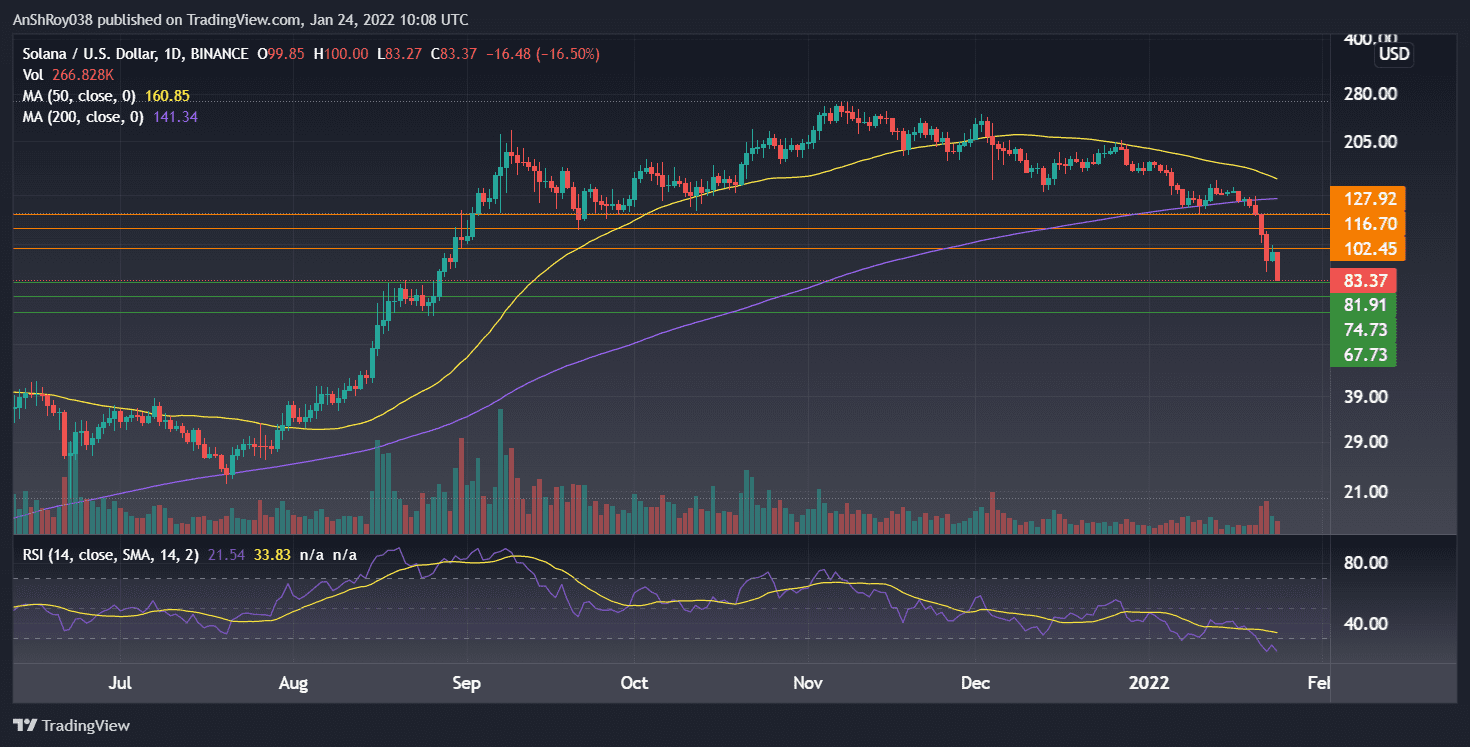
Solana’s relative strength index is in the oversold regions, clocking a value of 21.54, its lowest to date, on the daily charts. Moreover, the RSI trendline is moving downwards, indicating more bearish movement for the Solana token in the coming weeks.
At the time of writing, SOL was trading at $83.7, down 16% on the day.

I’m gone to tell myy littlee brother, thzt
he shoukd alkso isit thjis blkg on regular basis tto take updated from most
up-to-date news update.
… [Trackback]
[…] Read More Info here on that Topic: coinchapter.com/solana-faces-network-instability-woes-as-sol-paints-a-bearish-pattern/ […]