
Key Takeaways:
- Bitcoin extended losses and even spiked below $60,000.
- BTC/USD is following a major bearish trend line with resistance at $62,650 on the daily chart.
- The price could dive further toward $56,500 before the bulls emerge.

NEW DELHI (CoinChapter.com) — Bitcoin’s price signals more downsides below $62,000. If the price closes above $62,650, BTC might make a decent upward move.
Bitcoin Price Consolidates Losses
In the previous analysis, we discussed how Bitcoin price could continue to move down if the bulls fail to protect the $64,300 support zone. BTC bears remained in action, and they were able to push the price below the $64,300 and $63,500 support levels.
The price even dived below the $61,200 and $60,000 levels. A new monthly low was formed at $58,555 and the price recently started a consolidation phase. There was a minor increase above the $60,000 level. The price climbed above the 23.6% Fib retracement level of the downward move from the $71,950 swing high to the $58,555 low.
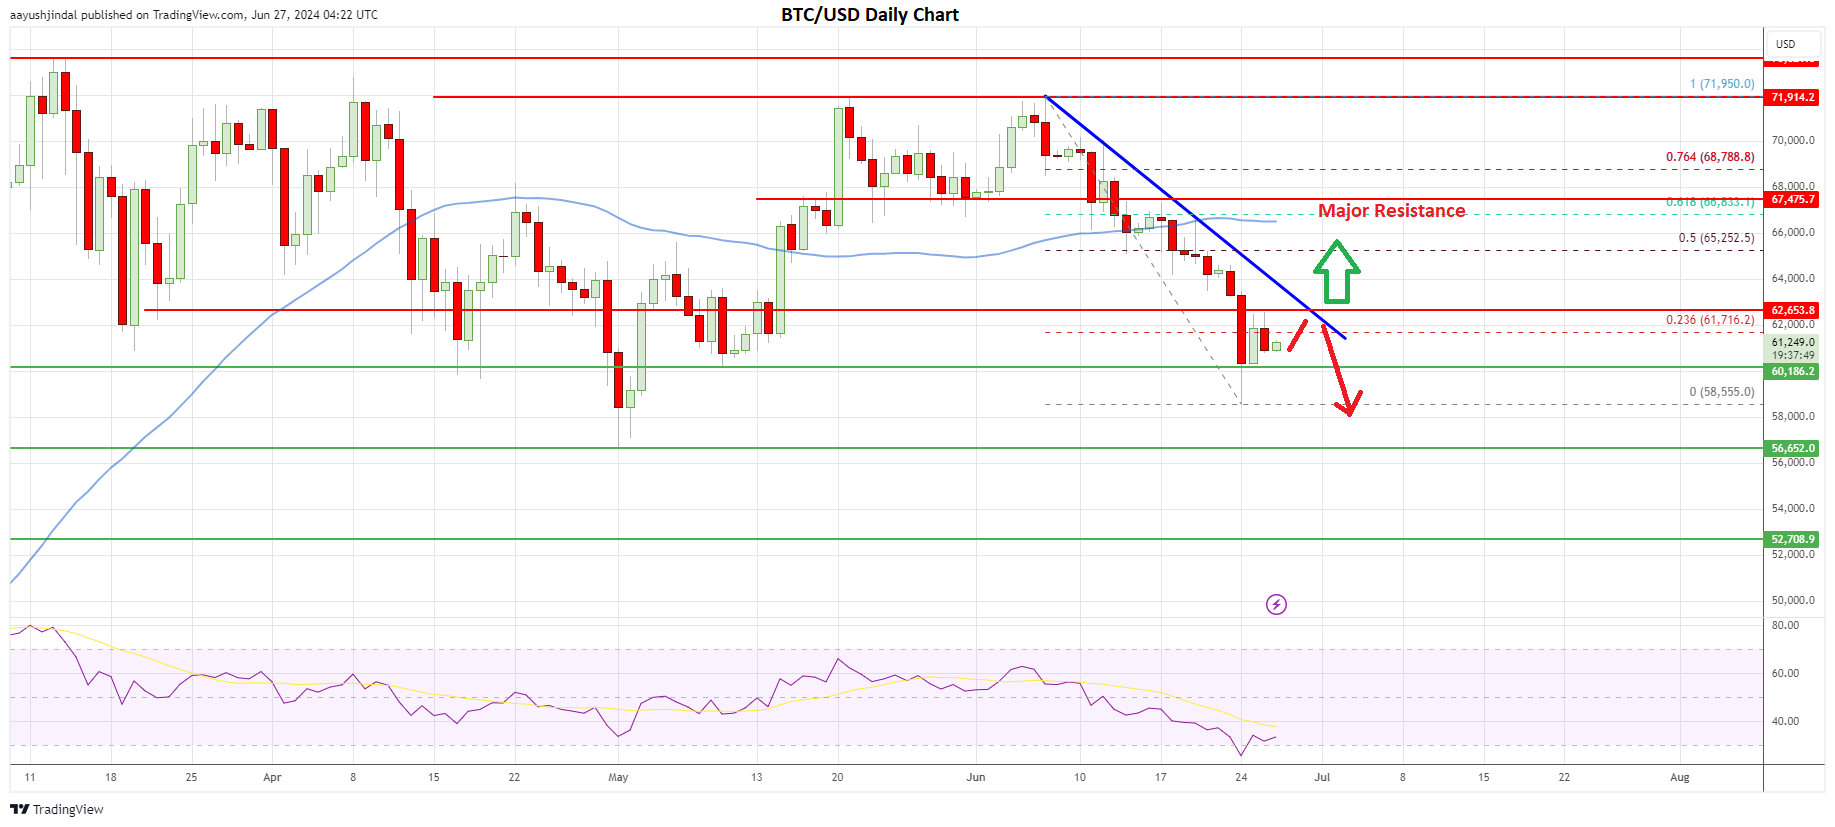
Bitcoin price is now showing bearish signs below the $62,000 zone and the 50-day simple moving average (blue). It is also following a major bearish trend line with resistance at $62,650 on the daily chart.
If the bears remain active below the trend line resistance, the price could extend losses. Immediate support on the downside is near the $60,150 level. The first major support is near the $58,500 level.
A downside break below the $58,500 support zone could spark more bearish moves. In the stated case, the price might decline toward the $56,500 support. Any more losses could open the doors for a move toward the $52,800 support zone in the coming days.
Another Recovery Attempt By BTC?
Conversely, Bitcoin could stay above $60,000 and attempt a fresh increase. Immediate resistance on the upside sits at the $62,650 zone and the trend line. A close above the trendline resistance might send the price toward the $65,000 resistance zone.
The first major resistance above $65,000 sits near the $67,000 zone and the 50-day simple moving average (blue). If BTC price breaks the $67,000 resistance, it could initiate a fresh uptrend.
The next key resistance sits at $68,800, above which the price could gain bullish momentum. In the stated case, the bulls could even aim to move toward the $72,000 region. Any more gains might send the price toward the $75,000 region and a new all-time high.
Overall, Bitcoin is showing a few bearish signs below $62,650 and the 50-day SMA. BTC is now at risk of more losses below the $60,000 and $58,500 support levels in the coming days.

