
- Bitcoin daily transactions are up 10.5% month-to-date and hit a 5-month high in October.
- Daily active BTC addresses also reached a 5-month high of 984,400 in October.
- Organic demand for Bitcoin network rising with every passing day.
BENGALURU (CoinChapter.com) – Bitcoin’s rising daily transactions and active addresses rose to a 5-month high in October. The growth in these two network metrics implies significant demand for the top cryptocurrency network. Furthermore, the uptick in on-chain metrics pointed towards pervading adoption.
As per Kraken’s October 2021 Crypto On-Chain Digest data, active daily BTC addresses bottomed on July 3, 2021. What followed next was a 32% increment to near seven figures in October.
“After falling -39.6% from May 13th to a 1.5-year low of 745.7K on July 3rd, the weekly average of BTC’s daily active addresses rebounded +32% to a near 5-month high of 984,400 on October 10th.”
Related: Bitcoin HODLing Addresses Have Grown 2X Since Last Year – What Does This Mean?
Bitcoin’s daily transactions rose to 285,000 on October 22nd. After two days after the benchmark, cryptocurrency attained a new all-time high price above $67,000.
Bitcoin’s Rising On-Chain Metrics
The rise in the flagship cryptocurrency’s on-chain metrics, especially during its market uptrend, is a bullish indicator. It implies that stakeholders believe in the long-term potential of the first public blockchain network. But they also feel the need to use it more in daily life.
Active And New Address
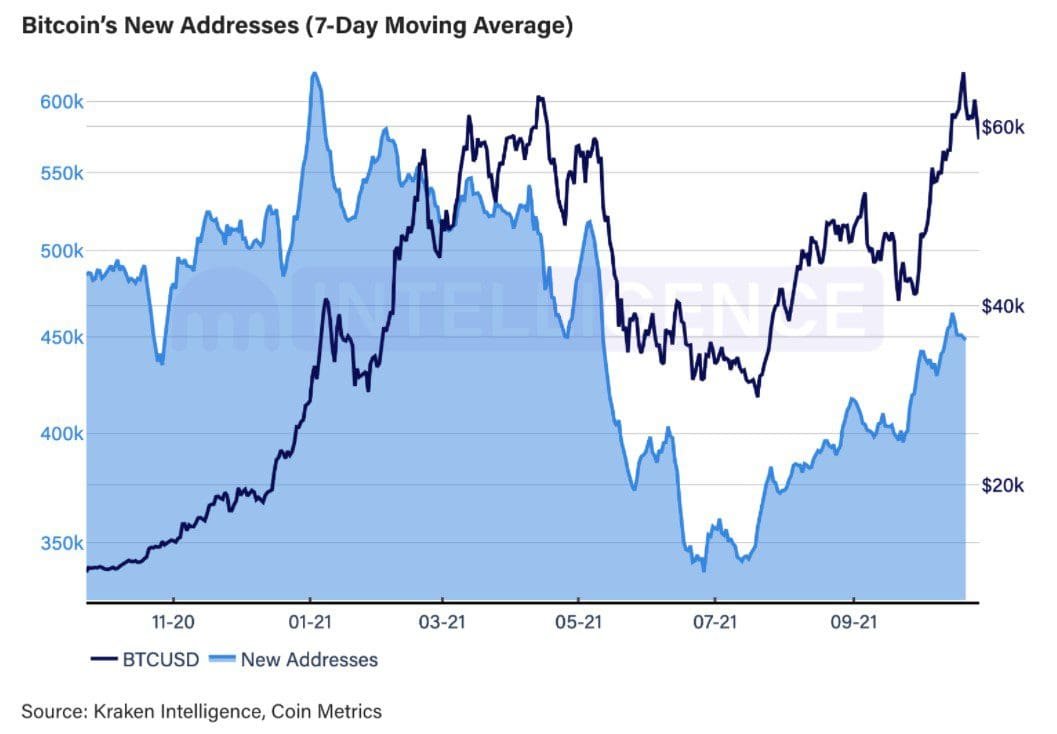
Kraken researchers also observed a positive correlation between BTC/USD prices and the 7-day moving average of the asset’s daily active addresses.
The Bitcoin address and price correlation came out strongly in the new addresses data.
“Further evidence that greater network demand has contributed to BTC’s price appreciation is visible in the rise in new addresses, which are defined as addresses identified in the blockchain that did not exist before the observation period.”
According to Kraken’s October report, the 7-day moving average of new addresses increased to nearly 450,000 in September. The metric touched a 5-month high of 463,500 on October 15th. New Bitcoin address uptrend since June 26th.
Daily Transactions And Active Supply Velocity
Bitcoin’s daily transaction increment points to rising network demand. But the crypto asset’s active supply velocity provides further insight into the relationship between rising BTC/USD prices and network demand.
Related: Bitcoin Transaction Volume Crosses $36bn Milestone as Focus Turns to “Inflation Shock”
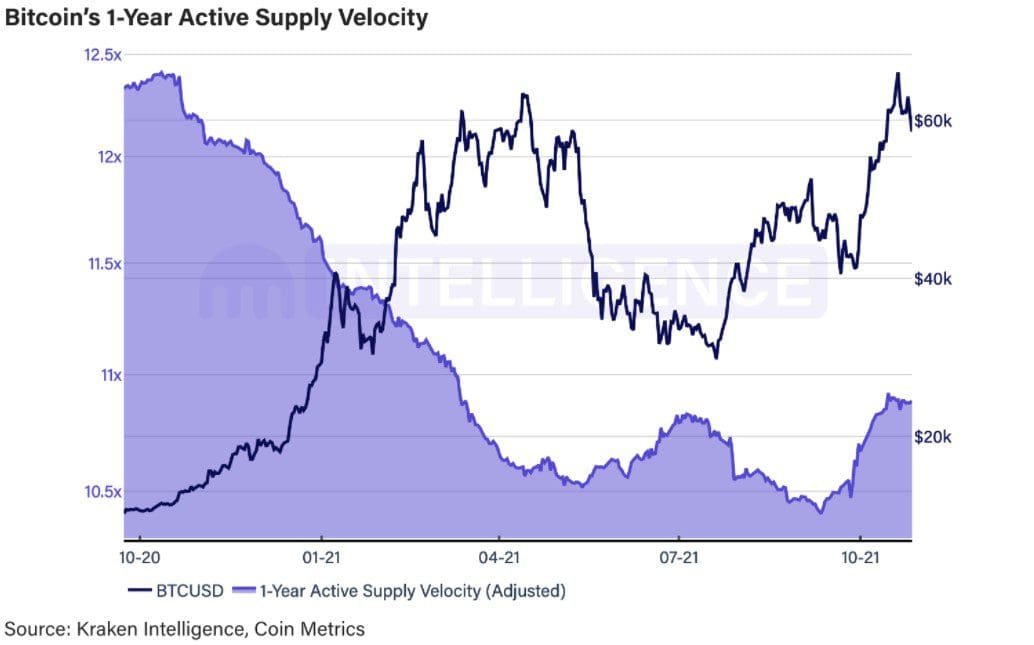
“Because velocity measures the network’s transaction volume realtive to its market capitalization, a change in velocity can lend insight into whether into whther network demand outpaced or lagged price appreciation when analyzed alongside the trend in price.’

The researchers at Kraken interpreted BTC’s supply velocity as “the rate of “turnover” or the number of times that an average BTC among the active supply was transferred in the past year”. Numbers show top digital asset’s 1-year active supply velocity rebounding 4.9% to 10.92x on October 15th, after dropping to a 6-year low of 10.4x on September 11th.
“Considering that the metric fell -16% since late 2020, a recent reversal alongside a rally in price indicates that, unlike H12021, renewed network demand accompanied BTC’s rally in price.”
BTC/USD Technical Setup
Bitcoin’s continual uptrend since July 2021 end fits an Ascending Channel formation. The BTC/USD pair retraced after testing the upper trendline at a new all-time high. Bearish forces have taken over the market, but the flagship cryptocurrency enjoys solid support at $53,717.
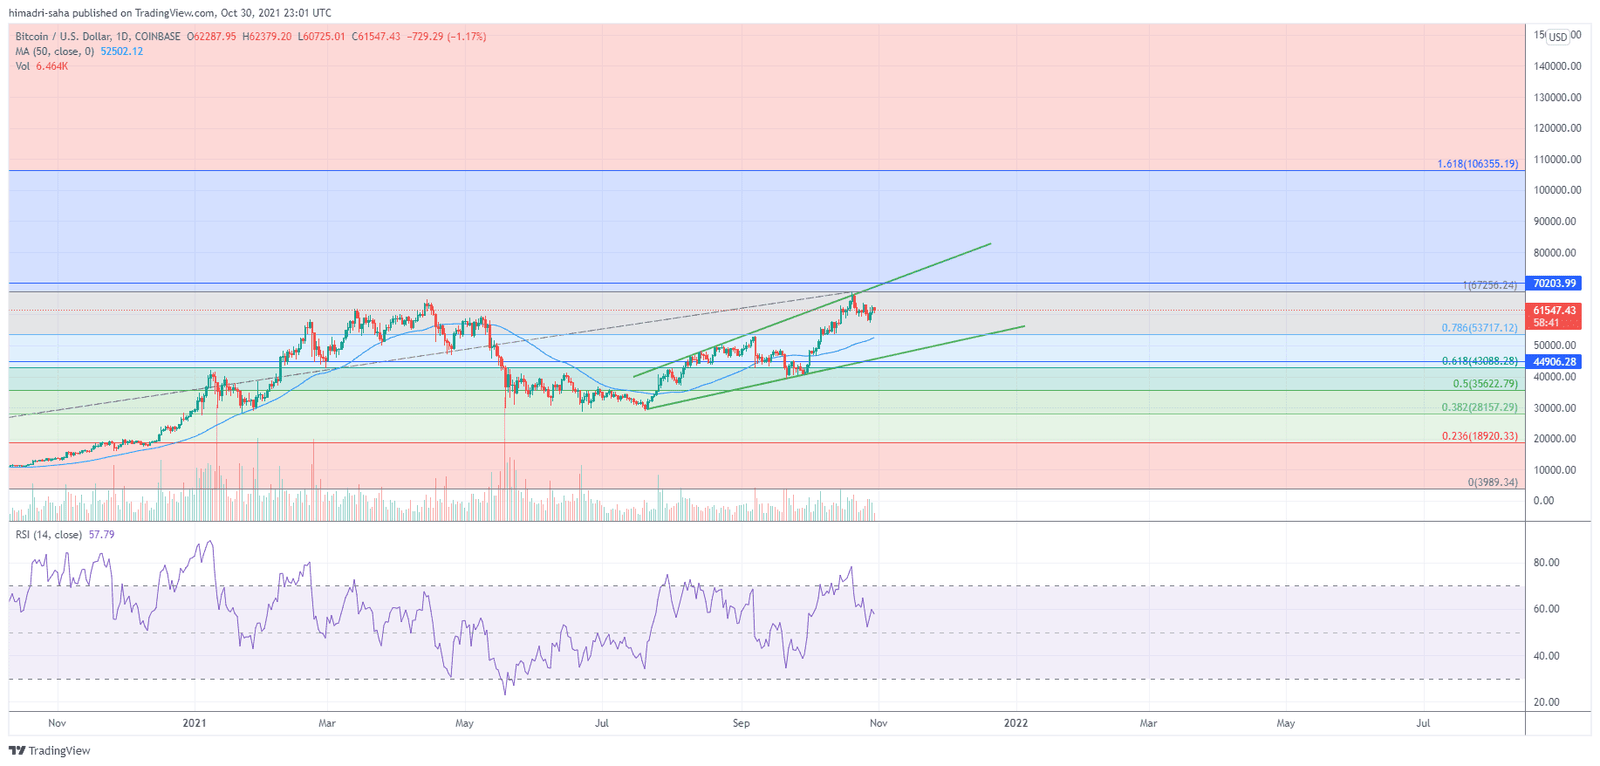
Sellers will try and push down BTC to the said support. But if the act gets interfered with by buyers/bulls, the number 1 digital asset looks primed to tap $70,200 next. However, a sideways trend or minor dip might precede the rally. That’s when long-term investors would amass considerable buy positions, thereby opening doors to $70,000 and beyond.
The relative strength index (RSI) corrected to the neutral zone, indicating bulls to push Bitcoin up higher. Over the long-term, Bitcoin bulls will attempt to tap $100,000.

… [Trackback]
[…] Find More to that Topic: coinchapter.com/bitcoin-btc-daily-transactions-active-addresses-hit-5-month-high-in-october/ […]
deneme bonusu veren casino siteleri lisanslı casino siteleri
… [Trackback]
[…] Here you can find 61209 more Info on that Topic: coinchapter.com/bitcoin-btc-daily-transactions-active-addresses-hit-5-month-high-in-october/ […]