
Bitcoin price gained bullish momentum above $115,000 and traded to a new all-time high. BTC is now consolidating gains and might start a fresh increase.
Bitcoin Price Eyes Fresh Increase
After gaining pace above the $106,500 level, Bitcoin price extended its upward move. The bulls were able to push the price above the $110,000 and $115,000 levels. The upward move was such that the price cleared the $120,000 resistance.
The price traded to a new all-time high above the $123,500 level and tested the 1.618 Fib extension level of the downward move from the $111,880 swing high to the $98,579 low.
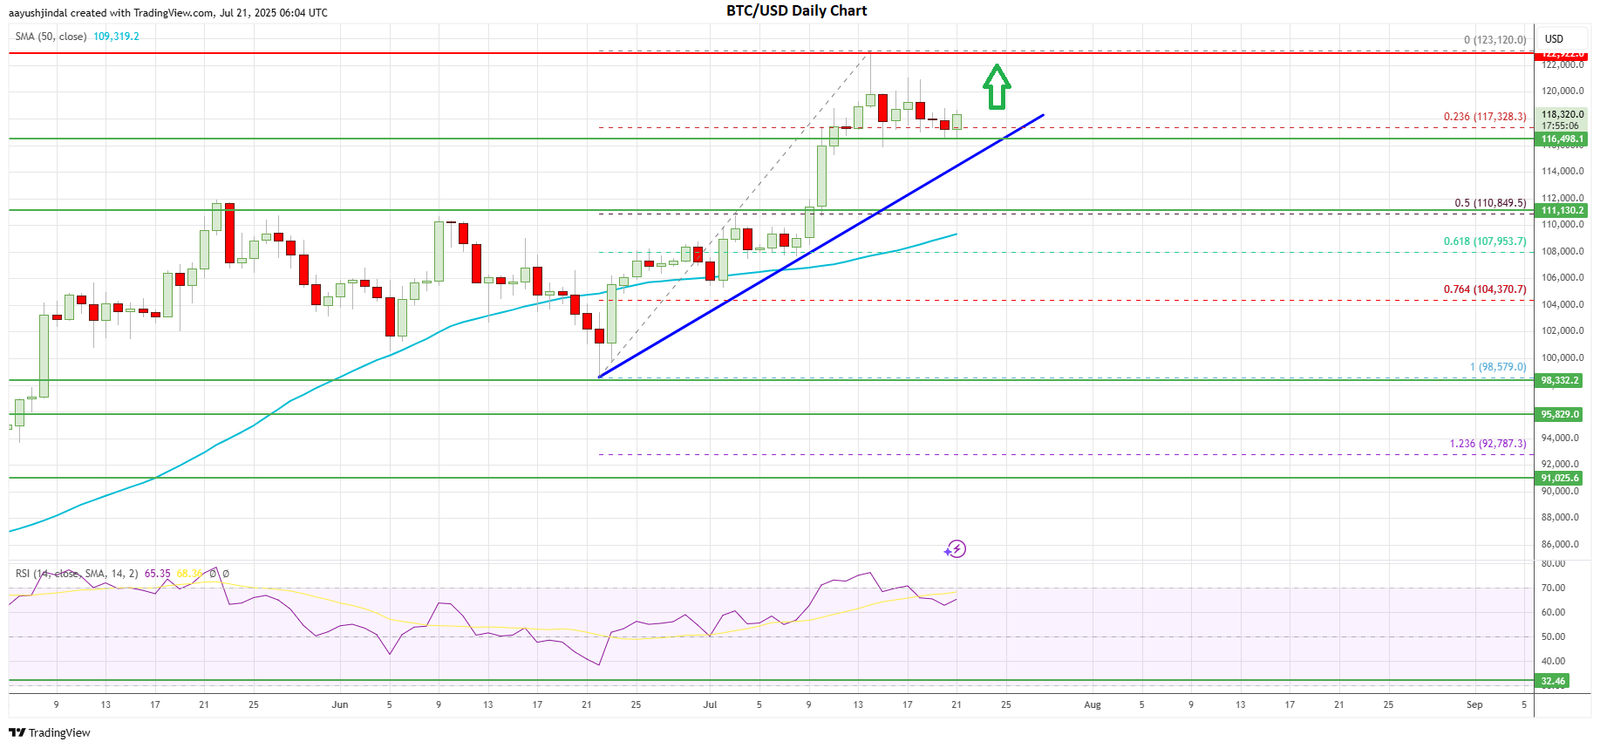
Bitcoin started a downside correction from the $123,120 high. The price is now consolidating above the $115,000 level and the 50-day simple moving average (blue). The current price action and the current candle suggest that the bulls could aim for more gains.
There is also a key bullish trend line forming with support at $116,500 on the daily chart. The trend line is close to the 23.6% Fib retracement level of the upward move from the $98,579 swing low to the $123,120 high.
On the upside, immediate resistance is near the $120,000 level. The first major resistance is near the $121,500 level. A close above the $121,500 resistance might spark more upsides.
In the stated case, the price could attempt a move toward the $123,200 level. In the stated case, there are chances of more and a fresh ATH in the coming sessions and BTC price could rise toward the $125,000 level. Any more gains might call for a test of $128,000.
Downside Correction In BTC?
If Bitcoin bulls fail to push the price above $120,000, there could be a bearish reaction. Immediate support is near the $117,200 level. The first major support is near the $116,500 level and the trend line zone.
A downside break and close below the $116,500 support might spark more losses and send the price further lower. In the stated case, Bitcoin could test the $112,500 support. The next key support could be $110,000 and the 50-day simple moving average (blue).
If the bulls fail to protect the $110,000 zone, the price could start a major decline. In the stated case, the price could test the $107,500 support. Any more losses might call for the test of the $105,000 support.
Overall, Bitcoin is showing positive signs above the $115,000 level and the 50-day simple moving average (blue). A convincing close above the $120,000 level could initiate a fresh surge, and the price could rally to $125,000.
