

Key Takeaways:
- Bitcoin’s correlation with equities has been increasing in the second half of 2021.
- Meanwhile, BTC prices moved below $60,000 on Nov 16.
NEW DELHI (CoinChapter.com) — The correlation between the world’s largest cryptocurrency, Bitcoin, and the S&P 500 index is ticking upwards. As such, Bitcoin seems to be moving away from its digital gold narrative, behaving more like a risk-on asset similar to stocks.
The S&P 500 is a stock market index that tracks the stock exchange performance of 500 large companies listed in the United States. In detail, correlation is a statistical measure that expresses the extent to which two assets are linearly related.
Meanwhile, Bitcoin(BTC) prices struggle to move back above $60,000 after falling below it on Tuesday. The downside marks the fourth consecutive red candle on BTC’s daily price charts.
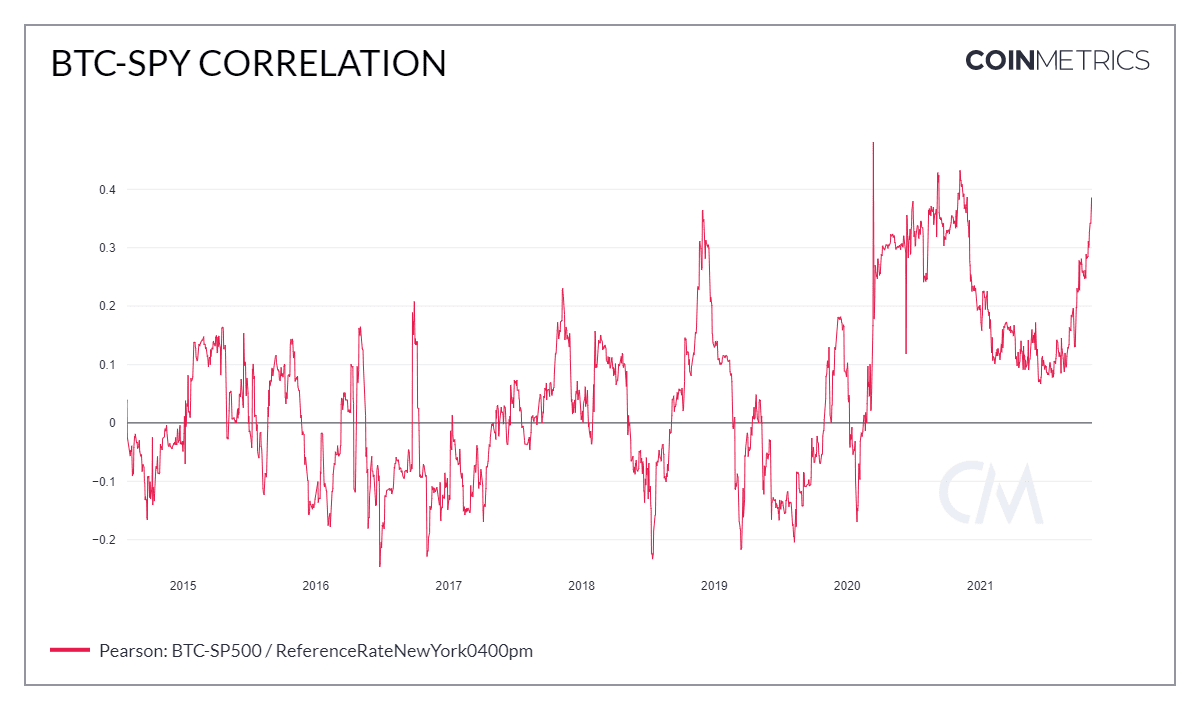
Bitcoin S&P 500 Correlation
According to Coin Metrics’ State of the Network report, Bitcoin’s correlation with stock sectors has increased since June 2021. For example, after falling close to zero in Feb 2020, the BTC-S&P 500 correlation reached an ATH of 0.4809 on Mar 12, 2020. The increased correlation could be attributed to Covid’s impact on the global economy.
Lower correlation is generally better for BTC prices, as seen during Sept end and Oct beginning. The correlation between BTC and S&P 500 has never been very high, as the correlation ATH indicates. However, recent BTC price action has closely followed stock markets.
For example, after news about Chinese real estate firm Evergrande’s loan default spread, stock markets worldwide fell, and Bitcoin fell almost 10% in tandem. Moreover, almost every BTC price correction has coincided with the S&P 500 correction of -2% or more.
Also Read: Bitcoin (BTC) drops below $60K as Biden signs controversial US infrastructure bill into law.BTC prices reached a new record high of $69,275.47 on Nov 10, shortly after US Consumer Price Index (CPI) data showed inflation in the US reached a 31-year high of 6.2%. As a result of the news, stocks extended their losses amid a wider selloff, retreating from the week’s highs.
Surprisingly, Bitcoin prices followed suit, falling 5.25% to close below $65,000 on the day. As such, the move further affirms that the top cryptocurrency reacts to FUD affecting stock markets.
BTC price action w.r.t stock markets might lead to Bitcoin deviating from its digital gold narrative.
Bitcoin Prices
BTC prices are down 2.86% in Nov, with Bitcoin painting consecutive red candles on its daily charts since Sunday. The downtrend might lead to BTC moving below its 50-day moving average trendline, making the token bearish in the short-term range.
The downtrend would likely cast doubts over analysts’ predictions of $100,000 BTC by the end of 2021. Since July, Bitcoin seems to be moving in an ascending parallel channel but has yet to break above it. As such, even if prices reach the upper trendline by Dec end, BTC would likely reach $89,000, unless prices break above the channel.
Also Read: More opportunities for Bitcoin as the new Taproot upgrade enables smart contracts, privacy features.At present, BTC has immediate resistance at $61,012.09. The OG crypto’s 26-day Exponential MA trendline forms the next resistance level at $62,648.32. If BTC finally reacts to the taproot update going live, Bitcoin prices might move to $64,770 before market corrections set in.

On the other hand, Bitcoin would seek support at $58,290 if the downtrend continues. If new entrants sell to recoup losses, BTC could fall below immediate support to $56,597. Moreover, a sustained selloff would likely bring the support at $54,390 into play.
Meanwhile, the relative strength index trendline is moving steadily down towards oversold levels. The RSI is currently neutral, with a value of 42.34. A move below 30 in RSI usually hints at a trend reversal in the works, which the bulls would be hoping for.
Trend-based momentum oscillator MACD is strongly bearish for Bitcoin.

Bars on the MACD histogram, which measures the difference between the MACD line (difference between 12-day and 26-day EMA0 and the MACD signal line (9-day EMA of MACD), are plotting lower lows in the negative region. As such, the MACD line is below its signal line, signaling a bearish momentum for BTC.
At the time of writing, BTC was trading at $59,080, down 2.56% on the day.

… [Trackback]
[…] Find More on on that Topic: coinchapter.com/bitcoin-correlation-equities-increasing-while-btc-price-falls-12-35-move-below-60k/ […]
… [Trackback]
[…] Read More on that Topic: coinchapter.com/bitcoin-correlation-equities-increasing-while-btc-price-falls-12-35-move-below-60k/ […]