
YEREVAN (CoinChapter.com) – Bitcoin (BTC) reached its highest value year-to-date on Jan 29, settling near $23,600 early on Jan 30. Moreover, several indicators indicate a bullish continuation to $25,000, despite setback worries.
Technical indicators: rare pattern in progress
Bitcoin daily chart shows that the flagship crypto held several key supports along its monthly rally, spurred on by growing accumulation. Since Jan 1, BTC has sought assistance near $20,700 and $22,600, suggesting the support lines could still be relevant in case of a setback.
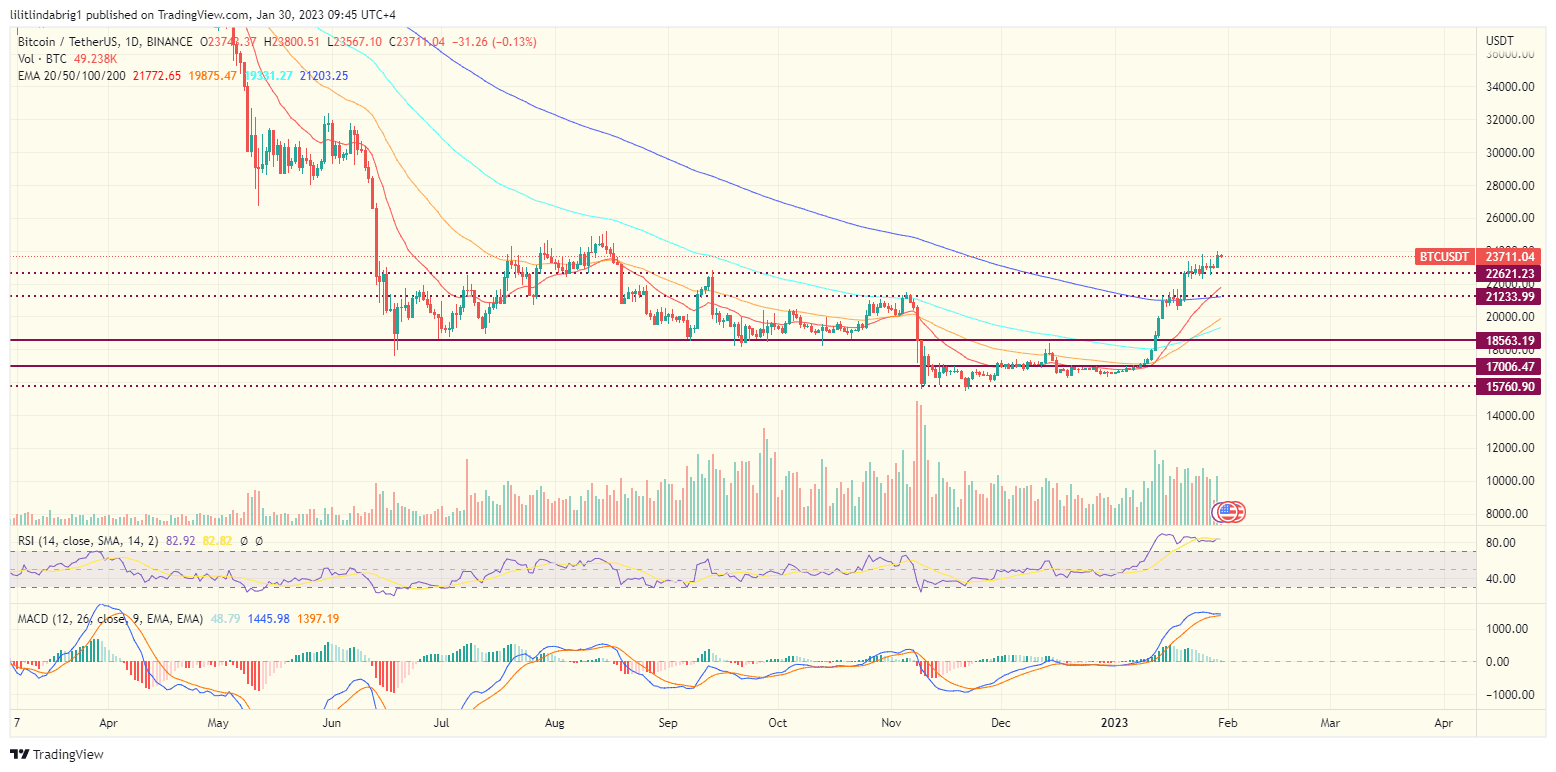
However, veteran investor Peter Brandt thinks the price appreciation could continue to “at least” $25,000. The expert saw an “extremely rare” technical setup at play, dubbed the “double-walled fulcrum pattern.”
The correct interpretation of the bottom in Bitcoin is a double-walled fulcrum, bordering on a compound fulcrum. […]The initial target of 25,500 is within striking distance, and it is EXTREMELY important for Bitcoin to reach this level quickly, lest severe testing of the fulcrum could occur.
commented Brandt in his TradingView analysis. 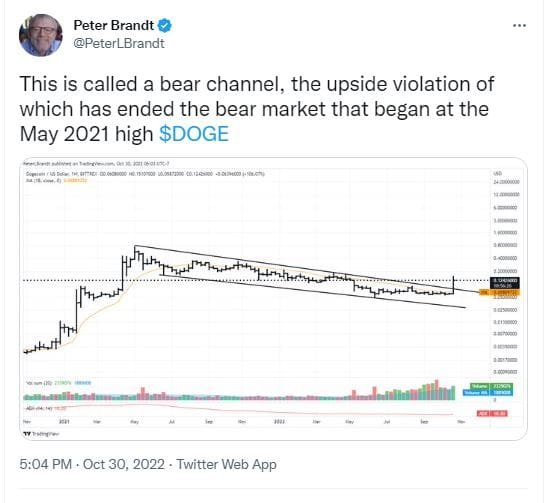
BTC Weekly Chart is Also Bullish
The higher timeframe technicals supported the bullish prognosis. Bitcoin’s weekly chart indicated that the alpha crypto conquered a confluence of resistance in January. Firstly, the digital asset broke a down-sloping trendline that hindered the upside attempts since Nov 2021.
Also, BTC/USD traded above the flat $22,000 resistance on Jan 30 after retesting the said line as support on multiple occasions from Jan 21-28.
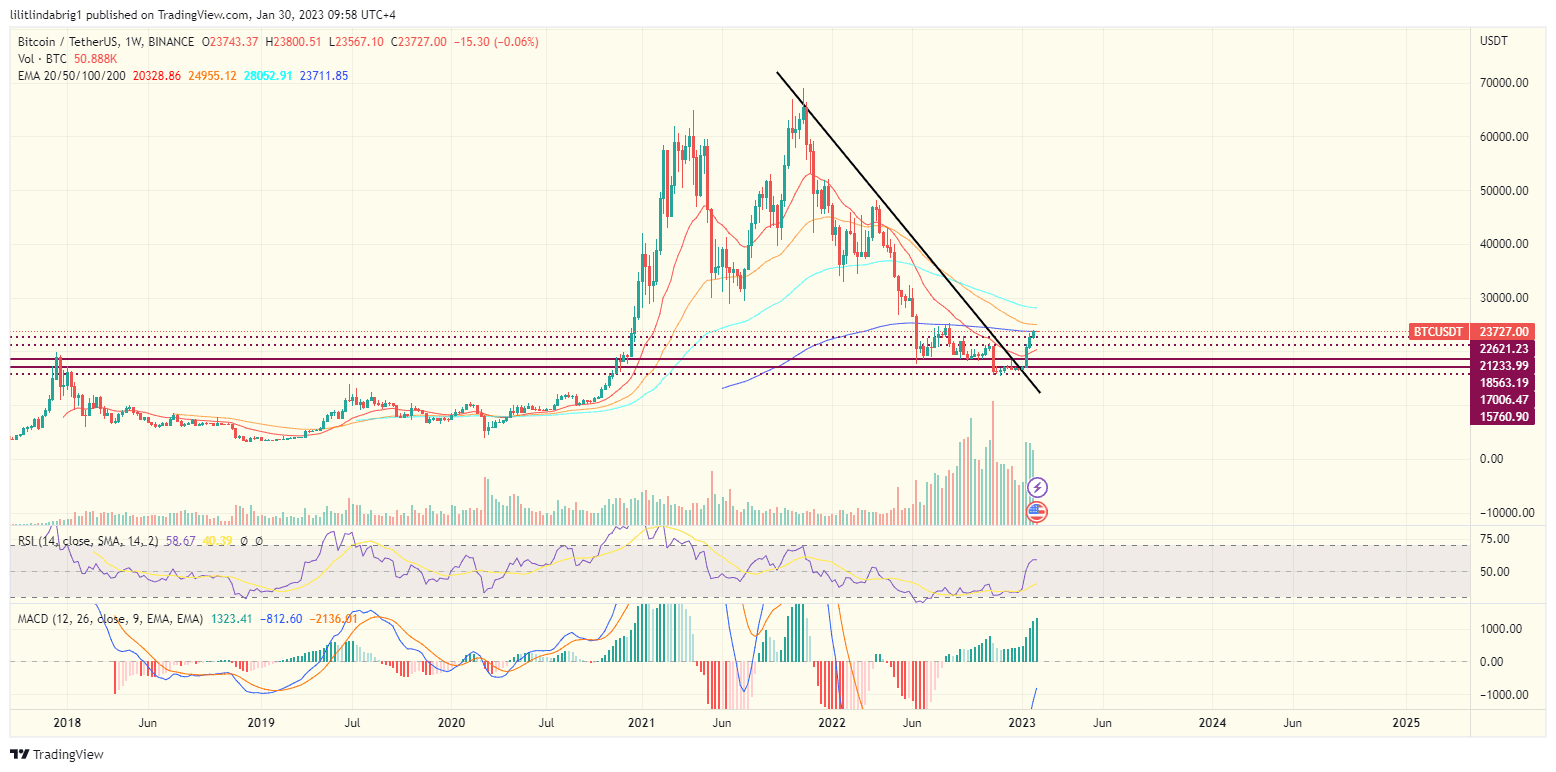
Notably, the BTC price action recoiled from its 200-week exponential moving average (EMA-200; blue wave), hinting at a possible setback. However, if the bulls double down, Bitcoin could reach the $25,000 target in the week ahead.
“Greedy” Accumulation
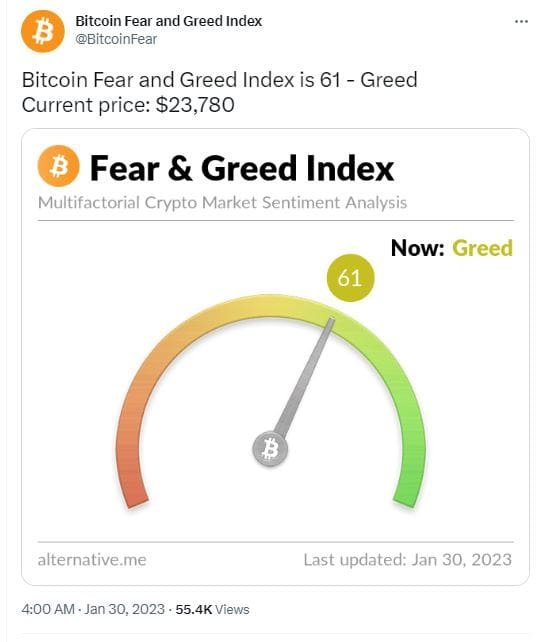
The Bitcoin “fear and greed” index stood at 61 on Jan 30, pointing to an ongoing “greed” phase. In detail, the index generates a number between 0 to 100.
A low value indicates a state of fear, implying that the market traders are selling. Conversely, a “green” value denotes that the market is going through a phase of greed, hinting that traders in the market are in the mood to buy more.
Also read: Are US and EU Hypocrite While Treating Russia Like “Pariah State?”
Bitcoin Bulls Growth
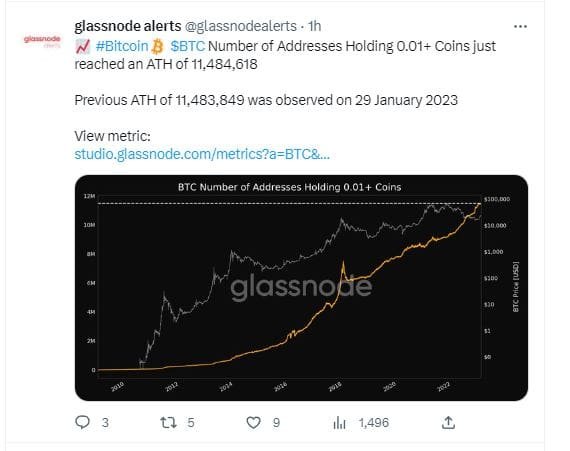
Moreover, the crypto analytical platform Glassnode noted that the number of non-zero BTC accounts reached another record high. Furthermore, the number grew by another thousand wallets in the previous 24 hours.
Also read: Bitcoin price over $22K – bull market cycle or dead cat bounce?
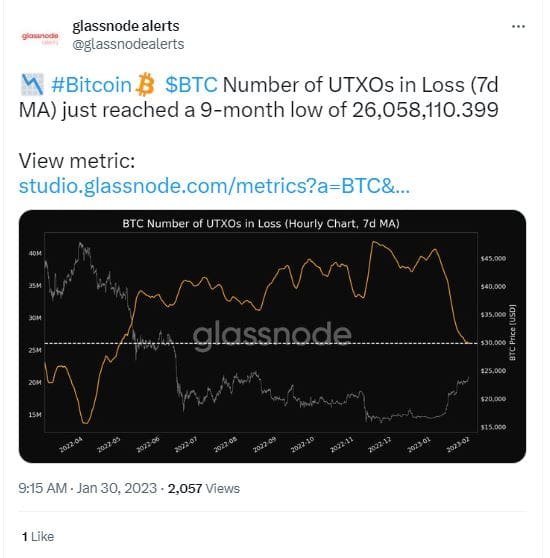
Additionally, according to another Glassnode tweet, the number of addresses in loss reached a 9-month low due to the recent price surge. However, the metrics could also signal a growing number of new wallets that purchased BTC during the ‘plateau’ period Nov-Dec, 2022.
Also read: Crypto Sector Attracts Over $700M in Funding Entering 2023.
Judging by the metrics presented above, the Bitcoin rally has not fizzled out just yet, albeit temporary setbacks and ‘flat’ price action periods are not out of the question. However, traders should also take macro factors into account due to the crypto’s high dependency on the stock market and, by extension, the Federal Reserve’s monetary policy.
FOMC Meeting
In January, the cryptocurrency market soared in tandem with the stock market. However, the upcoming Federal Open Market Committee (FOMC) meeting on Feb 1 could change the market dynamic if the broader tightening policy continues.
Some analysts think the Fed will continue raising the federal funds rate. For example, Chris Vermeulen, the founder and chief investment officer of The Technical Traders, insisted the stock market index S&P 500 (SPX) is due to slide 37% lower than its current position.
Moreover, according to the executive, the precious metals will likely rise against the falling stocks.
I honestly think that the S&P 500 could fall another potential 37 percent, roughly, from current levels. That is enough to create a lot of damage, a lot of stress, lots of bankruptcies; you name it. This is when precious metals and miners take off.
said Vermeulen. 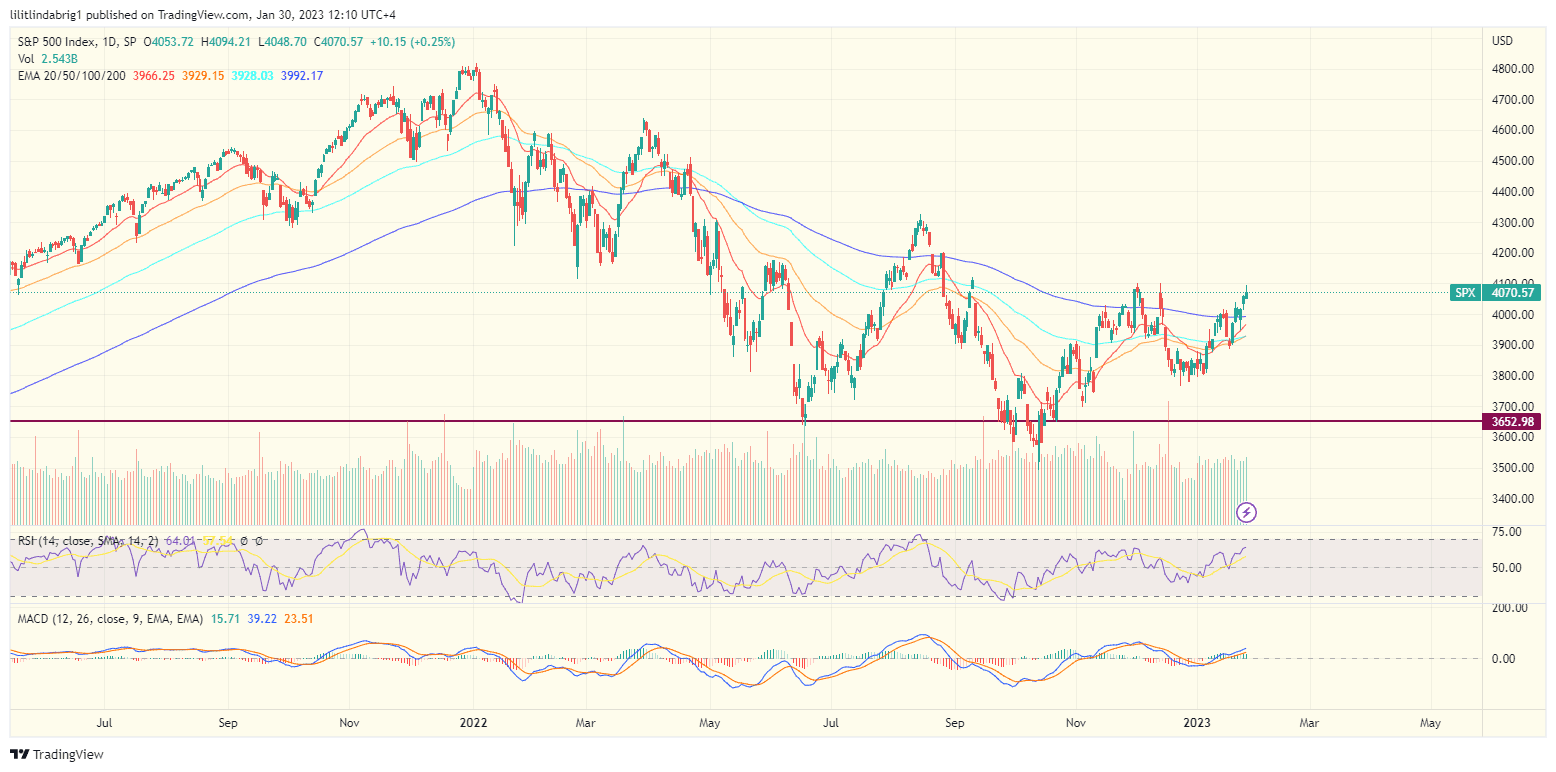
Also read: Bitcoin outperforms Gold in 2023 so far – bullish reversal, or dead cat bounce?
Market strategist under the pseudonym “The Carter” agreed with the bearish outlook, noting “there will be blood on Feb 1.” However, the analyst was certain that Fed Chair Jerome Powell would continue to address the inflation head-on and pump the interest rates.
At the November FOMC, he referred to the “broader tightening project” as having three stages: 1) rapid hikes to get to neutral, 2) measured hikes to get to “sufficiently restrictive”, and 3) staying at the terminal rate for some time.
noted The Carter. Bill Tai, a venture capitalist and crypto veteran told CNBC in early January that he sees “a chance that [bitcoin] kind of has bottomed,” with no word on a possible bull run.
Meltem Demirors, chief strategy officer at CoinShares, did not have an overly bullish prognosis either. She said Bitcoin is likely to be rangebound, trading between $15,000 and $20,000 at the lower end and between $25,000 to $30,000 on the upper end.
The expert also noted that there isn’t much money in the digital asset sector.
Conclusion
Bitcoin’s double-digit rally has been the bullish move the flagship crypto has seen since 2021. However, while Brandt’s $25,000 prediction could be on point, the crypto bulls might not have much time to celebrate due to broader market conditions.
The on-chain metrics have been favorable for months, pointing to a BTC bottom. However, bottoming out does not equal a bull run. Instead, the top digital asset could enter another accumulation phase, ‘hibernating’ until the fiat economy greenlights another confident surge.
The upcoming FOMC meeting will shed more light on the monetary policy for 2023 and, by extension, on the digital asset sector.

… [Trackback]
[…] Find More Info here on that Topic: coinchapter.com/bitcoin-could-easily-rally-to-25k-but-what-afterward/ […]
… [Trackback]
[…] Find More Information here to that Topic: coinchapter.com/bitcoin-could-easily-rally-to-25k-but-what-afterward/ […]