
Goris (CoinChapter.com) — Those who bought BitTorrent’s BTT token at its year-to-date high now face the prospect of waiting too long to see their investment turn up profits.
It is because the BTT/USD exchange rate is now down more than 60 percent from its record peak of $0.013, achieved in the first week of April. As of Monday, the pair was trading for as low as $0.005. Meanwhile, in late April, it was down at $0.0042.
So it appears, the BitTorrent token became the victim of aggressive profit-taking, especially after its supersonic rally at the beginning of this year. Before correcting lower, BTT/USDT had rallied by as much as 4,627 percent on a year-to-date timeframe. The upside gains were more than adequate to cash-out. So it did.
Read more: Altcoins in Focus on 11/05/2021: Reef, Cardano, Holo, BitTorrent, Wink
But the biggest challenge for BitTorrent did not come from sellers in its market. It instead came from the pumped-up demand from rival tokens, including Dogecoin, a meme cryptocurrency that rose to global fame after billionaire entrepreneur Elon Musk openly proclaimed himself as its fan. The same sentiment led to a drop in the Bitcoin prices, albeit their downside scope appeared limited.
Mid-cap tokens like BTT have now entered an overlong downside consolidation phase. They now test support levels that were resistances during their uptrend. BTT/USDT — in particular — hints at logging extended losses as it feels weaker in the absence of concrete fundamentals.
BitTorrent in Falling Wedge
BitTorrent now tests the lower trendline of a structure that constitutes a Falling Wedge pattern. In retrospect, Falling Wedges are bullish reversal signals which appear when prices fall within a range defined by two falling contracting trendlines. These trendline eventually converge at an apex. Meanwhile, the price attempts to break out of the range to the upside to target a bullish level that is situated as high as the maximum Wedge height.
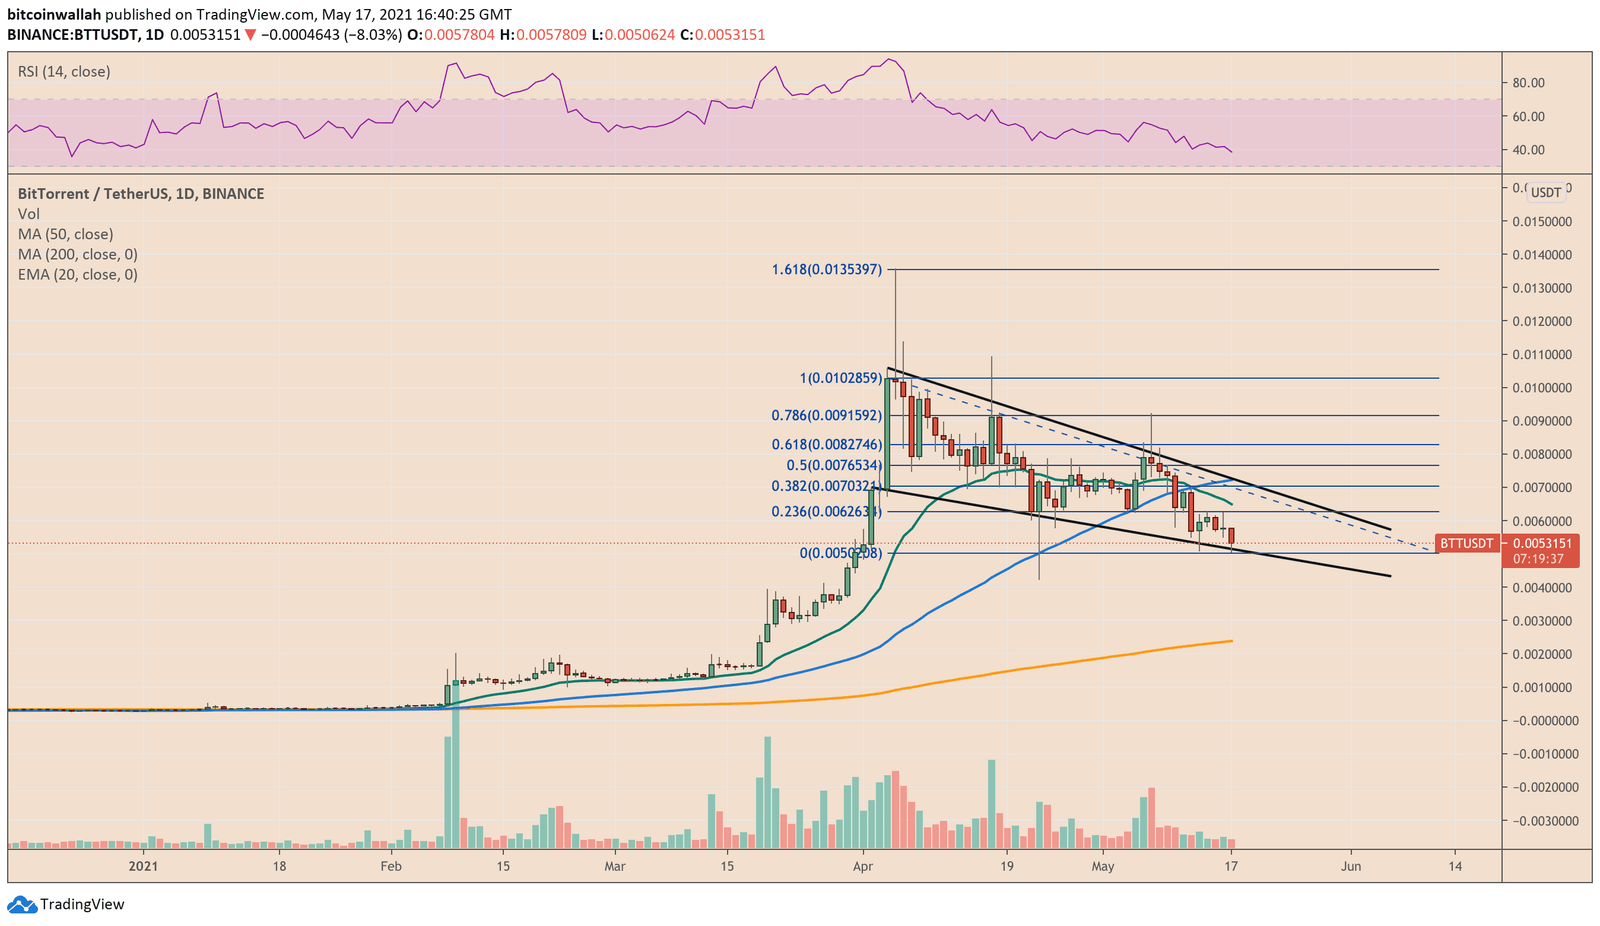
That said, BTT/USD expects to bounce higher from the lower trendline to initially target the upper trendline, which coincides with the 0.328 Fib line at $0.007. If the price continues breaking upward, then trades could enter a long entry towards $0.00765, $0.0082, and so on.
Conversely, a break below risks invalidating the bullish structure. Then, the price can fall to as low as the 200-day moving average (the orange wave in the chart above).

… [Trackback]
[…] Read More Information here on that Topic: coinchapter.com/bittorrent-btt-lost-more-than-half-its-value-in-less-than-two-months/ […]
… [Trackback]
[…] Here you will find 98941 more Info on that Topic: coinchapter.com/bittorrent-btt-lost-more-than-half-its-value-in-less-than-two-months/ […]