
Key Takeaways:
- Solana system outage was one of the factors that influeced the price correction.
- The main culprit behind the downtrend was Bitcoin, which lost 20% in the same period.
- The SOL/USD daily chart flashed bullish signs.
YEREVAN (CoinChapter.com) – A recent 724% price rally in Solana (SOL) markets prompted a majority of traders to secure their profits instead of adding new bullish positions near its record high of $216. As a result, the blockchain asset underwent a major correction in the days ahead, now trading around 40% lower from its previous peak.
Solana system outage
Solana suffered a network disruption on Sep. 14, and lost 5%, while $11 billion of investors’ money was locked for more than 17 hours.
Also read: Solana Mainnet Beta forced to restart: intermittent instability sends SOL down 16%
The outage occurred because of a heavy transaction load, that reached 400,000 TPS (transactions per second). On Sep. 20, Solana published a report, explaining the course of events.
“The cause of the network stall was, in effect, a denial-of-service attack. At 12:00 UTC, Grape Protocol launched their IDO on Raydium, and bots generated transactions that flooded the network. These transactions created a memory overflow, which caused many validators to crash, forcing the network to slow down and eventually stall.”
read the report. While the outage influenced the SOL price action, Solana was still sensitive to the overall climate of the crypto market. The latter is more often than not, dictated by Bitcoin.
Bitcoin’s lead
When Bitcoin sneezes, the rest of the market catches a cold.
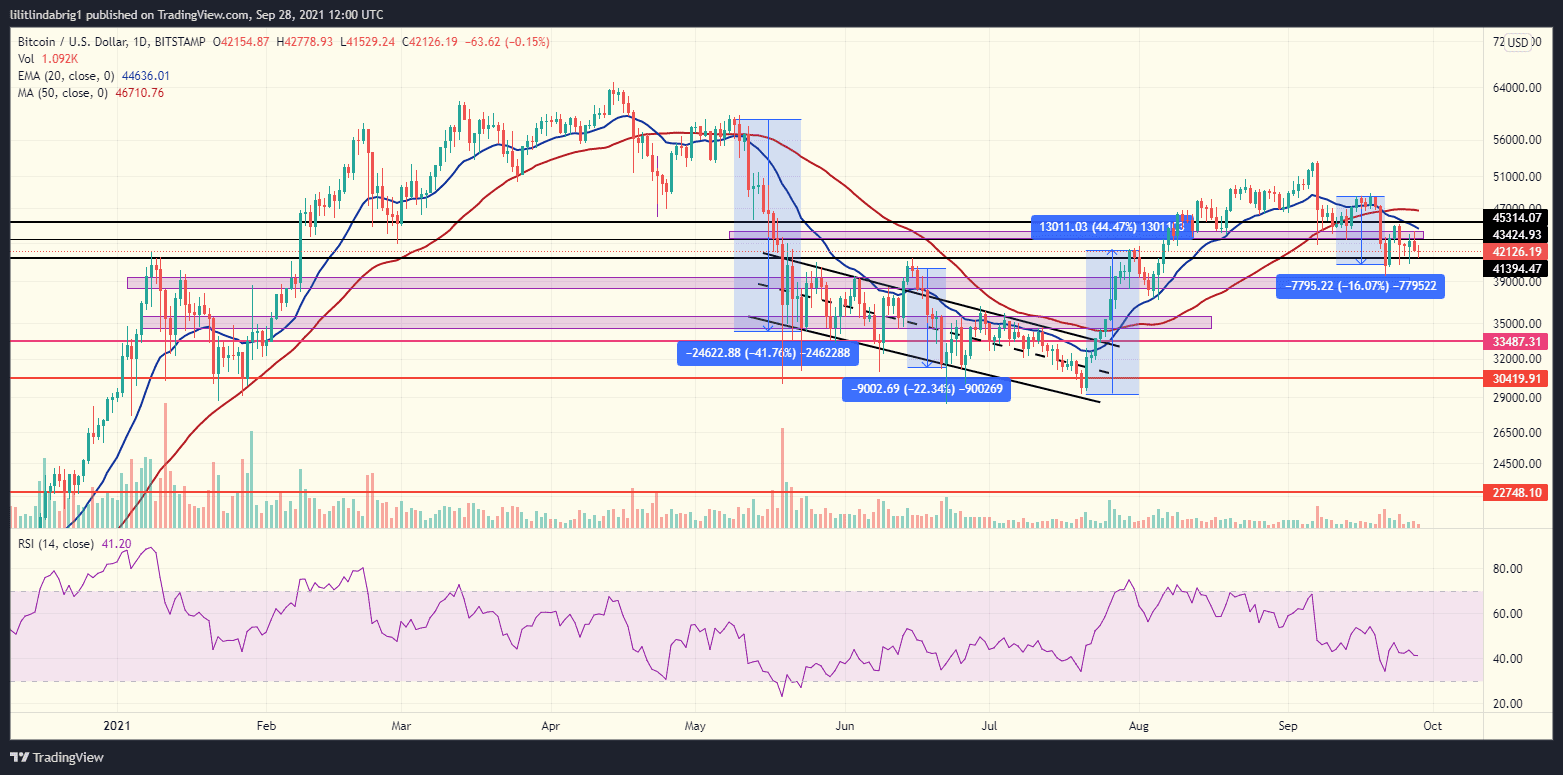
Solana did stoically resist any consolidation throughout August, but the sell-off pressure generated by Bitcoin losses got heavy in September. The alpha cryptocurrency lost 20% since the downtrend started on Sep. 7. But Solana lost considerably more, like many other altcoins.
The consolidation is ongoing, albeit with no sharp downtrend. Bitcoin’s price action did not climb over the $45,000 line for over a week and the 20-day exponential moving average (EMA-20; blue wave on the chart below) kept the BTC token from breaking out.
Despite Bitcoin’s bearish influence, Solana flashed a bullish pattern on the daily chart, that predicts further gains in the upcoming sessions.
Also read: Silvergate emerges as a proxy crypto investment following Morgan Stanley’s endorsement
Solana daily chart
Since Sep. 5 SOL has been trading in a formation called a bull flag. The pattern occurs after a rapid uptrend (flagpost) and consists of two parallel trendlines (much like the descending channel) that drive the price south. While the descending channel does not predict any particular continuation, a bull flag signifies an upcoming surge.
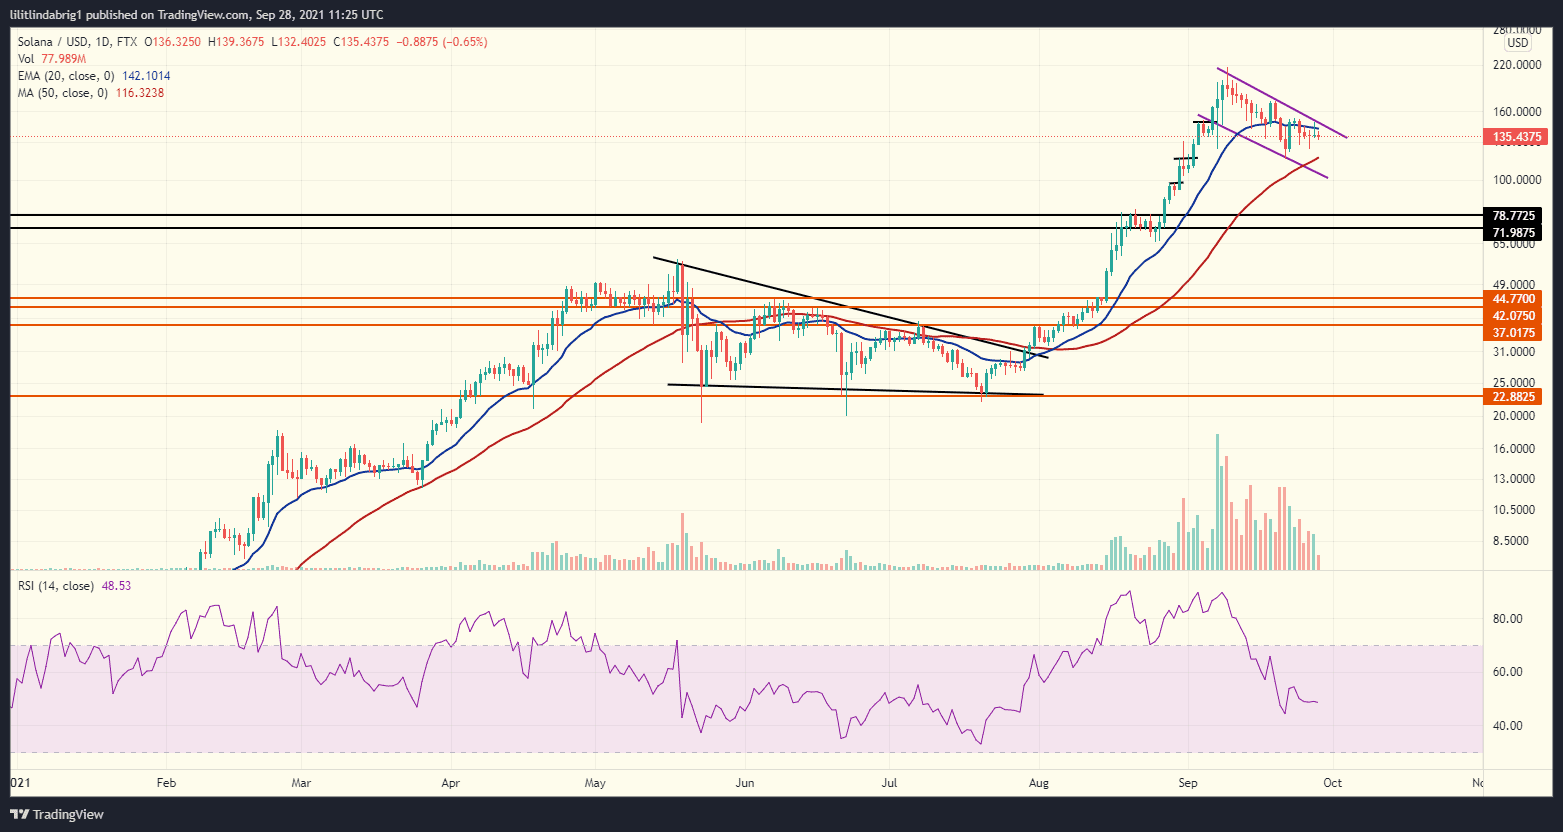
The bull flag also resulted in the stabilization of the relative strength index (RSI), which charted through “overbought” territory (over 70) for the month preceding the system crash. In detail, the RSI is a momentum indicator that reflects the traders’ overall perception of whether a digital asset is a profitable investment.
At the moment of writing the SOL/USD pair traded at $134 in the European Tuesday session and the RSI stood at a reasonable 50.
Also read: Ethereum bubble warnings return as ETH struggles below $3K

… [Trackback]
[…] Find More to that Topic: coinchapter.com/bull-flag-appears-on-solana-charts-as-sol-drops-over-40-from-record-high/ […]
… [Trackback]
[…] Here you will find 48555 additional Info on that Topic: coinchapter.com/bull-flag-appears-on-solana-charts-as-sol-drops-over-40-from-record-high/ […]
… [Trackback]
[…] There you will find 35676 more Info to that Topic: coinchapter.com/bull-flag-appears-on-solana-charts-as-sol-drops-over-40-from-record-high/ […]
… [Trackback]
[…] Find More here to that Topic: coinchapter.com/bull-flag-appears-on-solana-charts-as-sol-drops-over-40-from-record-high/ […]