
NEW DELHI (CoinChapter.com) — Cardano (ADA) prices confirmed a bearish pattern, called the bearish flag, on June 14, which might have it face further selling pressure.
In detail, the pattern forms when a cryptocurrency’s prices chart a sharp countertrend (the flag) after a short-lived trend. Flag patterns usually indicate a reversal of the countertrend. In addition, in a bearish pattern, volume might not always decline during consolidation.
Since an uptrend marks the consolidation period after a sharp downtrend, investors move in due to FUD from the price fall. Hence, higher than average volumes often accompany the consolidation period.
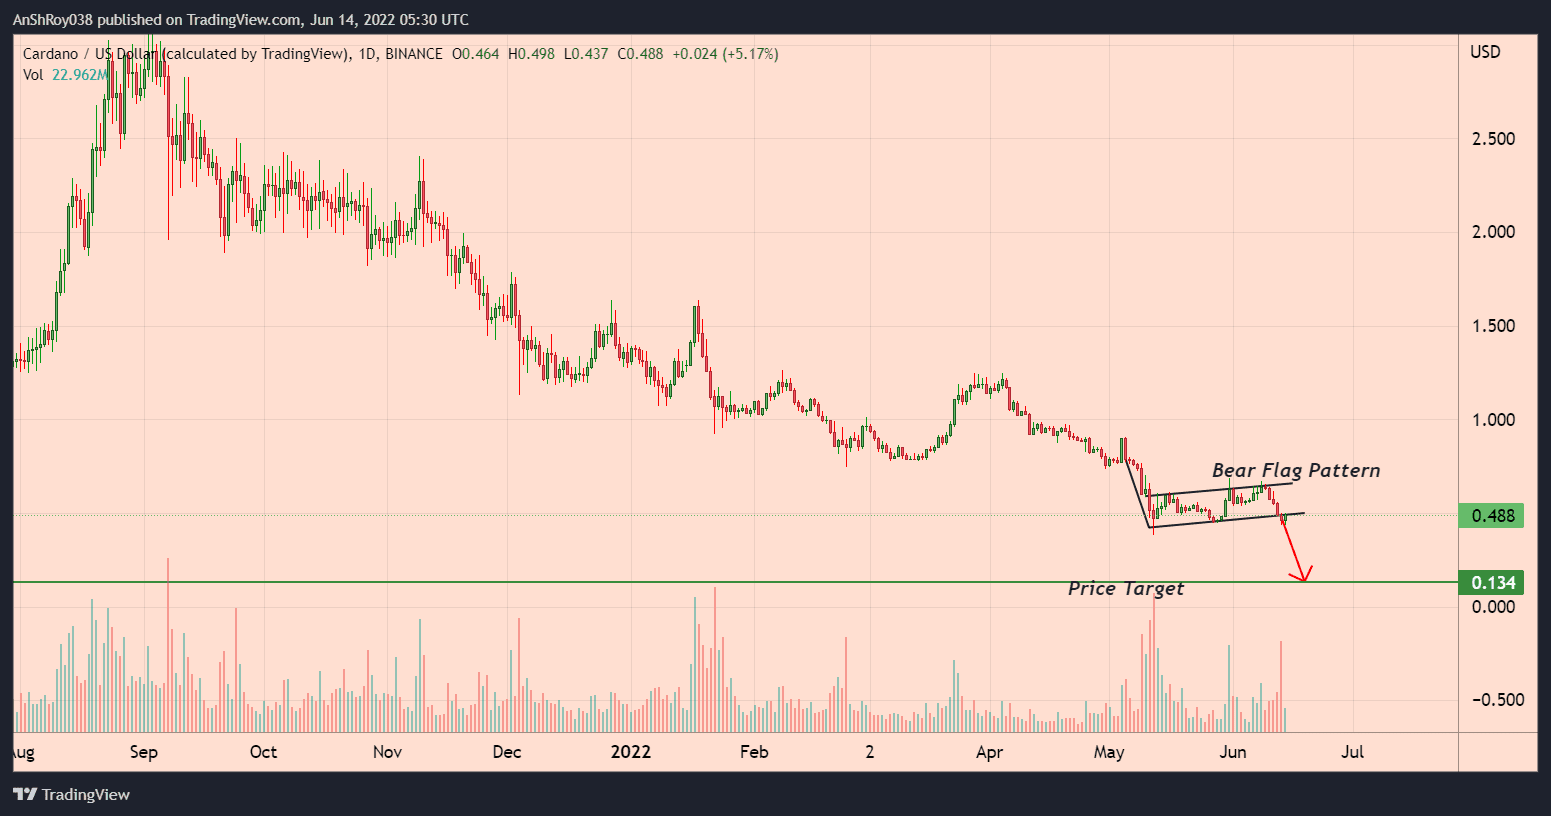
Traders calculate the bear flag pattern’s price target by subtracting the flagpole’s length from the breakout price level. As a result, ADA prices face a fall to $0.134, a 72.5% drop from current prices.
Also Read: Cardano eyes relief rally as ADA paints a “double doji” pattern.
However, the long lower wicks on the daily candles indicate that bulls aggressively defend the lower price levels. For example, ADA prices jumped nearly 14% on Jun 14 between the day’s low ($0.437) and high ($0.498) levels.
ADA’s MACD Charts Bearish Crossover
Meanwhile, trend-based momentum indicator MACD charted a bearish crossover for ADA on Monday.
A bearish crossover occurs when the MACD line (difference of 12-day and 26-day EMA) moves below the MACD signal line (9-day EMA of MACD). Traders usually consider the chart pattern as a sell signal. Hence, the technical chart pattern might see the altcoin’s prices face a further downtrend.
A downtrend might force ADA to test support near $0.43, which has supported Cardano price action since May 12. If the immediate support fails, ADA prices might fall to support near a multi-month descending trendline at $0.39.
The trendline support has repeatedly arrested Cardano’s downtrend since September 2021.
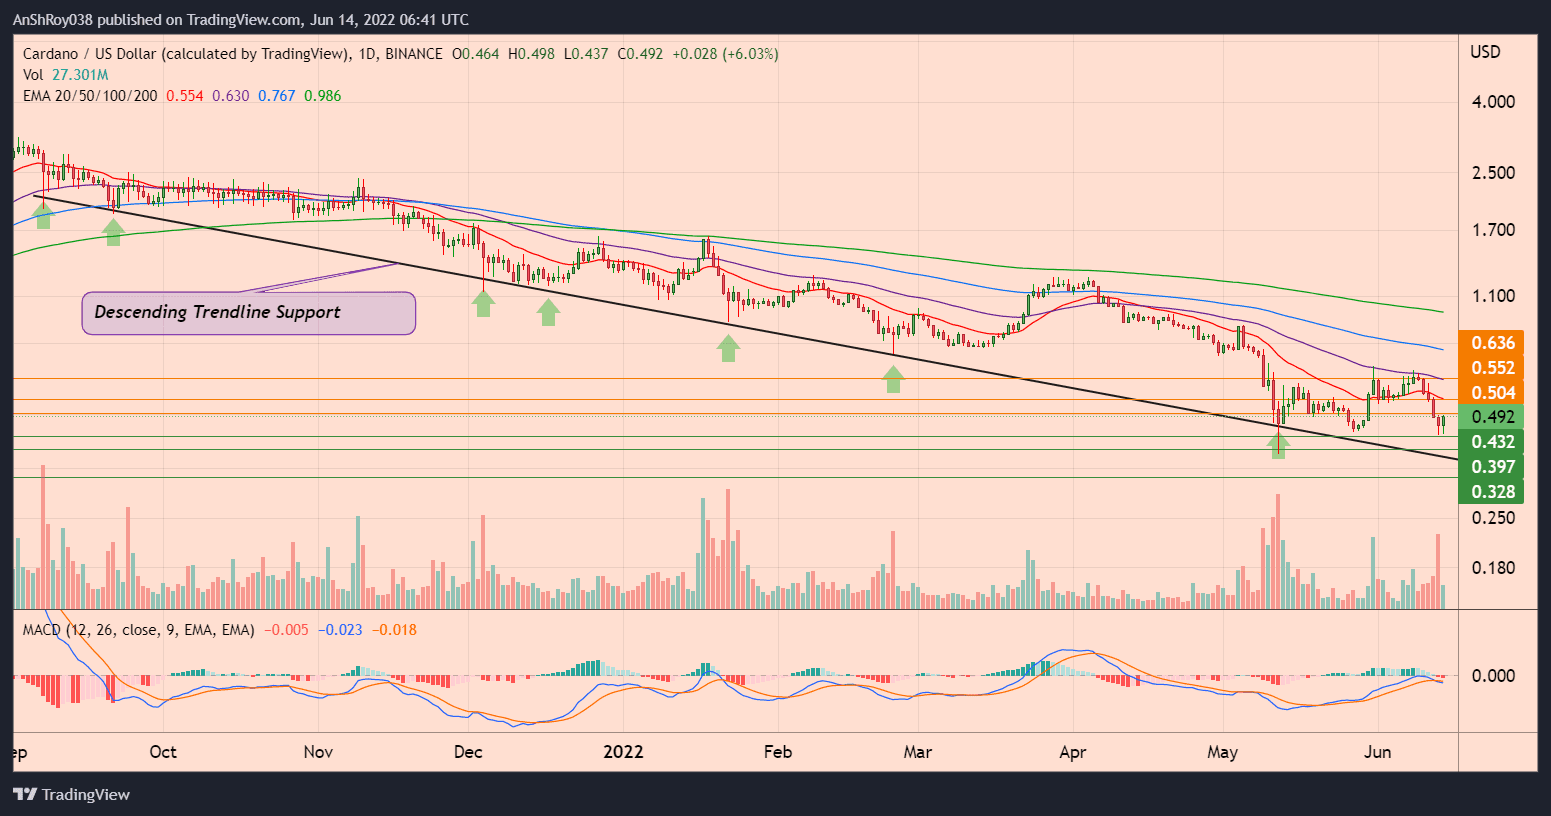
Finally, if ADA falls below the trendline support, Cardano prices could continue trending downwards to support near $0.328.
Also Read: Cardano (ADA) soars over 50% in four days — a bull trap?Conversely, if bulls continue to push prices upwards, ADA would first need to conquer immediate resistance near $0.5. Then, a break and consolidation above immediate resistance might see ADA prices target resistance from their 20-day exponential moving average (20-day EMA, red wave) near $0.55.
In addition, a sustained uptrend could result in ADA prices challenging resistance from their 50-day EMA (purple wave) near $0.64 before corrections pare gains.
At the time of writing, ADA was trading at $0.49, up 7.1% intraday at press time.

… [Trackback]
[…] Find More on to that Topic: coinchapter.com/cardano-risks-another-72-5-price-crash-as-ada-breaks-out-of-bear-flag-pattern/ […]
… [Trackback]
[…] Find More to that Topic: coinchapter.com/cardano-risks-another-72-5-price-crash-as-ada-breaks-out-of-bear-flag-pattern/ […]
… [Trackback]
[…] Read More Info here to that Topic: coinchapter.com/cardano-risks-another-72-5-price-crash-as-ada-breaks-out-of-bear-flag-pattern/ […]
… [Trackback]
[…] Find More Information here on that Topic: coinchapter.com/cardano-risks-another-72-5-price-crash-as-ada-breaks-out-of-bear-flag-pattern/ […]
… [Trackback]
[…] There you will find 88663 more Information on that Topic: coinchapter.com/cardano-risks-another-72-5-price-crash-as-ada-breaks-out-of-bear-flag-pattern/ […]
… [Trackback]
[…] Info on that Topic: coinchapter.com/cardano-risks-another-72-5-price-crash-as-ada-breaks-out-of-bear-flag-pattern/ […]