

NOIDA (CoinChapter.com) — Chainlink has lined up some bullish cues that could see LINK prices skyrocket to a new all-time high. The bull run could attract more buyers to the market, helping the rally continue.
One of the bullish cues for the Chainlink token comes from the project’s expansion of the v0.2 staking program. After increasing the staking capacity to 45 million LINK from 25 million, the program saw a rapid filling of its capacity. The surge in staking highlights a heightened interest among traders.
Moreover, staking programs can help bolster the network’s security and increase user engagement, creating a more robust ecosystem for Chainlink.
Additionally, a mysterious whale recently accumulated a significant amount of LINK tokens. In a span of just 5 days, the whale collected over 4.5 million LINK through multiple wallets. Whale movements can often sway market dynamics due to the sheer volume of the transactions.
Another Bullish Cue For Chainlink Price
The LINK/USD pair has formed a ‘falling wedge‘ pattern, visible on the monthly time frame.
A pair of converging trend lines form the falling wedge pattern. The pattern occurs when an asset’s price makes lower highs and lower lows, with lows being steeper than highs.
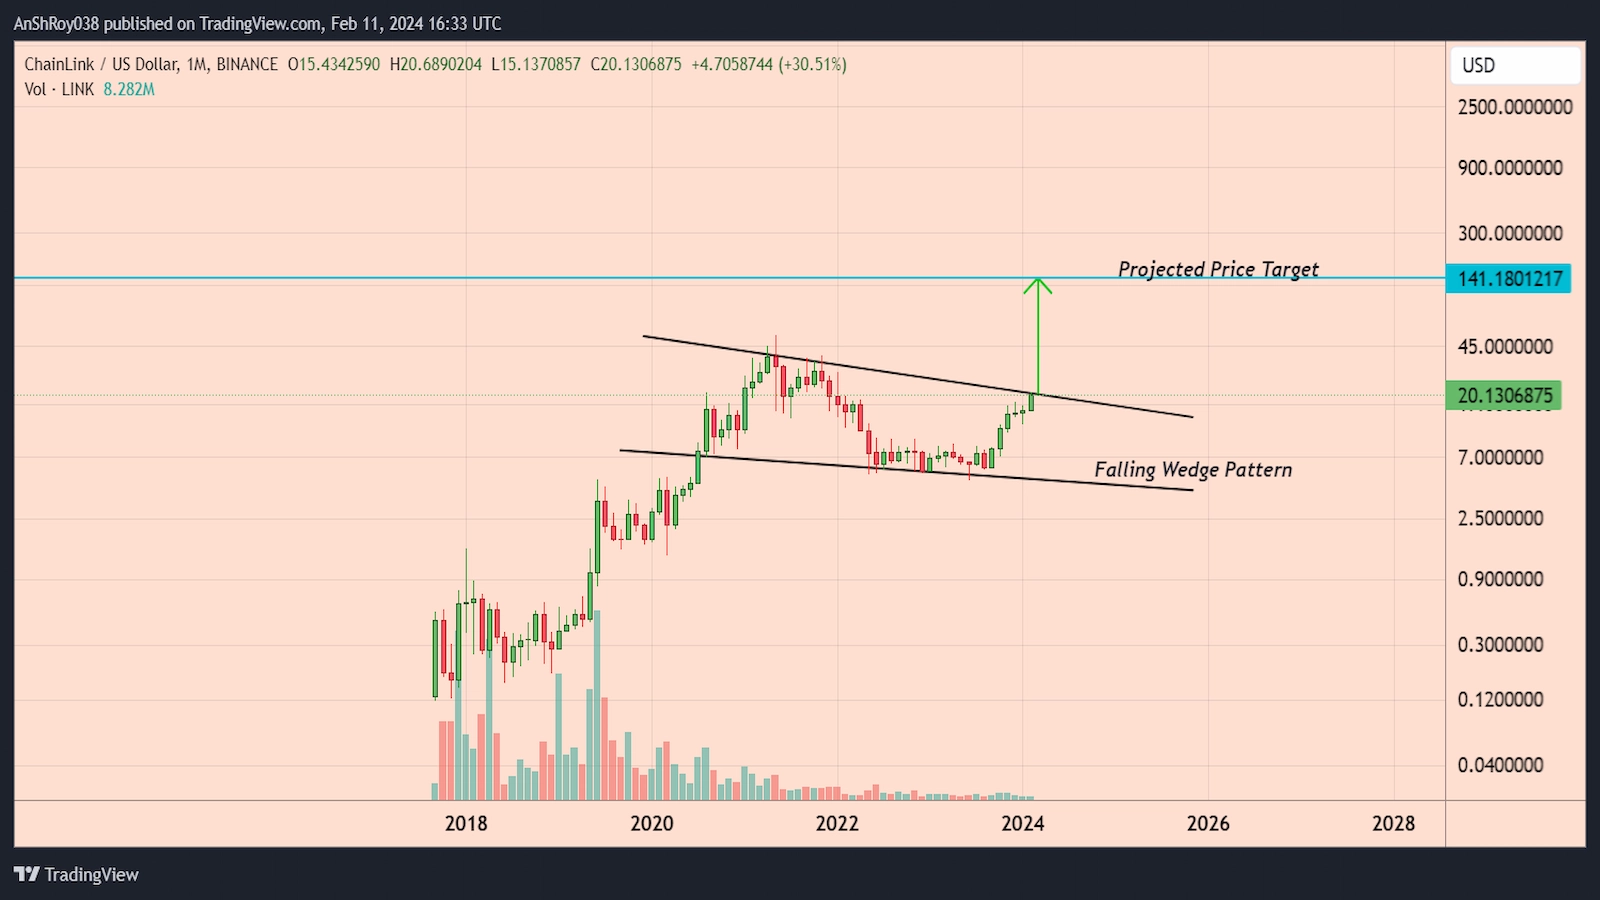
The pattern typically signals that a reversal to the upside is likely. The price target for the pattern is equal to the widest distance between the trend lines at the start of the pattern added to the breakout point.
A breakout with substantial volume can signify strong market conviction, thereby increasing the likelihood of continuing the trend.
Per the rules of technical analysis, LINK price could spike over 601% to reach a theoretical price target near $141 if the pattern pans out. Historically, the pattern has been a precursor to significant bullish runs when accompanied by increased trading volume.
For Chainlink, the resolution of this pattern could lead to a considerable appreciation in price if the market conditions align. Traders often look for a decisive close above the upper trend line of the wedge to confirm the breakout before considering a long position.
LINK Price Faces Bearish Risk From RSI
LINK price has been on a bull run since Jan. 26, rising nearly 52% to reach a daily high near $20.7 on Feb. 11. However, the uptrend faces bearish risks from the moment oscillator RSI, which has entered the overbought region with a score of 71.01 on the daily charts.
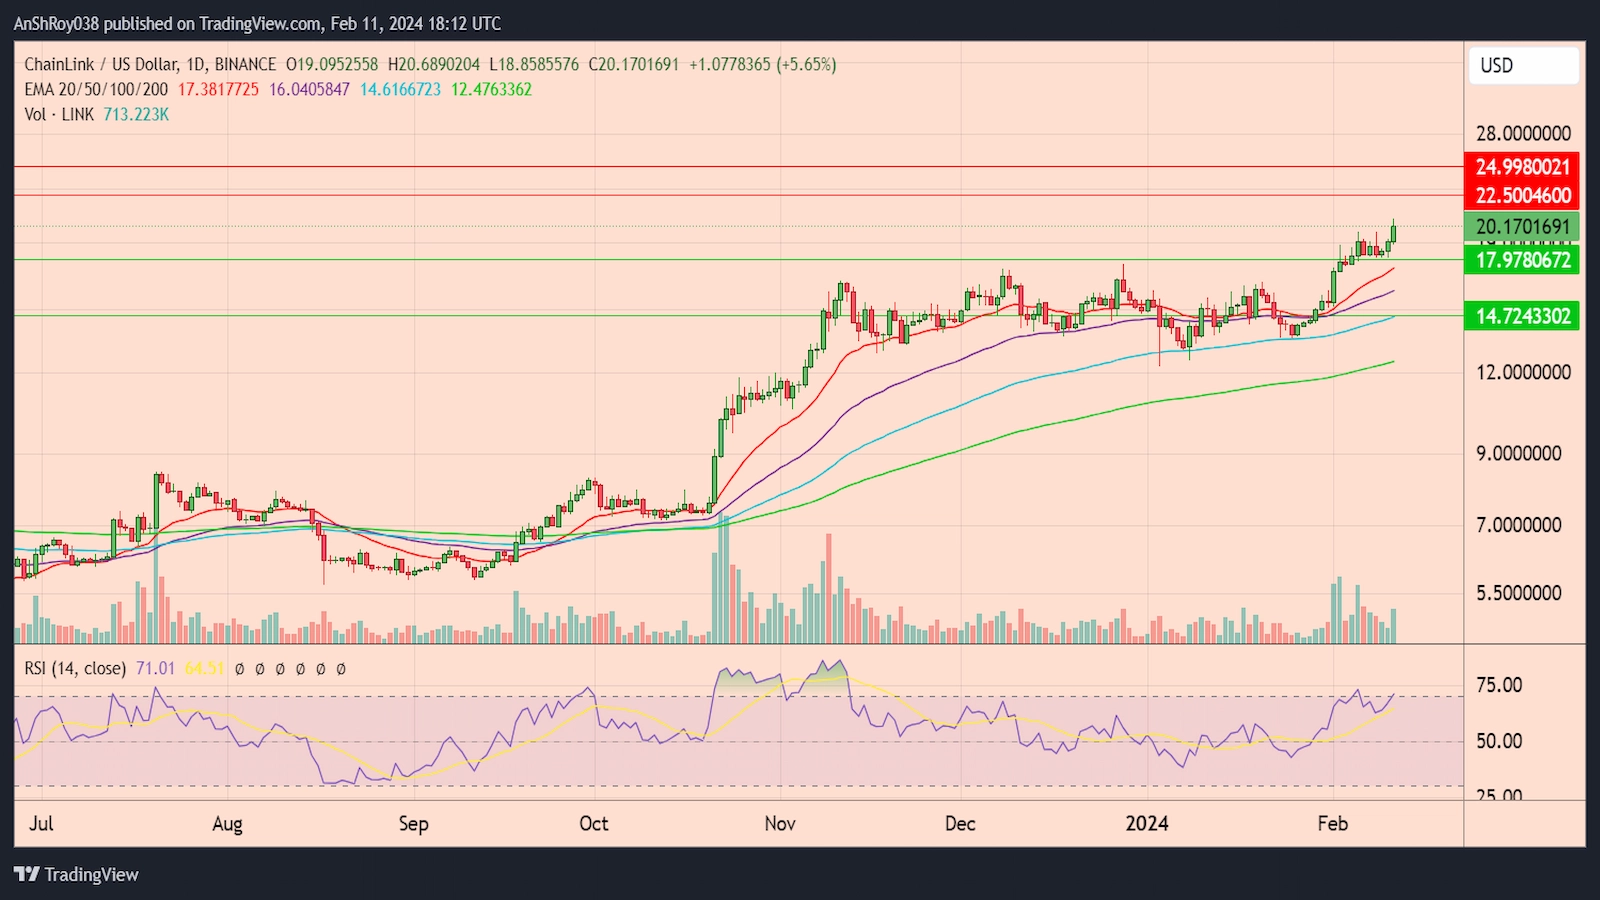
As such, bears would likely try to push LINK price to the support near $18. Moreover, breaching the immediate support level could force the Chainlink token to test its 100-day EMA (blue wave) support near $14.7.
However, should the Chainlink bullish cues help the token start a rally, LINK price could reach the resistance near $22.5. Flipping the immediate resistance might help Chainlink price target the resistance near $25 before correcting.

… [Trackback]
[…] Find More here to that Topic: coinchapter.com/chainlink-eyes-new-ath-as-bullish-cues-line-up/ […]
… [Trackback]
[…] Find More on on that Topic: coinchapter.com/chainlink-eyes-new-ath-as-bullish-cues-line-up/ […]
… [Trackback]
[…] Read More on on that Topic: coinchapter.com/chainlink-eyes-new-ath-as-bullish-cues-line-up/ […]
… [Trackback]
[…] Read More to that Topic: coinchapter.com/chainlink-eyes-new-ath-as-bullish-cues-line-up/ […]
… [Trackback]
[…] Read More to that Topic: coinchapter.com/chainlink-eyes-new-ath-as-bullish-cues-line-up/ […]