
Key Takeaways:
- Chainlink has partnered with Arta TechFin, one of the participants in Hong Kong’s CBDC experiment.
- LINK prices have rallied nearly 20% in November 2023.
- The token’s rally helped it invalidate a bearish pattern.
NEW DELHI (CoinChapter.com) — Chainlink (LINK) continues to reap the benefits of its involvement with the Society for Worldwide Interbank Financial Telecommunications (SWIFT).
The blockchain platform’s work with SWIFT has helped Chainlink open new avenues for partnerships. Now, the blockchain oracle network has partnered with Arta Techfin, one of the 16 firms participating in e-Hong Kong dollar (e-HKD CBDC) trials by the Hong Kong Monetary Authority (HKMA).
Arta is a Hong Kong-based financial services institution that recently announced a collaboration with Chainlink Labs on using the Cross-Chain Interoperability Protocol (CCIP).

In the HKMA CBDC trial, Arta demonstrated using e-HKD for programmable payments and the atomic settlement of tokenized funds. Atomic settlement refers to the simultaneous settlement of assets, such that the transfer of one asset occurs only upon the transfer of the other.
Additionally, Arta showcased how it can use CCIP to enable cross-chain atomic settlement of its new tokenized funds.
LINK Price Reaches New Yearly Highs
LINK price restarted rallying on Nov. 3 after a brief period of consolidation, reaching a new yearly high of $12.8 on Nov. 6. The recent bullrun helped the Chainlink token price spike by nearly 22% from Nov. 3’s low of $10.5.
However, the RSI for LINK continues to be overbought, clocking a reading of 78.44 on the daily charts. Overbought RSI levels often precede a consolidation or correction phase for an asset, which is why traders often consider the occurrence a bearish signal.
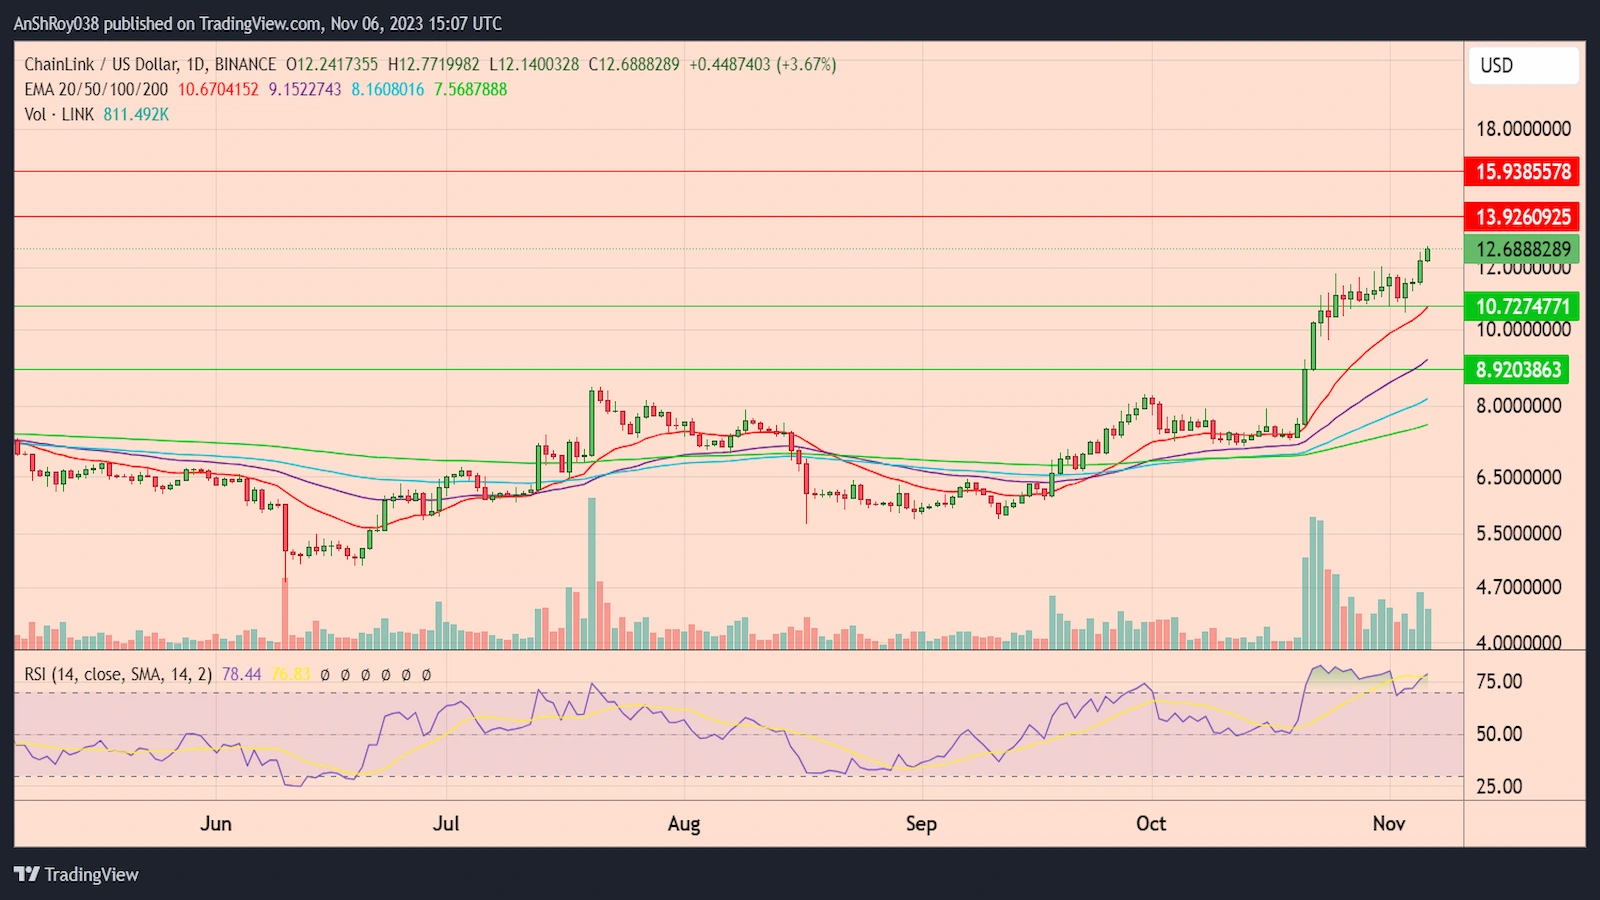
If bears start to book profits, LINK price might drop to the 20-day EMA (the red wave) support near $10.73. Moreover, a breakdown below the immediate support might force the Chainlink token price to test the 50-day EMA (the purple wave) support near $8.9.
Conversely, if the rally continues, the LINK price might rise to the resistance near $14. Furthermore, breaking and consolidating above the immediate resistance might help bulls push the Chainlink token price to the resistance near $16 before correcting.
LINK Breaks Out Of Bearish Setup
The recent bullrun also helped the Chainlink token breakout above a bearish technical setup called the ‘Descending Triangle.’
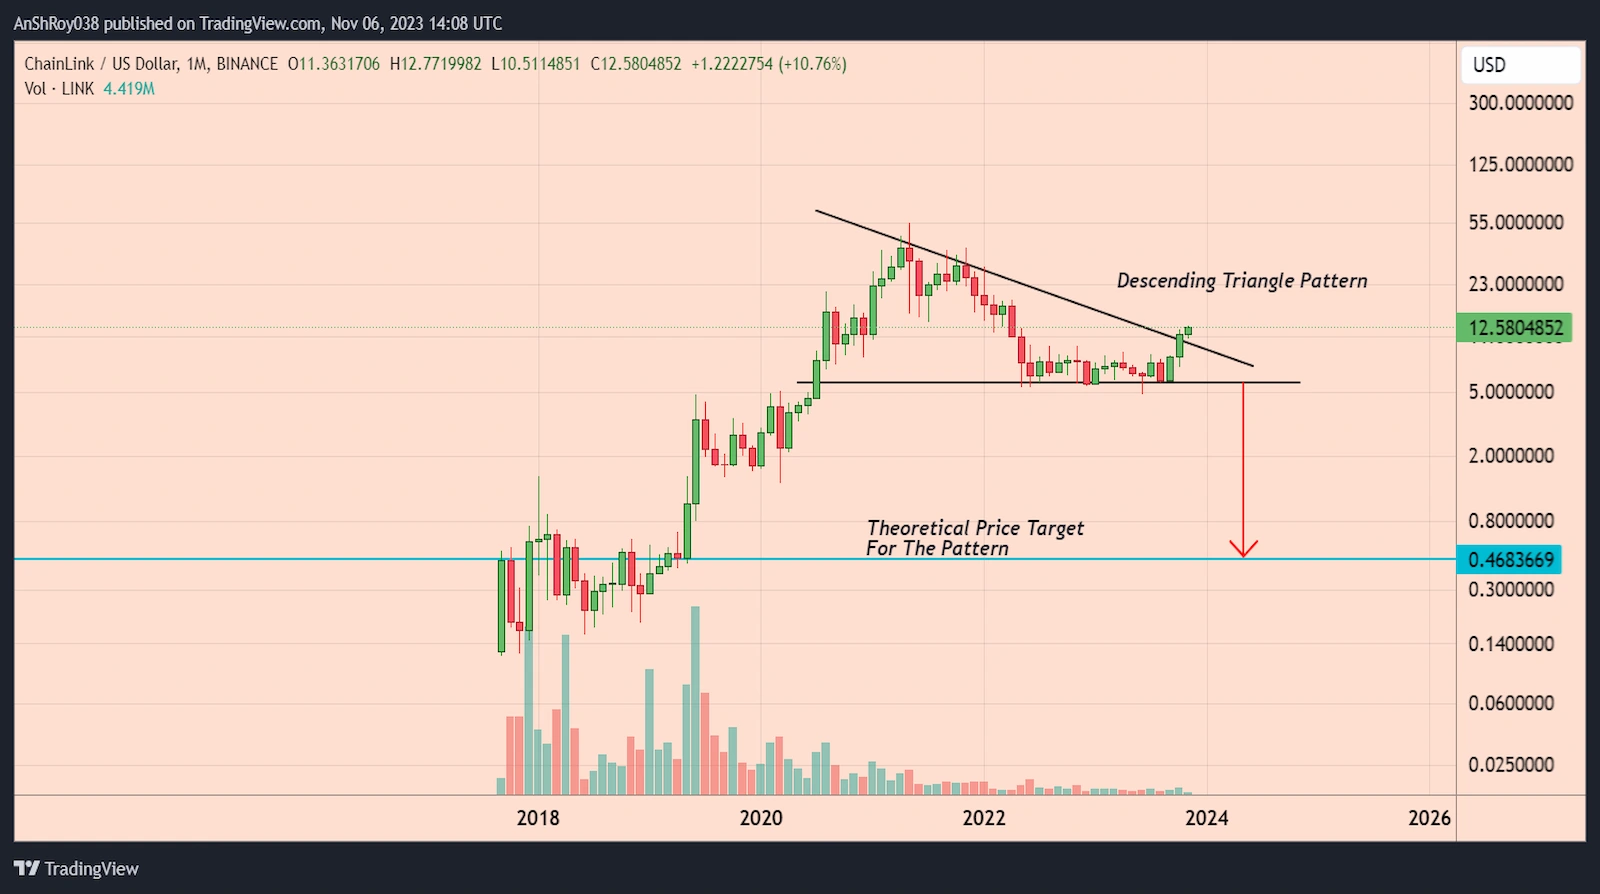
A descending trendline connecting swing highs and a horizontal trendline joining swing lows form the pattern. The height of the triangle’s thickest section determines the price target in a descending triangle setup.
The pattern gave LINK prices a theoretical breakdown target of $0.47, a drop of nearly 91% from the breakdown level.

… [Trackback]
[…] Read More on on that Topic: coinchapter.com/chainlink-link-token-analysis/ […]
… [Trackback]
[…] Find More on that Topic: coinchapter.com/chainlink-link-token-analysis/ […]
… [Trackback]
[…] Info to that Topic: coinchapter.com/chainlink-link-token-analysis/ […]
… [Trackback]
[…] Information to that Topic: coinchapter.com/chainlink-link-token-analysis/ […]