
MANALI (CoinChapter.com) — Convex Finance (CVX) prices shot up by 110% in two weeks as CVX moved from $15.3 on Mar 15 to reach an intraday high of $32.1 on Mar 28.
The Convex Finance token charted consecutive green candles over the last six days, indicating increased interest from traders and investors. In addition, the Convex Finance token’s 20-day EMA (red wave) moved above its 50-day EMA (yellow wave) to form a bullish technical chart pattern called a Golden Cross.
A golden cross is a bullish technical signal that forms when a short-term MA line moves above a relatively long one. Traders and analysts usually interpret the pattern as an indicator of a definitive uptrend in the market.
Also Read: AVAX soars as Avalanche announces Aave and Curve Finance integration to a $180M project.As such, it is likely CVX prices would continue moving upwards, capitalizing on the bullish cues from the golden cross. However, CVX prices would first need to flip resistance at $32.9, a price level that earlier acted as support between Dec 22, 2021, to Jan 21, 2022.
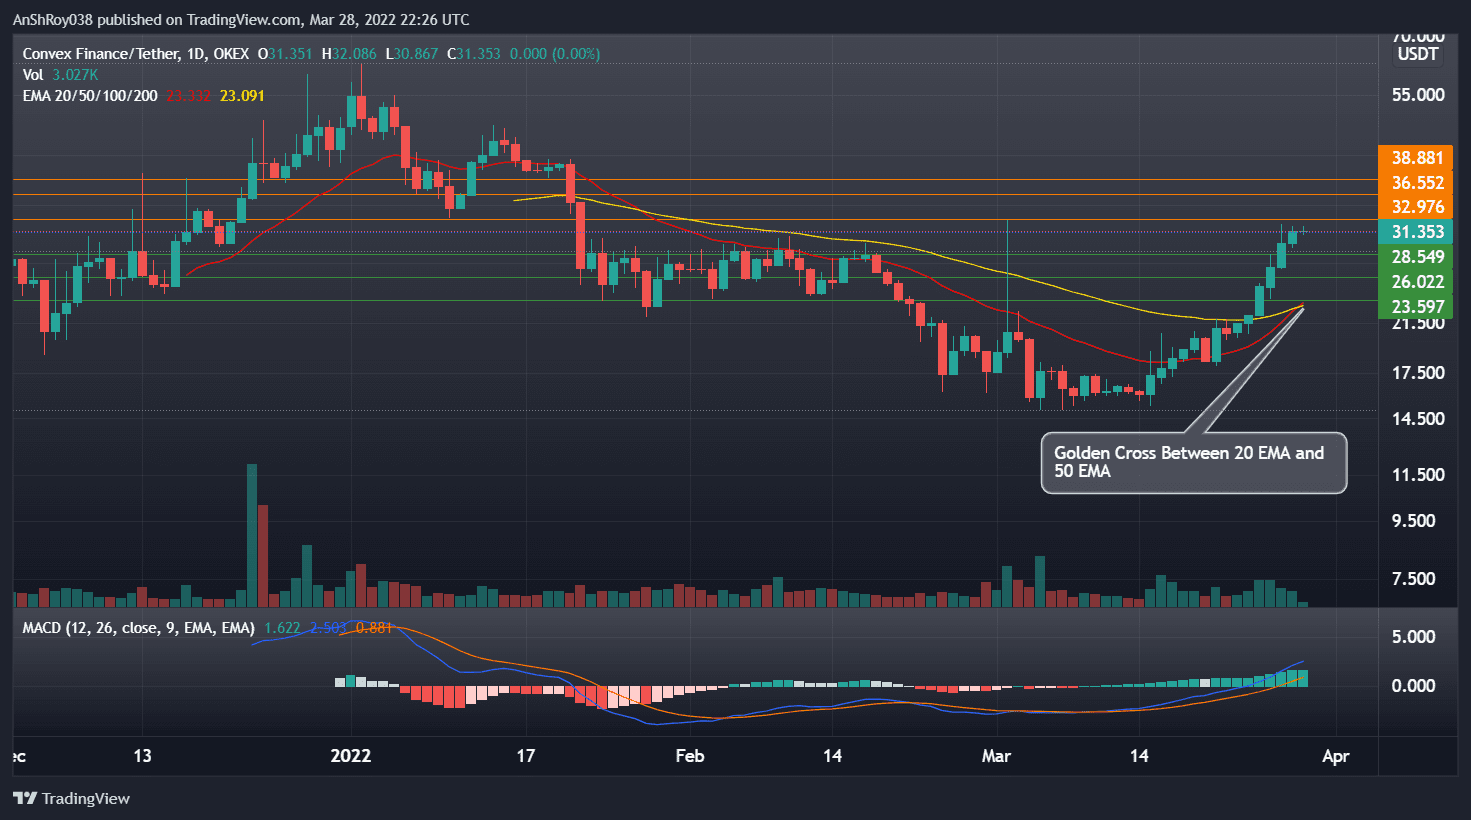
CVX would then move to target resistance at $36.5 before moving to challenge resistance near $39. The $39 resistance level acted as support during CVX’s ATH rally.
Meanwhile, momentum oscillator MACD continues to be bullish for the Convex Finance token. The MACD histogram, which plots the difference between the MACD line (difference of 12-day and 26-day EMA) and the MACD signal line (9-day EMA of MACD), is charting expanding positive bars on the daily charts.
Expanding positive bars indicate the strengthening of bullish momentum for VET’s prices.
CVX Downside Risks Persist
Convex Finance’s current rally runs the risk of a trend reversal, as both Bollinger bands and the relative strength index forecast an overbought signal for CVX.
In detail, Bollinger bands consist of a simple moving average (middle band) and an upper and lower band. The two bands are usually two standard deviations from the middle band. When an asset’s prices break above the upper bands, it denotes an overbought condition.
CVX prices broke above the upper Bollinger band on Mar 25, and the Convex Finance token continues to move above the indicator’s upper trendline. Therefore, a strong price correction seems to be in the books for CVX.
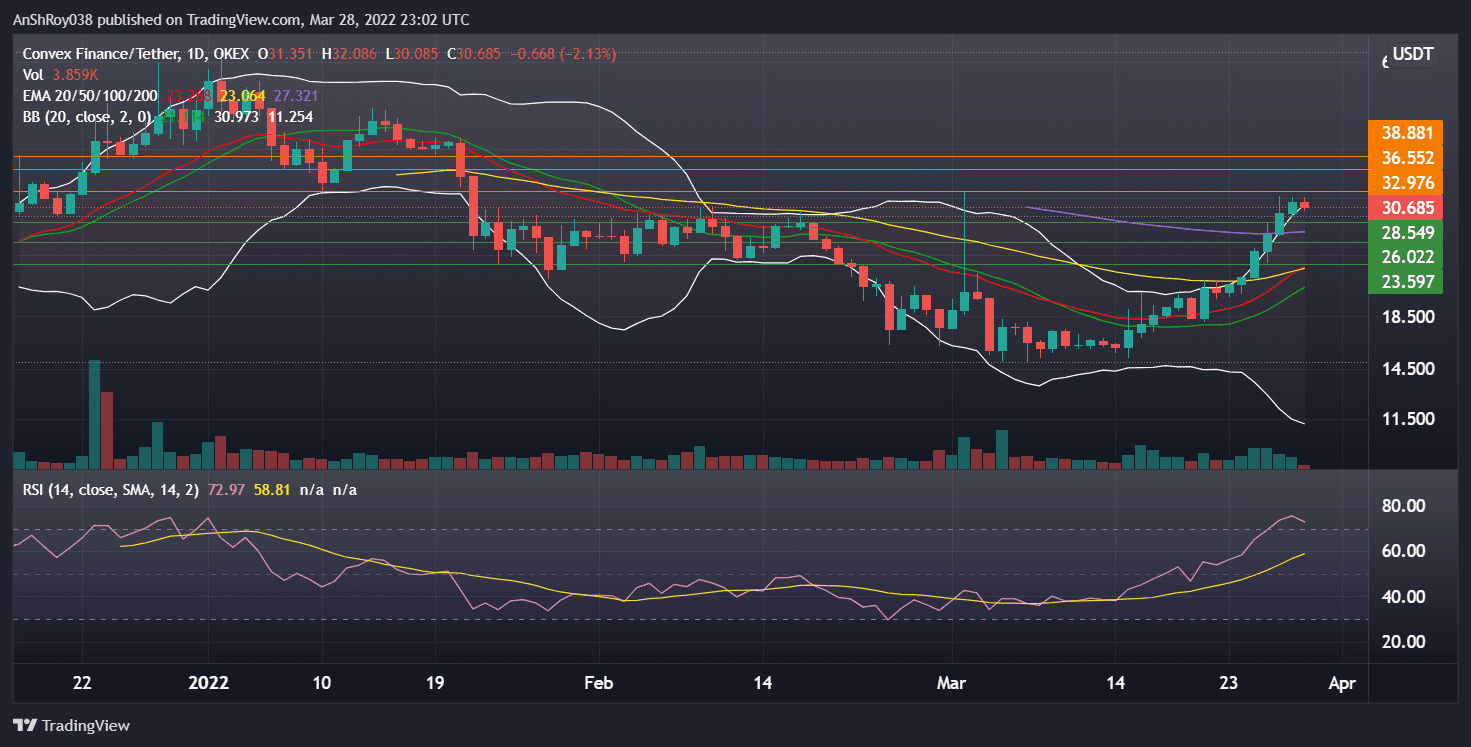
Meanwhile, the relative strength index is firmly in the overbought regions, clocking 72.97 on the daily charts. Traders often consider an overbought RSI a prelude to an upcoming trend reversal in bears’ favor. As such, overbought RSI levels often trigger sell-offs.
Also Read: Holochain rally loses steam after HOT jumps 28% in four days.Traders relying on either of the two indicators would likely start selling, which would bring CVX prices down to immediate support at $28.5, a price level that acted as resistance for CVX from Jan 22 to Feb 17 earlier this year.
Further downside movement would bring the support at $26 into play. Finally, the Convex Finance token has support from a confluence of the 20-day and 50-day EMA near $23.6.
At the time of writing, CVX was trading at $30.47 on OKX (OKEX) exchange, down 2.83% since trading began.

… [Trackback]
[…] Find More to that Topic: coinchapter.com/convex-finance-prices-jump-110-in-two-weeks-cvx-selloff-risks-mount/ […]