
NOIDA (CoinChapter.com)— The price of Litecoin is recovering following the April flash market crash. Moreover, Litecoin recently achieved an important milestone, but that might not excuse the token from the bearish cues threatening it.
Litecoin recently marked 12.5 years of continuous operation, emphasizing its network stability. Created in 2011 by Charlie Lee as an alternative to Bitcoin, Litecoin has remained functional without significant downtime, showcasing the reliability of its technology and the dedication of its development team.
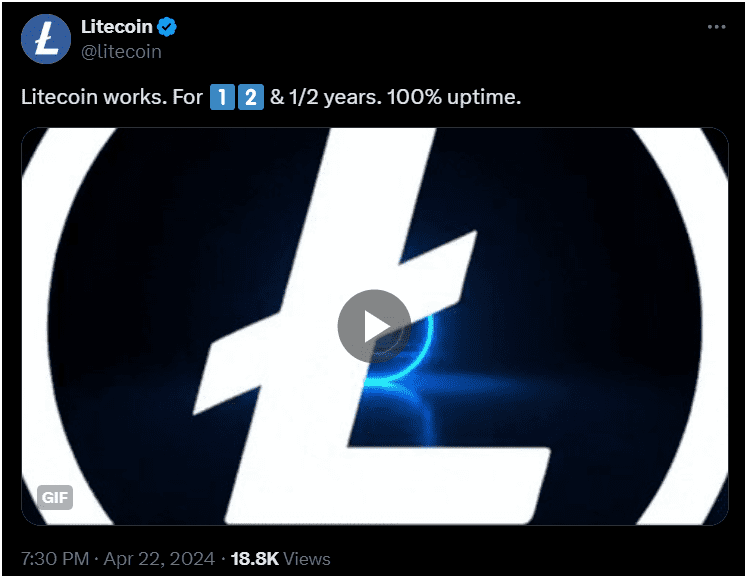
Key updates have included periodic “halving” events, the latest in August 2023, which reduced mining rewards to 6.25 LTC to control inflation. As it develops with the cryptocurrency market, Litecoin’s significant milestones and adoption by over five million long-term holders reflect its relevance.
However, the LTC price has formed a bearish pattern with a massive downside target.
LTC Price Faces Risk From Technical Setup
Meanwhile, the LTC price is moving inside a bearish technical called the ‘Descending Triangle.’
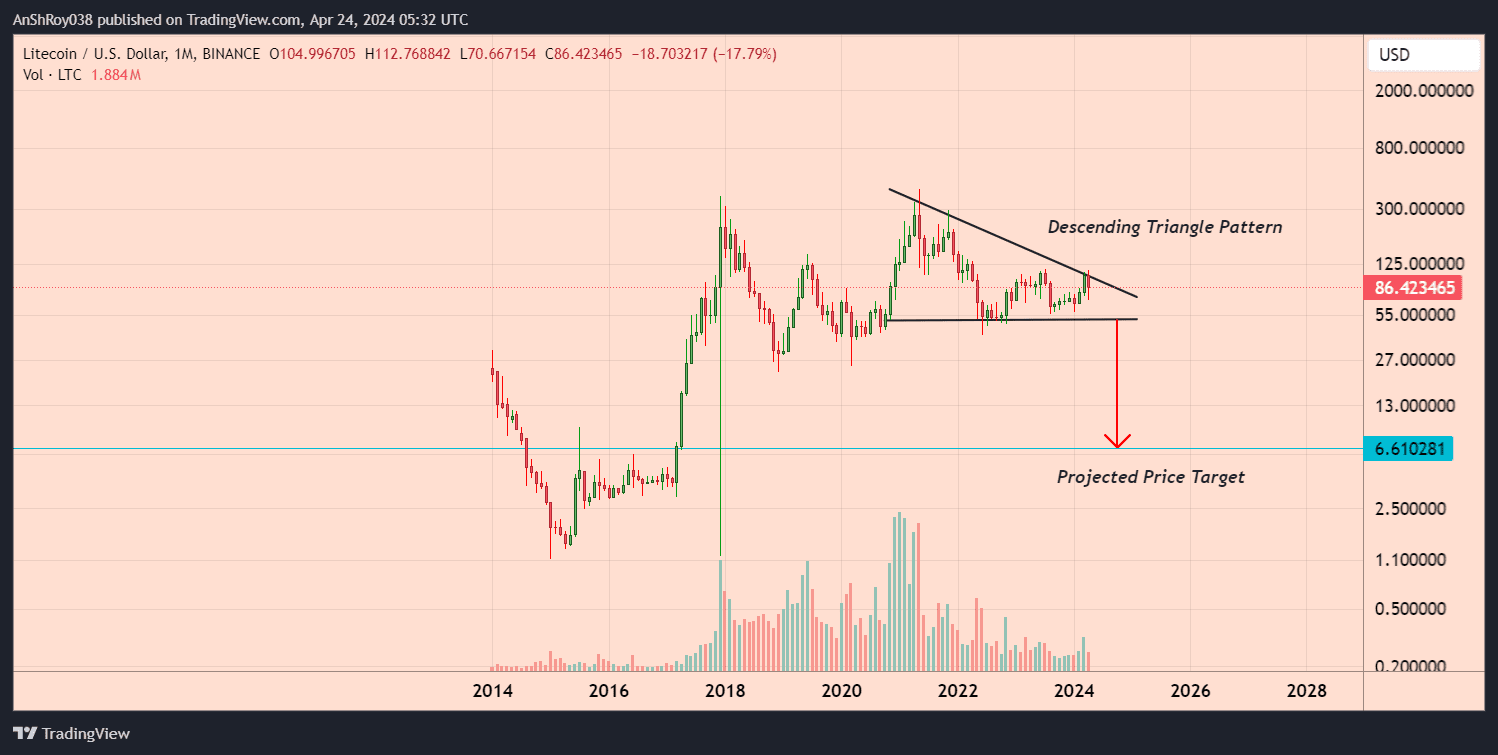
Market analysts predominantly consider the descending triangle a bearish continuation signal in a technical chart pattern. A downward-sloping upper trendline characterizes this pattern, with declining resistance levels that progressively lower the peaks of the price action.
Additionally, a horizontal lower trendline acts as support, maintaining a consistent low point that the price struggles to breach. The formation indicates that selling pressure is gradually increasing, overcoming the buying interest, as each rally is weaker than the last.
In a descending triangle setup, the height of the triangle’s thickest section determines the price target. If the bearish pattern pans out, LTC price could drop over 92% to reach the pattern’s projected price target near $6.6.
But Will Litecoin Confirm The Pattern?
Litecoin whales, sharks, and shrimps show varying degrees of activity. The addresses with more than 1 million LTC tokens have remained mostly flat. Since such large holders could include exchange wallets, their position might not be very informative.
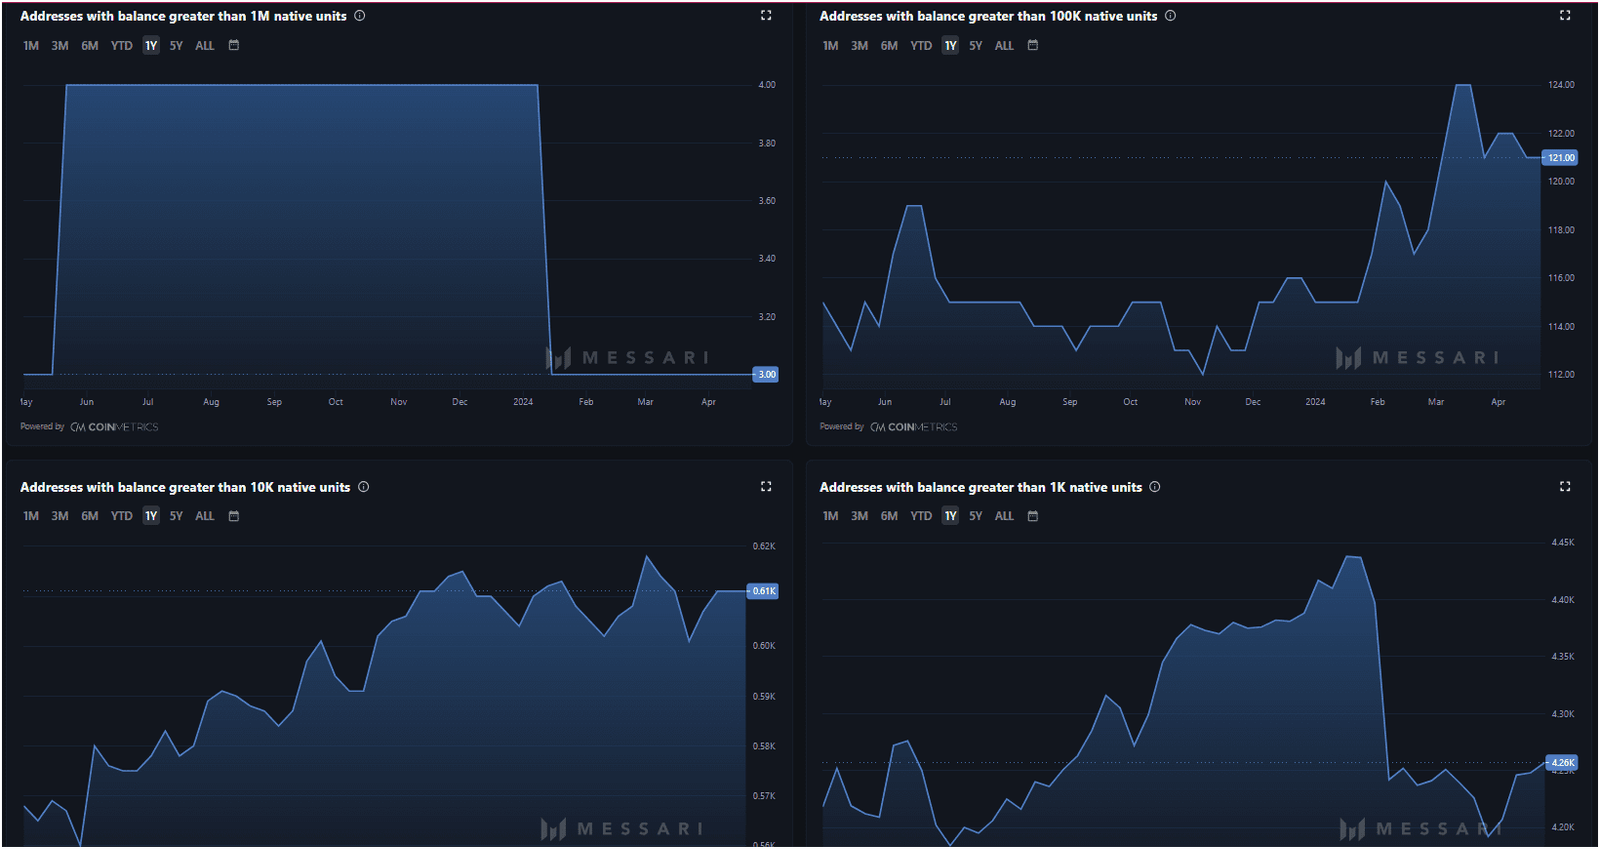
However, wallets that hold 10,000 to 1 million tokens, the sharks, rose during 2024 before flatlining, which could indicate a hodling mindset among investors.
Interestingly, retail traders who hold 1,000 to 10,000 LTC tokens have been on the rise lately, suggesting a growing interest in the token in the retail market.

Furthermore, Messari’s data shows that the 10-year, 5-year, and 4-year LTC active supply is rising, suggesting increased trading activity among long-term holders. However, the 3-year active supply is moving downward, indicating a likely hodling mindset among market participants.
If investors start hodling, the token’s circulating supply decreases, potentially increasing its price if demand remains the same.
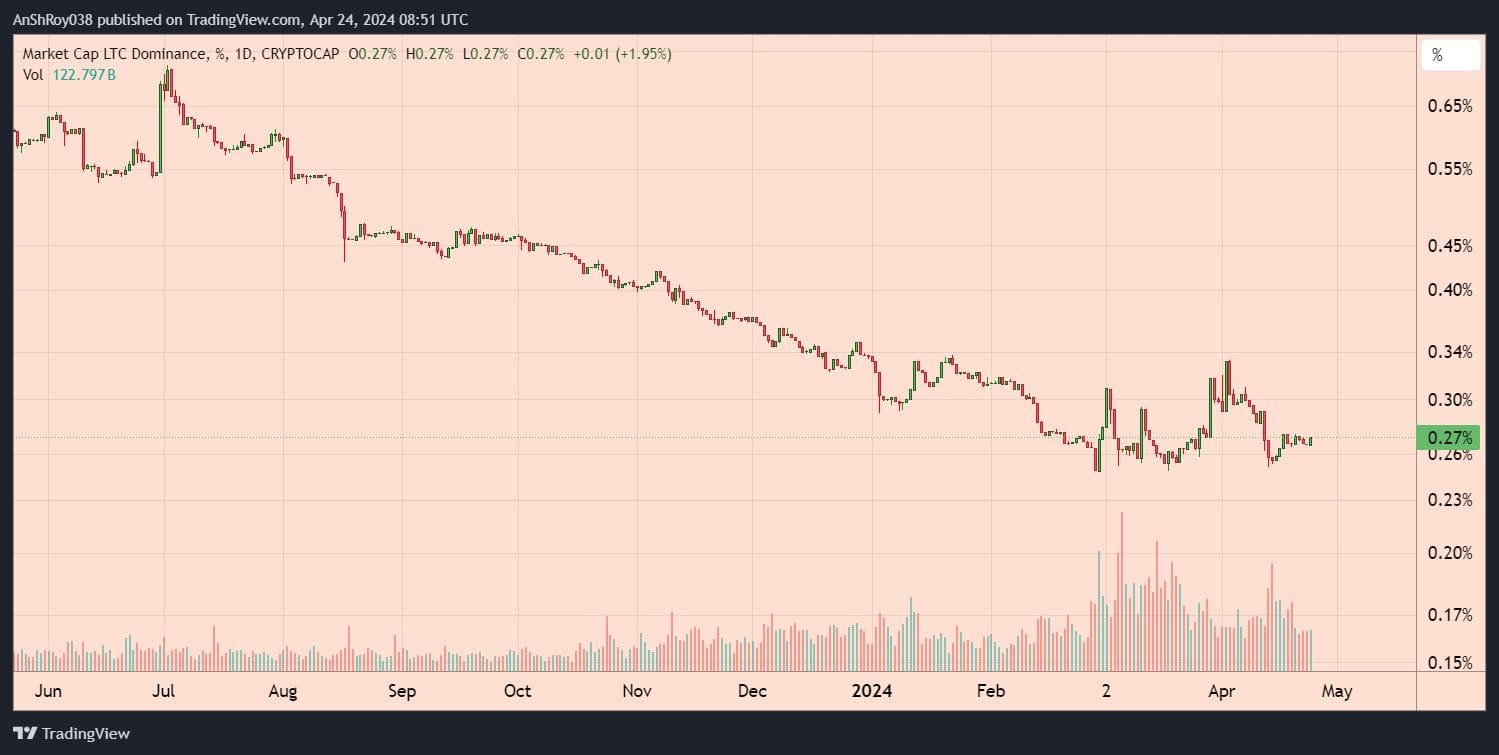
On the other hand, the declining LTC dominance could worry investors, though it is not necessarily a sure-shot indicator of future price action. As such, Litecoin has a good chance of invalidating the bearish pattern, provided it does not face strong headwinds in the coming days.
LTC Bulls Targeting $90
LTC price has recovered strongly from the recent market crash, rising nearly 20% since April 13 to reach a daily high near $87 on April 24. However, the 20-day EMA (red wave) and 50-day EMA (purple wave) trendlines have formed a dynamic resistance confluence.
Breaking above the trendline resistance could help LTC’s price rally to resistance near $91. Moreover, breaking and consolidating above the immediate resistance level could help Litecoin’s price rally to resistance near $100.
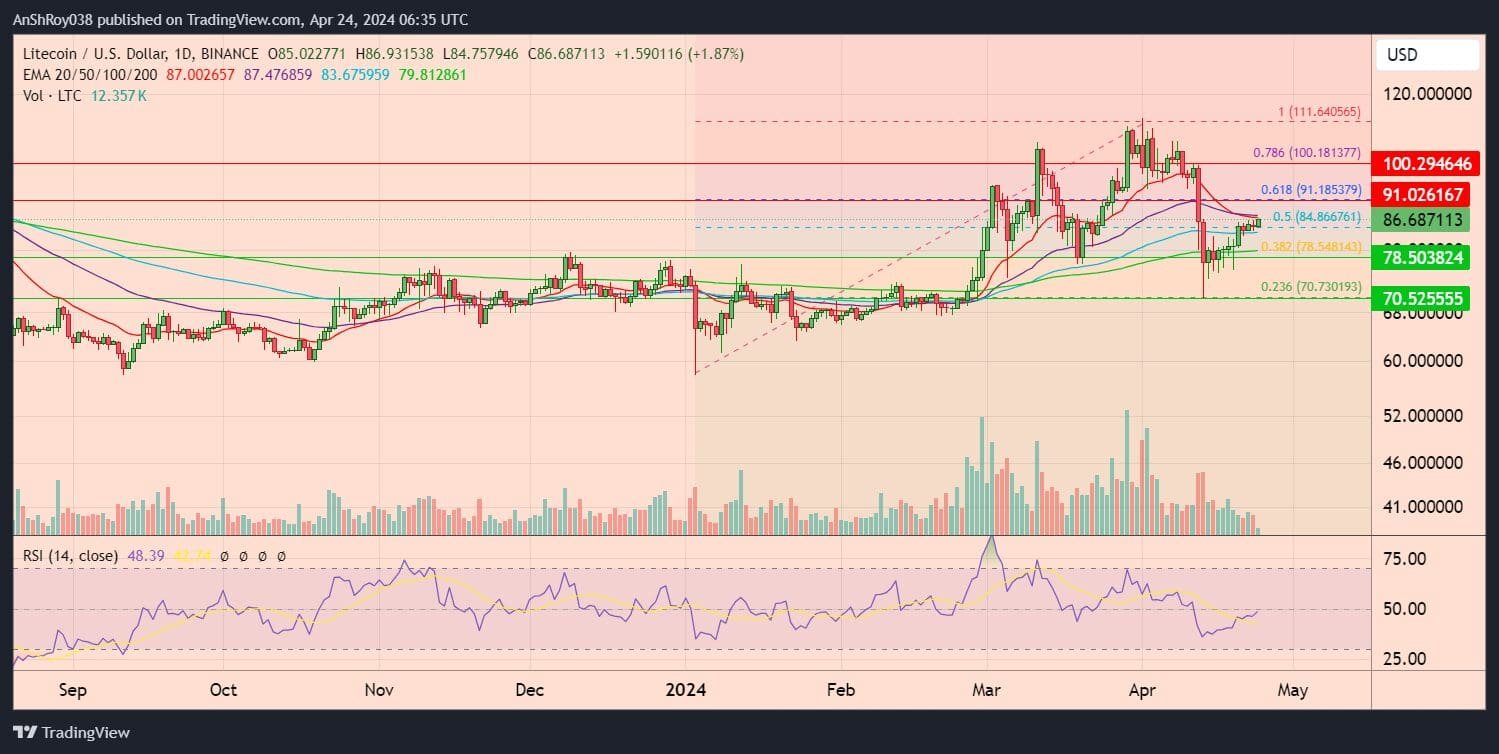
However, a rebuttal from the trendline resistance could send LTC price tumbling to the 200-day EMA (green wave) support near $78. Breaching the immediate support might force Litecoin to test the support near $70.
The relative strength index for LTC remained neutral, with a score of 48.39 on the daily chart, leaving bulls enough room to mount a rally.

… [Trackback]
[…] Read More to that Topic: coinchapter.com/could-litecoin-really-crash-90-in-the-near-future/ […]
… [Trackback]
[…] Find More Info here to that Topic: coinchapter.com/could-litecoin-really-crash-90-in-the-near-future/ […]
… [Trackback]
[…] Find More on to that Topic: coinchapter.com/could-litecoin-really-crash-90-in-the-near-future/ […]
… [Trackback]
[…] Find More to that Topic: coinchapter.com/could-litecoin-really-crash-90-in-the-near-future/ […]