

YEREVAN (CoinChapter.com) – The crypto sector picked up 1% on July 20, following Bitcoin’s move above $30,000 and XRP’s explosive rally. Several altcoins, including Ethereum’s Ether (ETH), Binance coin (BNB), Cardano (ADA), Solana (SOL), Dogecoin (DOGE), Polygon (MATIC), Litecoin (LTC), and Polkadot (DOT) followed suit.
However, it’s too early to celebrate. Here are their price predictions for the end of the week:
#1 Bitcoin (BTC) uptrend is unlikely to be sustainable
The flagship crypto attempted a mild 2% recovery in the previous 48 hours after losing 7% of its valuation the week prior. However, BTC is unlikely to close the New York session above the $30,000 line. Furthermore, according to several bearish technicals, $29,000 remains a likely target before the week’s end on July 23.

Despite the uptick, Bitcoin fell below its 20-day exponential moving average (EMA-20; red wave) as the trading volumes declined. The MACD oscillator was also still in the bearish zone, predicting more losses ahead, along with the relative strength index (RSI).
While the price action established higher highs and flat lows, the RSI printed lower lows, intensifying bearish expectations. Thus, the $29,000 target seems likely by the end of the week.
#2 Ethereum token Ether (ETH) eyes a 3% correction
Ethereum token reached over $1,910 on July 20, after a moderate 1% upward correction, identical to Bitcoin’s price action. Moreover, ETH also slipped below its EMA-20, hinting that the token might not see any substantial uptrend before the week is through.
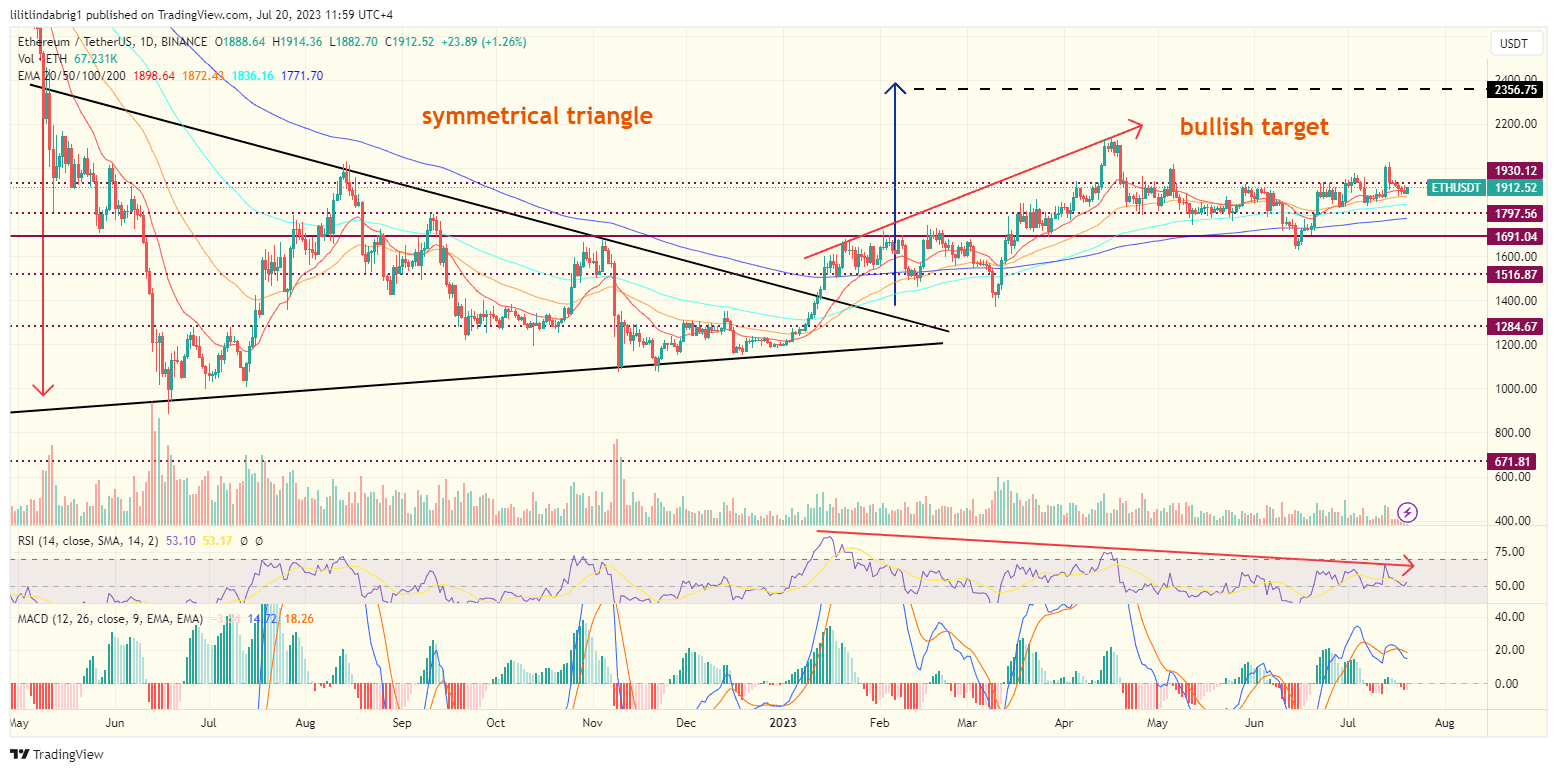
Additionally, Ethereum’s RSI rang warning bells like Bitcoin’s, consistently printing lower highs since Jan 2023. ETH also retested the resistance at $1,930 and, if the trading volume decline continues, threatens to retest or even breach the support at $1,860 by the end of the week.
#3 XRP rally continues, reaching a 17-month high
XRP coin price gained 6% to $0.81 on July 20. The token’s move came as a part of a second leg-up after an explosive 75%-plus surge since July 13 due to Ripple’s major win in the lawsuit against the US Securities and Exchange Commission (SEC).
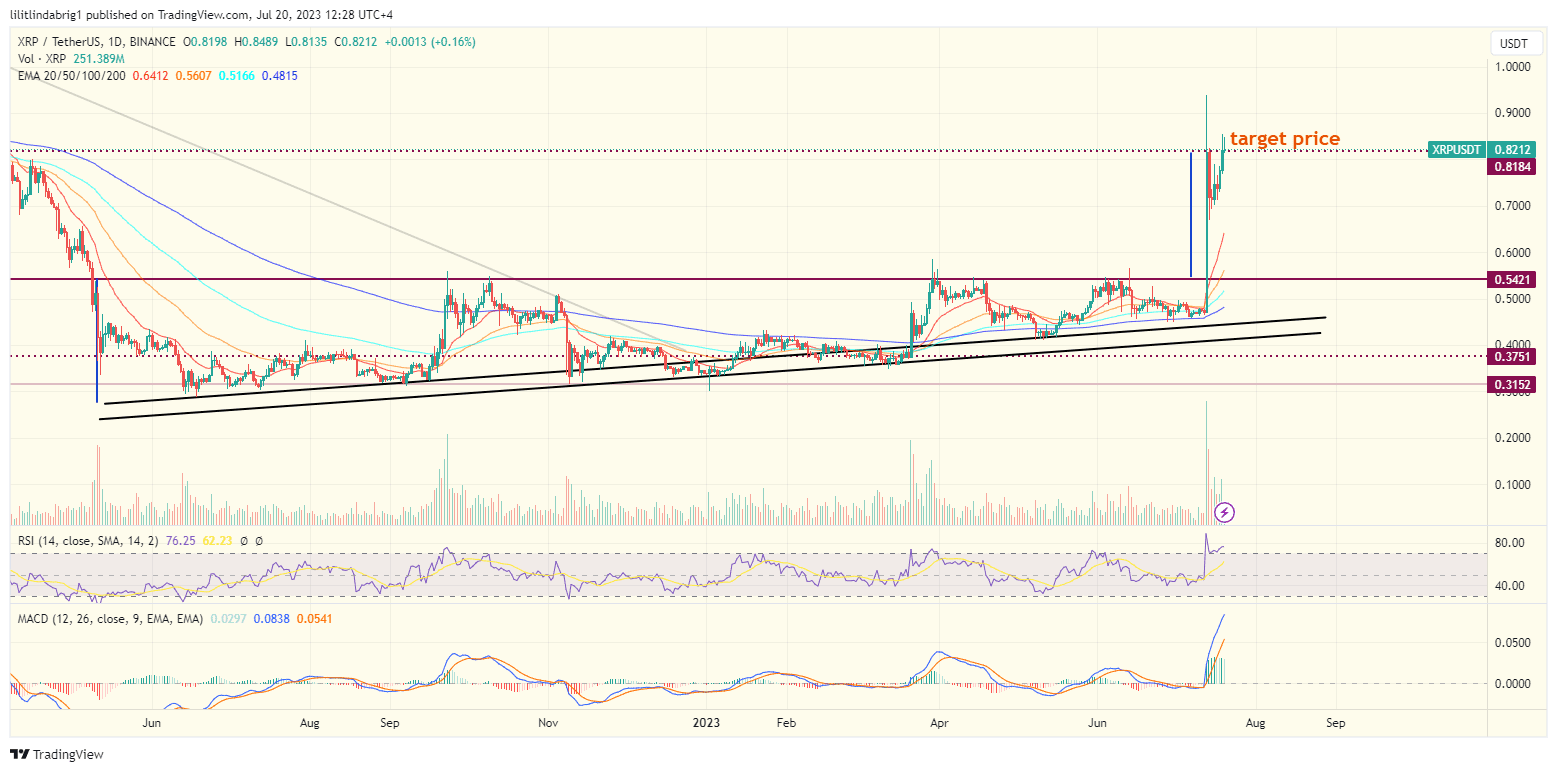
Thanks to the jump, the token price broke above a key technical resistance near $0.54, which has hindered its breakout attempts since early May. However, it was still unable to conquer the resistance at $0.82, despite strong technicals.
The trading volumes declined in the previous four days, but the MACD oscillator was in its bullish phase, and the token traded well above its EMA-20, 50, 100, and 200. If the uptrend continues, XRP could reach former support at $0.89
#4 BNB investors can expect a 5% drop
Binance coin BNB traded at $244 in the European session on July 20, after a copycat 2% daily green candle. The token has had a rough quarter due to the exchange’s legal woes. However, the recovery might not come soon, as the coin still traded within a consolidation channel, relevant since May 2022.
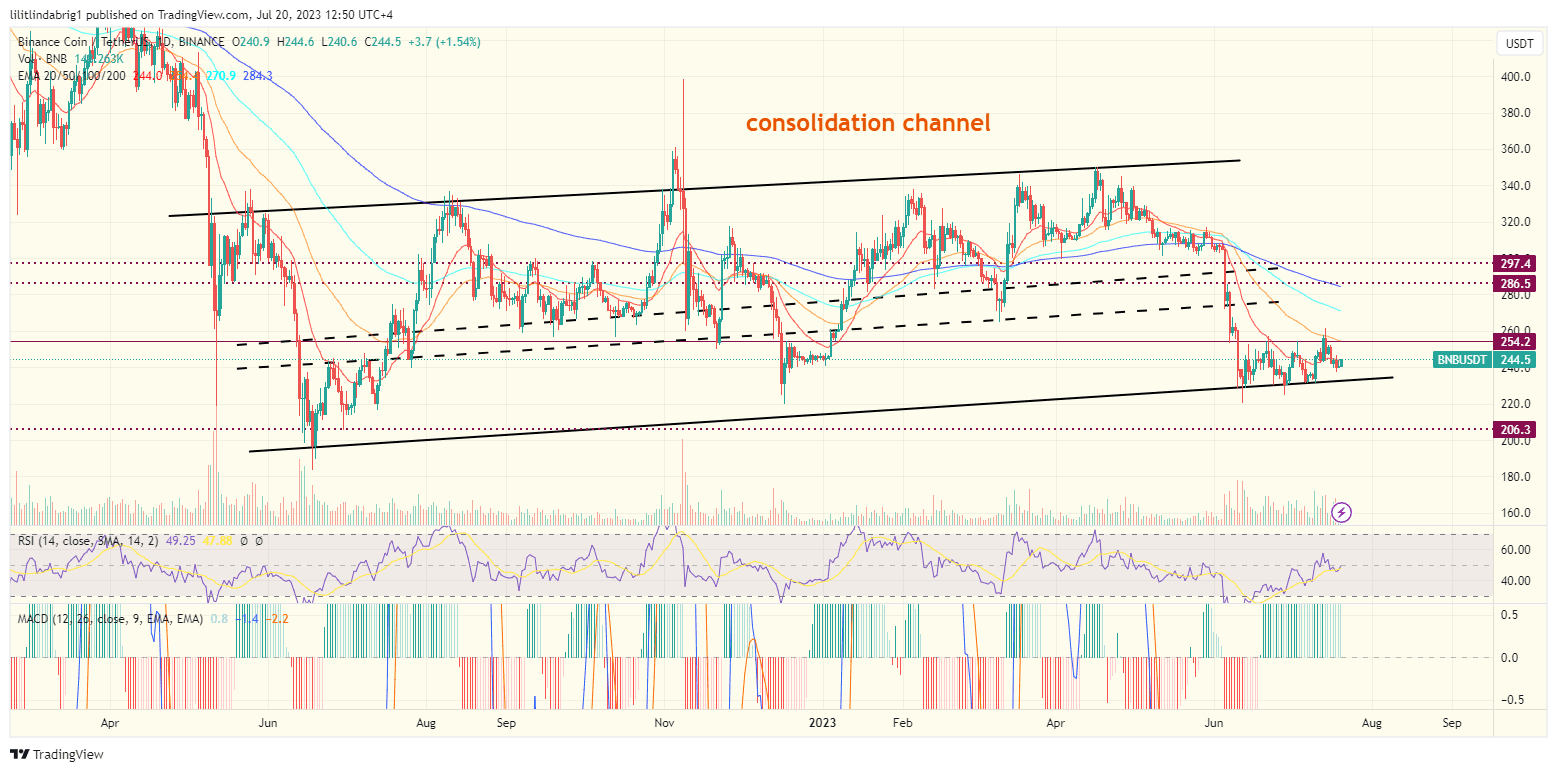
The setup entails two parallel trendlines with a powerful mid-range. After the mentioned SEC-related price cascade, BNB price action repeatedly retested the channel’s support, unable to breach the resistance at $254.
Due to the declining trading volumes, BNB might retest the support again before July 23, which would constitute a 5% decline.
#5 Cardano coin ADA could also drop 5%
Cardano’s token ADA traded at $0.32 in the European session on July 20, following a 5% uptrend in the previous 24 hours. The MACD oscillator was still in its bullish phase, and the coin traded above its EMA-20 and EMA-50.
However, ADA risks paring the recent gain, as the trading volumes declined in the previous week, similar to the aforementioned coins. If a decline follows, ADA could drop back to the support at $0.30 by the end of the week.

#6 Solana (SOL) is unable to break resistance at $27
Solana’s SOL followed the XRP explosion, putting on 27% since July 13 and trading at $27.3 on July 20. Notably, the token hit a former support level that has turned to resistance and hindered SOL’s upside moves since Jan 2023.

The Solana token temporarily broke the $27 ceiling on the July 15 hype, but the rally was not sustainable. Conversely, if a downward correction follows the decline in trading volumes, SOL bears can expect a 17% drop to the next available support at $22.4.
#7 Dogecoin (DOGE) follows the crowd
Similar to other coins on the list, Dogecoin managed a 7% uptick in the previous 48 hours, trading at $0.072 on July 20, above its EMA-20,-50, and -100. However, it is unlikely to cross above the EMA-200 because of the declining trading volumes on the daily chart.

The “falling wedge” formation promises Dogecoin a near-100%surge, but the meme coin would need stronger buying pressure to pull off a triple-digit solo rally. As of July 20, DOGE’s forecast remains quite flat, with a possible setback to $0.068 by the week’s end.
#8 Polygon (MATIC) joins the altcoin wave with a 10% uptrend
MATIC traded near $0.80 on July 20, after a 10% daily uptrend. In June, the SEC deemed the coin a “security” among other cryptos, hurting its adoption. However, given Ripple’s win against the SEC, MATIC could also benefit.

As of July 2023, MATIC eyed a golden cross between EMA-20 and -50. In detail, a golden cross occurs when a short-term MA crosses above a long-term MA after a bearish period. The setup predicts a bullish phase ahead for as long as the short-term MA remains dominant. If the uptrend continues, the target price for the Polygon coin by the end of the week stands at approximately $0.85.
#9 Litecoin (LTC) expects a jump after halving
Litecoin token LTC traded at $94.2 on July 20, after a 7% daily push. Notably, the move came parallel to the aforementioned rallies, but once again, the declining trading volumes could dampen LTC’s short-term prospects.

The coin also traded within a consolidation channel, much like BNB. However, the MACD bearish phase continued, which hints at a possible decline ahead for the coin by the end of the week. Notably, the LTC halving is likely to drive the coin higher this quarter. However, the short-term target stands at $90.7.
#10 Polkadot (DOT) risks a 90% drop
Polkadot (DOT) traded at $5.48 on July 20, approaching a resistance trendline of a technical setup known as the “descending triangle.” The latter entails a flat support and a down-sloping resistance with a relevant mid-range.

They prevent sharp moves in either direction through consecutive retests and predict a drop equal to the maximal setup height. Thus, the target price for DOT would stand at approximately $0.5, or over 90% below the current value.
Notably, the technical setup is only one of the possible predictors. DOT is likely to follow the altcoin market fluctuations, and if the recovery continues, DOT’s 90% drop is not going to happen.

… [Trackback]
[…] Find More to that Topic: coinchapter.com/crypto-price-prediction-bitcoin-ethereum-xrp-bnb-ada-solana-dogecoin-matic-litecoin-dot/ […]
… [Trackback]
[…] Information on that Topic: coinchapter.com/crypto-price-prediction-bitcoin-ethereum-xrp-bnb-ada-solana-dogecoin-matic-litecoin-dot/ […]
… [Trackback]
[…] Read More on that Topic: coinchapter.com/crypto-price-prediction-bitcoin-ethereum-xrp-bnb-ada-solana-dogecoin-matic-litecoin-dot/ […]
… [Trackback]
[…] Find More on that Topic: coinchapter.com/crypto-price-prediction-bitcoin-ethereum-xrp-bnb-ada-solana-dogecoin-matic-litecoin-dot/ […]