
Key Takeaways:
Cryptocurrencies seem to have run out of fuel as a majority of tokens are either consolidating or have started to fall. Cryptocurrencies Prices: MANA, SAND, SLP, FIDA, REEF, NU, CHZ, ONT, DNT token
NEW DELHI (CoinChapter.com) — The broader crypto market rose by nearly 25.3% between Feb 3’s low of $1.642 trillion to reach Feb 8’s high of $2.057 trillion, riding on a relief rally brought on by growing interest in tech stocks.

As Amazon’s stock rose, Bitcoin (BTC) Ethereum (ETH) led the crypto market recovery. However, since Feb 8, the uptrend has lost some steam, with a majority of digital tokens falling prey to profit keeping from the bears.
As a result, the total crypto market cap lost more than $36 billion on Feb 8.
MANA/USD
Decentraland’s MANA token is likely to paint a bullish technical pattern called a golden cross on its daily charts. In detail, a golden cross occurs when a token’s short-term moving average (26-day EMA in this case) moves above its relatively long-term moving average (50-day MA here).
The token rose with the wider crypto market but has been moving laterally after charting a seven-week high of $3.55 on Feb 9. The $3.5 price level rebuffed MANA’s uptrend and currently acts as immediate resistance for the Decentraland token.
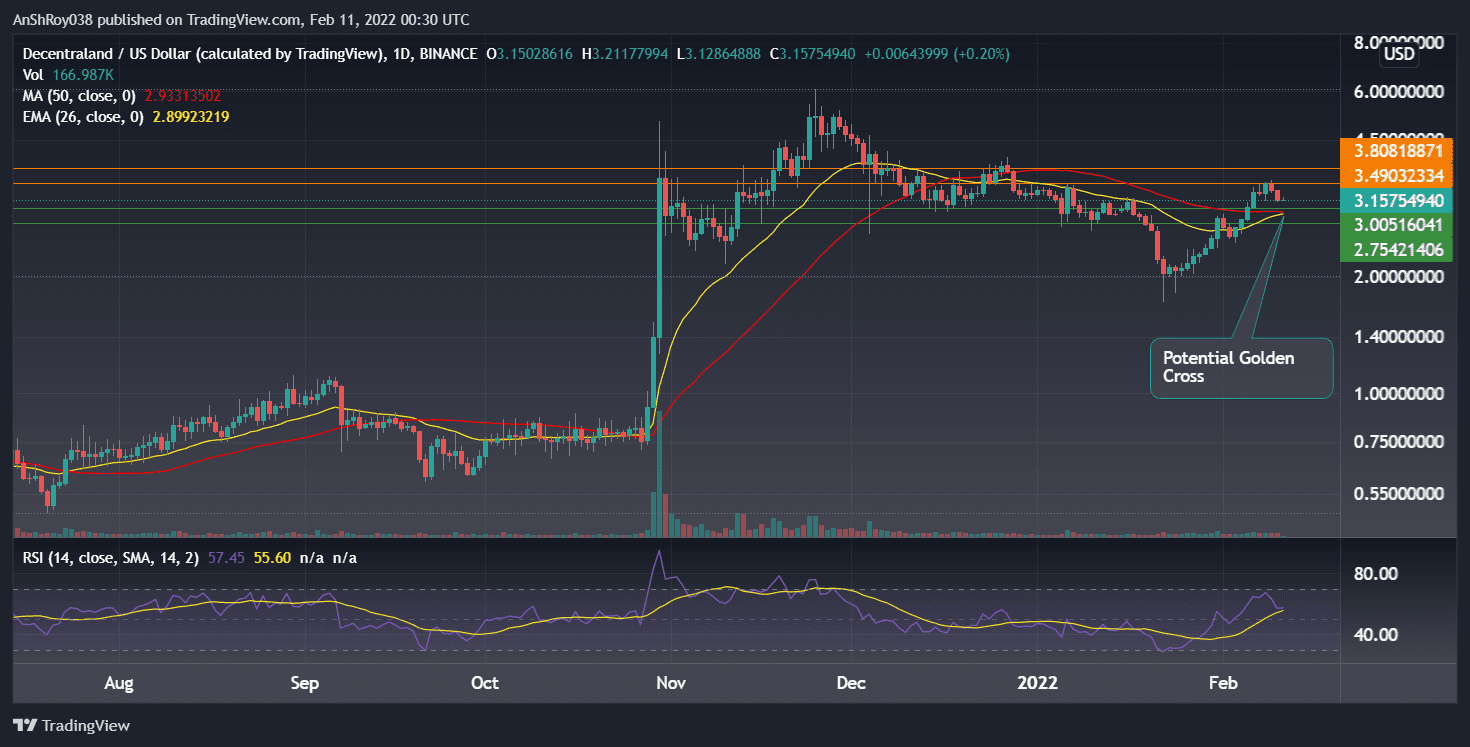
If MANA moves above its immediate resistance, its prices could target the next resistance level at $3.81. The potential golden cross is likely to help propel MANA prices upwards as the day progresses.
Conversely, a failure to sustain its uptrend could pull MANA prices down to $3, near a support confluence from its 50-day MA and 26-day EMA lines. Further downtrend could bring the $2.75 support level into play.
Meanwhile, the relative strength index for MANA is neutral, clocking a value of 57.45 on the daily charts.
SAND/USD
Sandbox’s SAND token has fallen prey to the crypto market correcting itself as well. At present, the token is moving in a horizontal channel formed by its 50-day MA and 26-day EMA lines. Immediate resistance for the token is near the $4.85 price level.
If SAND prices flip immediate resistance, the token would next target resistance at $5.6 before prices pull back. On the other hand, the Sandbox token has support from its 26-day exponential moving average near the $4.2 price level.
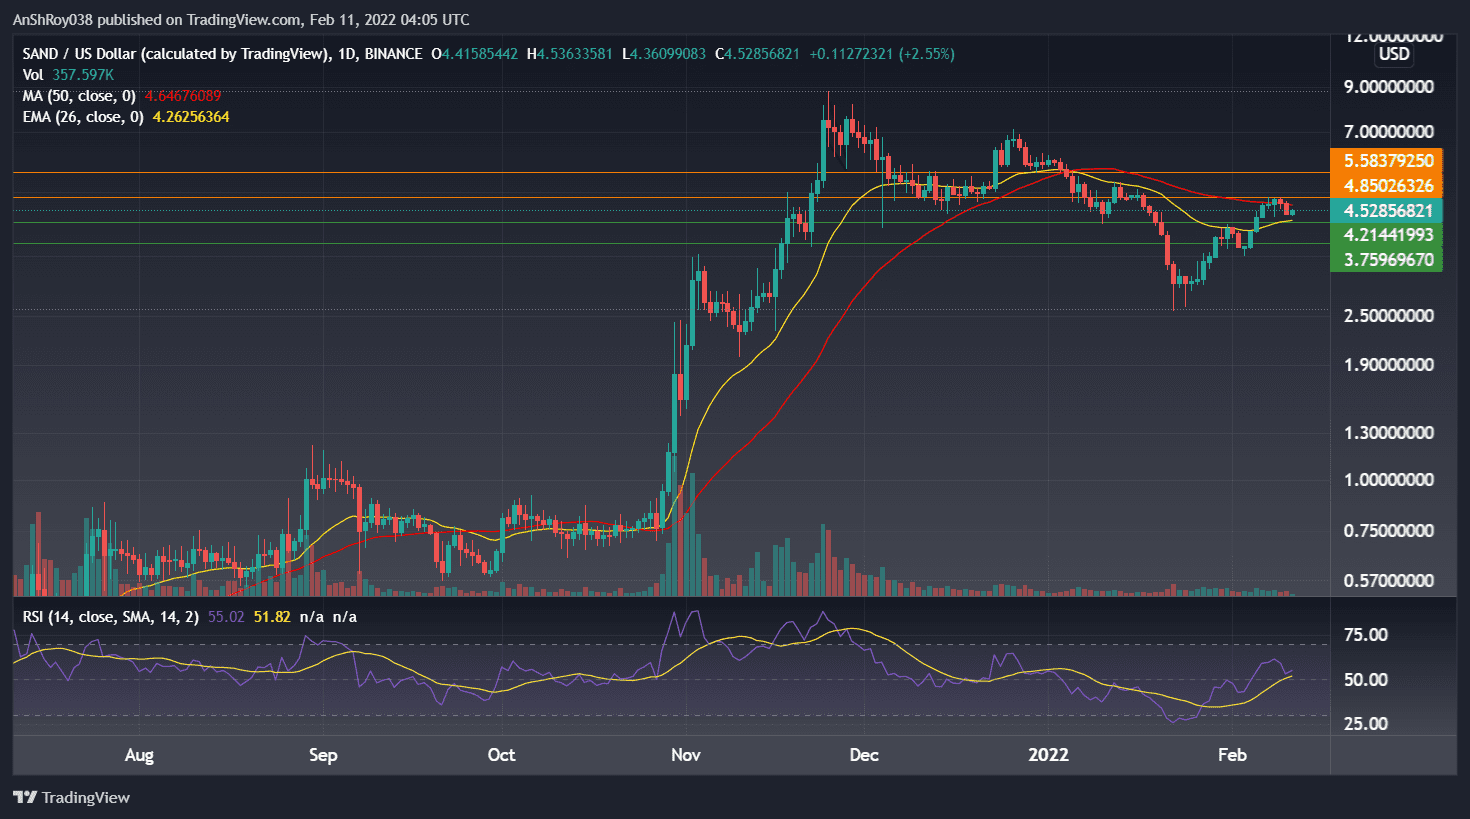
SAND would likely rebound from its immediate support over the day. However, if the Sandbox token’s prices break below the 26-day EMA, SAND could likely fall to $3.75 before recovering.
Meanwhile, the relative strength index remains neutral for SAND, clocking 55.02 on the daily charts.
SLP/USDT
The Smooth Love Potion token(SLP) joined the recovery party a bit late before plotting a massive 290% jump between Feb 6’s low ($0.0105) and Feb 10’s high of $0.0409. The boost upwards is likely the result of Axie Infinity’s revamp of its reward structure to reduce the SLP token’s inflation issues.
After the recent uptrend, the SLP token’s 26-day EMA (Yellow wave) seems poised to cross above the token’s 50-day MA line (Red wave), forming a golden cross. As such, it seems bulls would attack immediate resistance at $0.0414 in numbers.
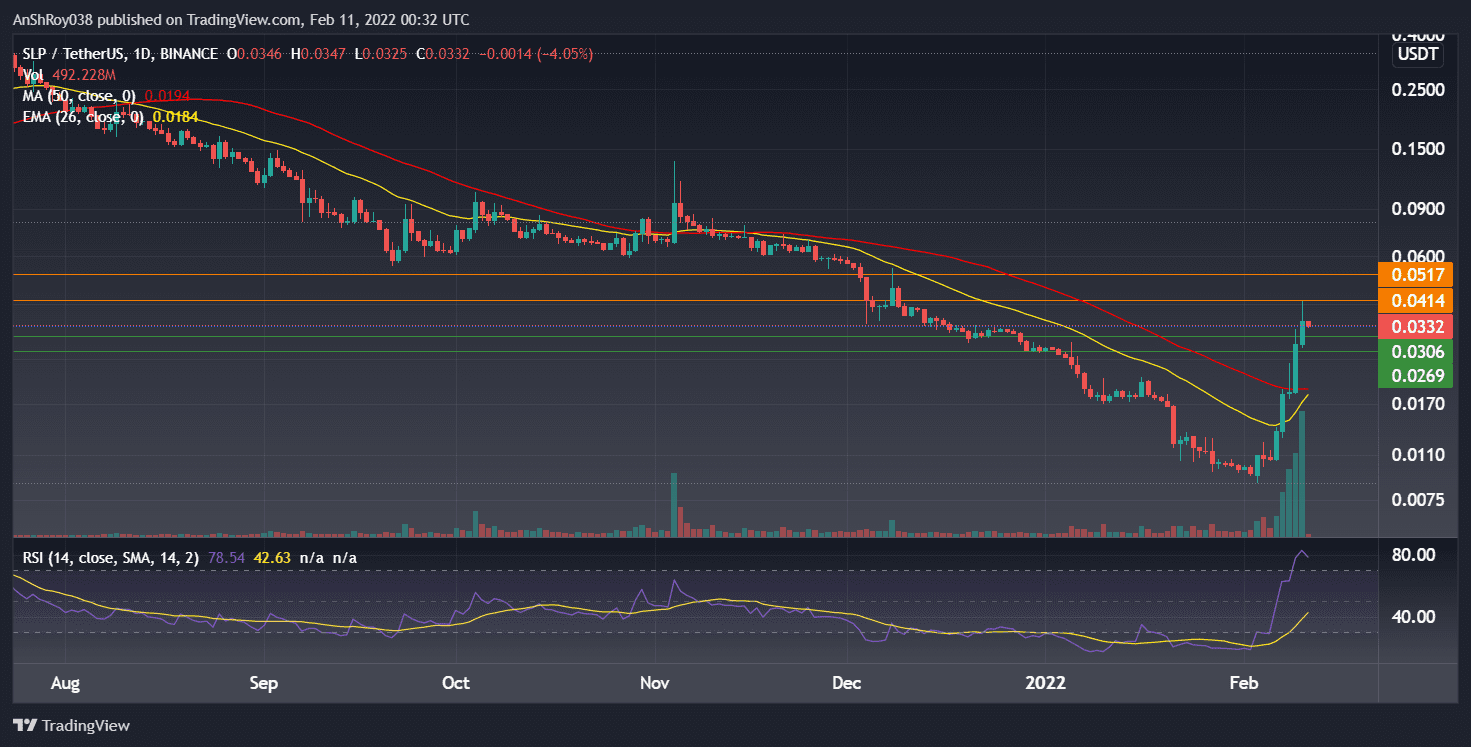
If SLP manages to break above the $0.0414 resistance, the token’s next price target would be near $0.052. However, the relative strength index is the overbought region, with a value of 78.54 on the daily charts. As such, a trend reversal for SLP is, theoretically, very likely.
In case of a reversal, SLP would try to consolidate above immediate support near $0.031, failing which prices could move to $0.027 before recovering.
FIDA/USD
The Bonfida token (FIDA) jumped 81% on Feb 9, before bears moved in to pare profits, as the long wick on the day’s candle indicates. The selloff continued the next day, with FIDA shedding nearly 12% from its prices on Feb 10.
FIDA faces immediate resistance near the $3.1 price level. If the Bonfida token manages to escape the bears, FIDA prices would likely target resistance at $3.5 before pulling back.

Conversely, the 50-day MA line provides support for FIDA near the $2.76 price level. If FIDA continues to fall, the Bonfida token would likely bring the support at $2.51 into play.
Meanwhile, the relative strength index has pulled back from its upwards movement, currently nested safely in the neutral regions with a value of 55.22 on the daily charts.
REEF/USD
Reef Finance has had a roller coaster recovery, painting nearly alternating red and green daily candles. REEF prices reached a high of $0.0146 on Feb 10 before prices pared, thanks to the bears aggressively selling to book profits.
As such, the REEF token currently has immediate resistance coming from its 50-day MA line near the $0.01371 price level. If the current resistance fails to stop REEF’s uptrend, the token would likely challenge $0.0146
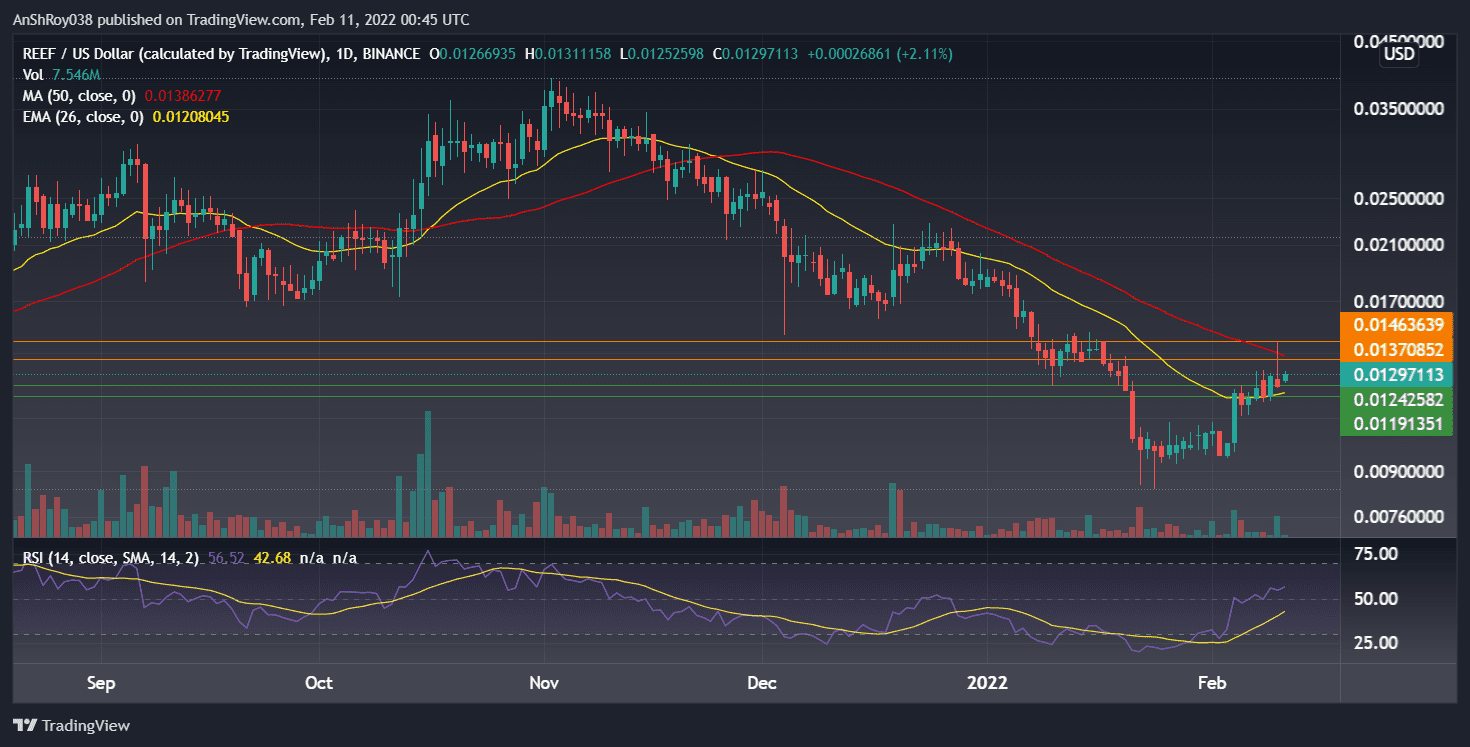
Conversely, Reef Finance has support near the $0.0124 price level. Sustained sell-off could pull down prices to $0.0120, near REEF’s 26-day EMA trendline. Meanwhile, the relative strength index for the Reef Finance token is neutral, clocking 56.52 on the daily charts.
NU/USDT
NuCypher prices have been in a downtrend since charting a 1,284.5% jump in Oct 2021. However, NU prices are recovering are now recovering from the Jan 21 crash. At present, the $0.624 price level, near Nu’s 50-day MA, acts as immediate resistance for the NuCypher token.
If the token flips 50-day MA into support, it could launch a rally that would see NU prices challenge resistance at $0.69.

On the other hand, Nu’s 26-day Exponential MA provides support for the token in case prices fail to rally upwards. Moreover, a sustained downtrend could pull prices down to the $0.481 support level.
Meanwhile, the relative strength index for Nu is comfortably in the neutral regions, clocking 51.96 on the daily charts. If NuCypher decides to move upwards, there is room for the RSI trendline before it becomes overbought.
CHZ/USD
Chillz prices broke above a nearly 3-month long descending trendline as CHZ prices recovered with the wider crypto market on Feb 3. However, the uptrend didn’t last long and prices have been moving horizontally since Feb 7.
CHZ prices fell 6.6% on Feb 10, but the 26-day Exponential MA line arrested the downside movement. The 26-day EMA provides immediate support near $0.217. Meanwhile, the Chillz token’s 50-day MA line provides immediate resistance near the $0.242 price level.
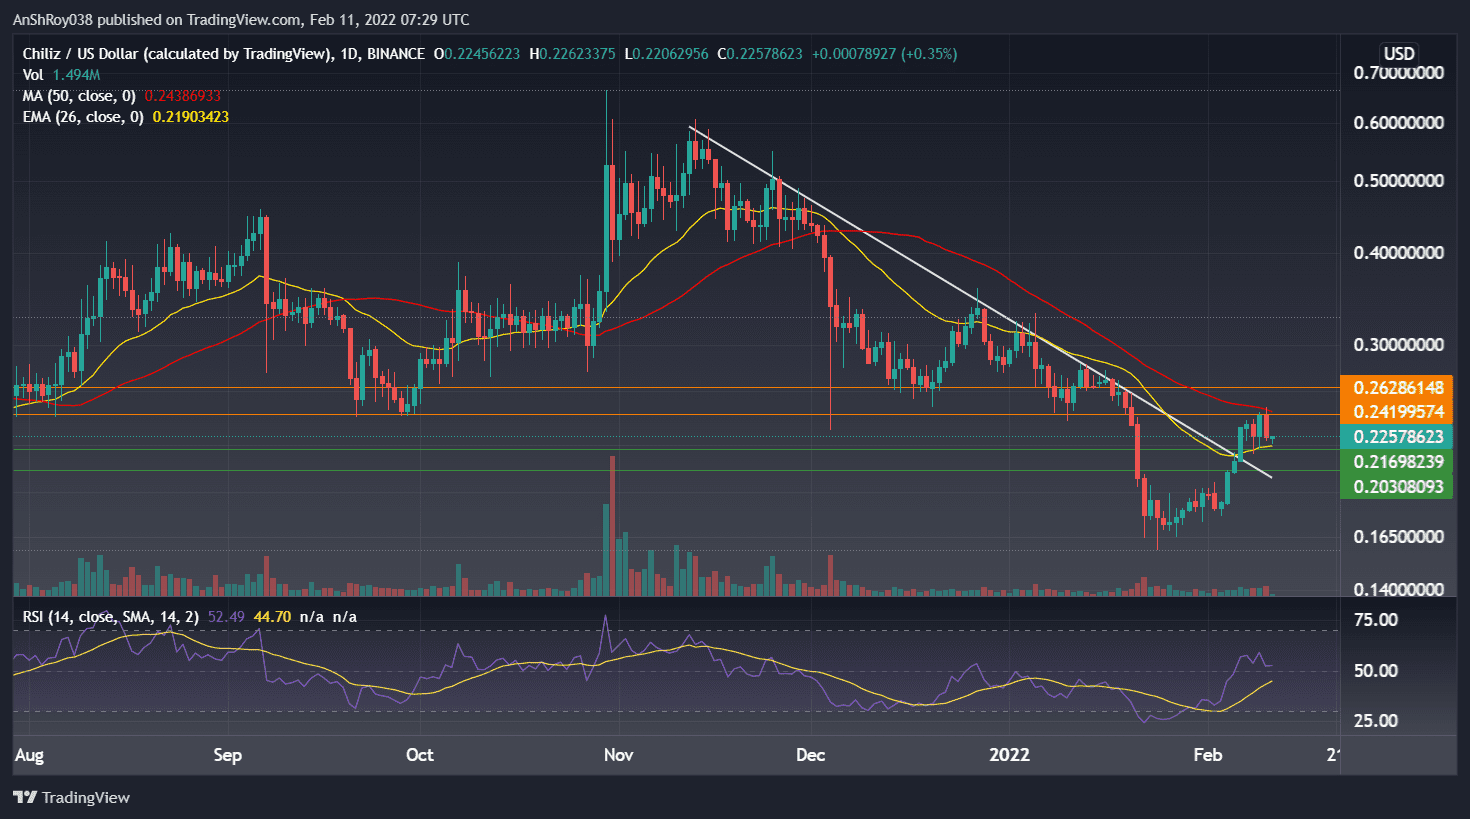
A sustained uptrend would likely push prices to $0.263 resistance before prices pull back. Meanwhile, the relative strength index is neutral for CHZ, with a value of 52.49 on the daily charts. The RSI trendline is moving downwards at the moment.
ONT/USD
The Ontology token registered 12.5% intraday gains on Feb 4. ONT prices moved upwards, testing support from its 26-day exponential MA line near the $0.565 price level. The Ontology token is currently moving laterally on the daily charts.
Meanwhile, the ONT token has immediate resistance near the $0.614 price level. A sustained buying spree from bulls could push ONT prices to target resistance at the $0.654 price level.
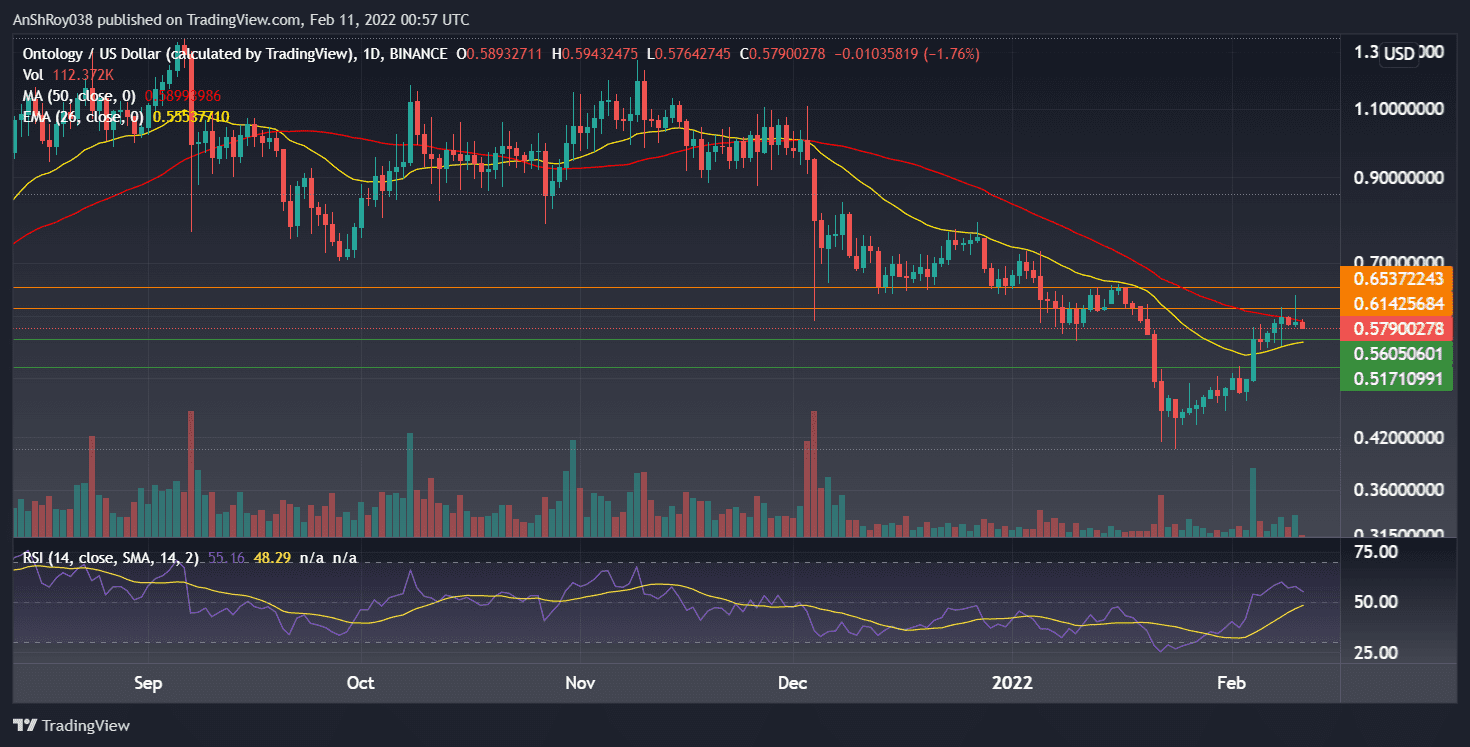
Conversely, if ONT breaks below immediate support, the Ontology token would bring support at $0.517 into play.
The relative strength index for ONT is currently neutral with a value of 55.16 on the daily charts. However, the RSI trendline has painted higher high after nearly 3 months of charting lower highs.
DNT/USD
District0x token has been moving horizontally since the last 4 days, after recovering from the Jan 21 crash. DNT remains bearish across the short-term time horizon, trading below the 50-day MA trendline. Immediate resistance for the Disctict0x token is at $0.1
The 26-day exponential MA line has been acting as dynamic support for the DNT token since Feb 7. If prices rebound from the dynamic support to rally upwards, the District0x token could find itself challenging resistance near $0.11.
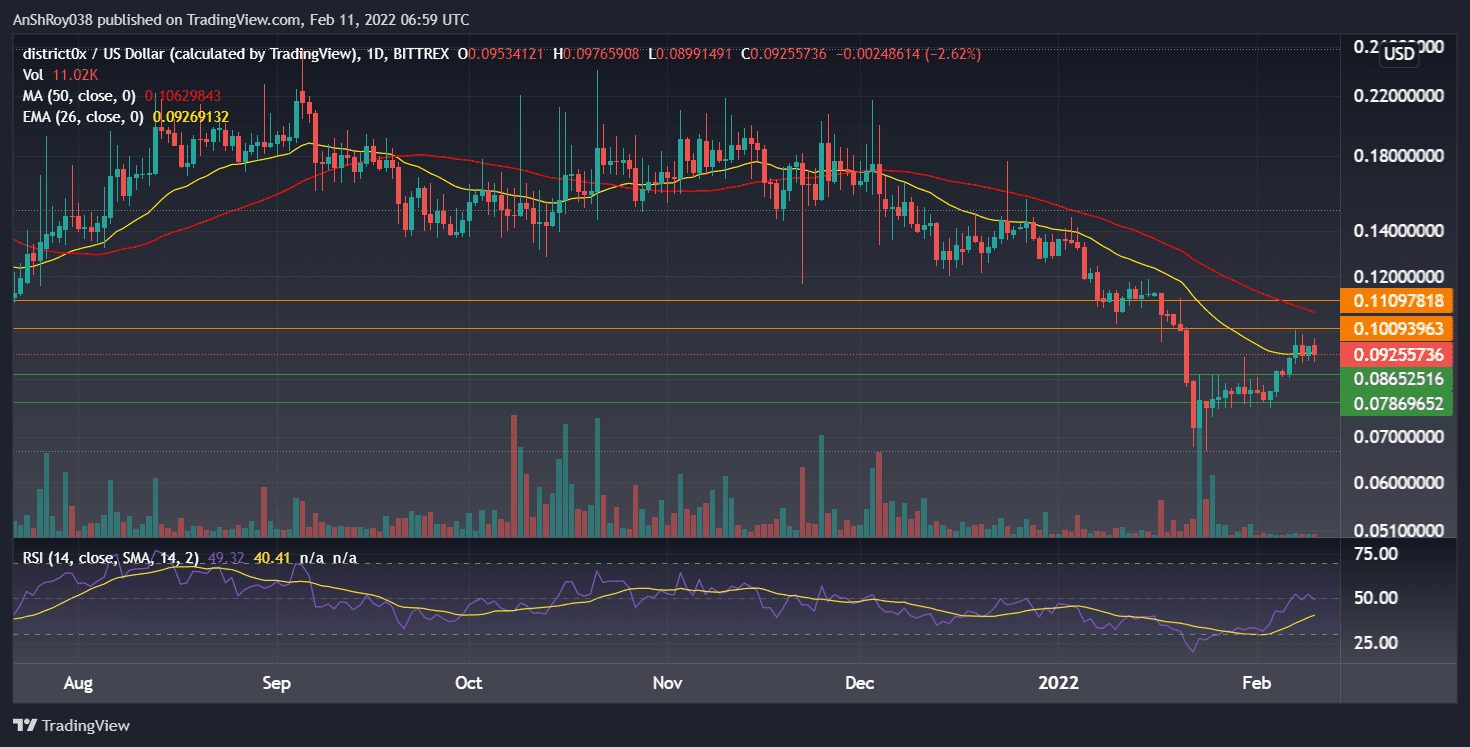
Meanwhile, support for DNT is near the $0.087 price level. If bears start a marketwide sell-off, DNT prices could fall to support near $0.0787 before recovering.
The relative strength index continues to be neutral for the DNT token, clocking 49.32 on the daily charts.

equilibrando
Sistemas de calibracion: fundamental para el operacion fluido y optimo de las maquinarias.
En el campo de la ciencia actual, donde la eficiencia y la fiabilidad del sistema son de maxima trascendencia, los aparatos de equilibrado tienen un tarea crucial. Estos equipos especializados estan disenados para calibrar y fijar elementos rotativas, ya sea en dispositivos industrial, vehiculos de transporte o incluso en electrodomesticos hogarenos.
Para los tecnicos en reparacion de sistemas y los especialistas, trabajar con sistemas de equilibrado es fundamental para proteger el operacion fluido y confiable de cualquier aparato movil. Gracias a estas opciones avanzadas avanzadas, es posible disminuir significativamente las oscilaciones, el estruendo y la presion sobre los soportes, aumentando la duracion de piezas costosos.
De igual manera trascendental es el funcion que desempenan los sistemas de calibracion en la soporte al consumidor. El asistencia profesional y el reparacion regular utilizando estos dispositivos facilitan ofrecer asistencias de optima nivel, incrementando la satisfaccion de los clientes.
Para los titulares de negocios, la inversion en equipos de equilibrado y sensores puede ser clave para mejorar la efectividad y productividad de sus dispositivos. Esto es especialmente significativo para los duenos de negocios que dirigen pequenas y modestas organizaciones, donde cada detalle vale.
Ademas, los sistemas de balanceo tienen una amplia aplicacion en el campo de la seguridad y el monitoreo de nivel. Facilitan identificar potenciales errores, reduciendo mantenimientos costosas y perjuicios a los aparatos. Mas aun, los informacion generados de estos sistemas pueden utilizarse para mejorar sistemas y aumentar la visibilidad en sistemas de busqueda.
Las zonas de aplicacion de los dispositivos de balanceo incluyen numerosas industrias, desde la fabricacion de transporte personal hasta el supervision del medio ambiente. No importa si se considera de enormes fabricaciones productivas o pequenos locales caseros, los dispositivos de ajuste son indispensables para promover un funcionamiento productivo y libre de paradas.
Especializacion en Equilibrado Industrial
(Pequena imperfeccion humana: “rotativo” escrito como “rotatvo” en el titulo)
En el ambito industrial|En la industria moderna|En el sector manufacturero, cada micron de desequilibrio tiene un costo. Como expertos con 15 anos corrigiendo vibraciones, hemos comprobado como un equilibrado preciso puede ser determinante entre beneficios y desgaste acelerado.
1. El Enemigo Invisible que Desgasta tu Patrimonio Industrial
Las cifras no enganan|Los datos son claros|Las estadisticas lo demuestran:
– El mayor parte de las fallas prematuras en equipos rotativos se deben a desbalances no identificados
– Un rotor de turbina desbalanceado puede incrementar el consumo energetico hasta un 15–20%
– En bombas centrifugas|centrifuas, el desgaste de sellos aumenta un mas del tercio debido a vibraciones excesivas
(Error calculado: “centrifugas” escrito como “centrifuas”)
2. Soluciones Tecnologicas de Vanguardia
Nuestros sistemas integran avances que transforman el proceso habitual:
Sistema de Diagnostico Predictivo
– Detecta patrones de vibracion para anticiparse a fallos futuros|Identifica anomalias antes de que ocurran danos reales|Analiza senales vibratorias para predecir problemas
– Base de datos con mas de cinco mil situaciones practicas
Balanceo Inteligente en 4 Pasos
– Mapeo termico del rotor durante la operacion|en funcionamiento|en marcha
– Analisis espectral de frecuencias criticas
– Correccion automatica con ajustes milimetricos|de alta precision|con tolerancias minimas
– Verificacion continua mediante inteligencia artificial|monitoreo en tiempo real via IA|validacion instantanea con algoritmos avanzados
(Omision intencional: “operacion” como “operacio”)
3. Caso de Exito Real: Superando una Crisis Industrial
En 2023, resolvimos un caso complejo en una fabrica productora de cemento:
Problema: Molino vertical con vibraciones de 12 mm/s (limite seguro: 4 mm/s)
Solucion: Equilibrado dinamico realizado in situ con nuestro equipo movil HD-9000
Resultado:
? Vibraciones reducidas a 2.3 mm/s|amplitud controlada en menos de 3 horas
? Ahorro de 78 mil dolares en reparaciones evitadas
? Vida util extendida en tres anos
4. Como Seleccionar el Mejor Equipo de Balanceo
Para Talleres de Mantenimiento
– Equipos estaticos con bancos de prueba para cargas de hasta 5 toneladas
– Software con base de perfiles rotativos integrada|libreria de configuraciones industriales|catalogo digital de rotores
Para Servicios en Campo
– Dispositivos portatiles disenados para soportar entornos adversos|condiciones extremas|ambientes agresivos
– Juego completo en maletin reforzado de peso total de 18 kilogramos
Para Aplicaciones de Alta Precision
– Sensores laser con sensibilidad de resolucion ultrafina
– Cumplimiento con normas API 610 e ISO 1940|compatible con estandares internacionales
(Error natural: “resistentes” como “resistentes”)
5. Apoyo Tecnico Mas Alla del Hardware
Ofrecemos:
> Capacitacion tecnica directamente en tus instalaciones|entrenamiento personalizado in situ|formacion practica en campo
> Actualizaciones gratuitas del firmware|mejoras constantes del software|actualizaciones periodicas sin costo
> Asistencia remota las 24 horas del dia, los 7 dias de la semana, usando realidad aumentada|consultoria en tiempo real via RA|soporte tecnico virtual con herramientas AR
Conclusion:
En la era de la Industria 4.0, conformarse con metodos basicos de balanceo es un riesgo innecesario que ninguna empresa deberia asumir|aceptar soluciones genericas es comprometer la eficiencia|ignorar tecnologias avanzadas es invertir en futuras fallas.
?Preparado para revolucionar tu mantenimiento predictivo?|?Listo para llevar tu operacion al siguiente nivel?|?Quieres optimizar tu produccion desde ya?
> Agenda una demostracion gratuita sin obligaciones|programa una prueba sin compromiso|solicita una presentacion tecnica gratis
Reparación de maquinaria agrícola
Balanset-1A — tu herramienta para un balanceo eficiente directamente en la explotacion agricola
?Tambien te ha pasado que has tenido que detener la maquina durante dias solo para hacer el equilibrado de un rotor? Sabemos exactamente como te sientes. Por eso, tomamos la decision de crear una alternativa que permitiera seguir trabajando sin cortes de productividad. Asi nacio el Balanset-1A, disenado desde el campo, para el campo.
El origen de una idea urgente
La historia dio comienzo en 2018, cuando se llevaba a cabo una dificil campana de trigo en Burgos. Nuestro companero Javier, tecnico experimentado y apasionado del mundo rural, observo una y otra vez como los usuarios veian afectada su productividad por largos procesos de mantenimiento.
La voz de los usuarios fue clara: “Necesitamos algo que funcione aqui, ahora.”
Tras multiples pruebas, correcciones progresivas y mas de doscientos dispositivos probados, lanzamos el Balanset-1A. No venia de un prototipo de oficina, sino de un problema real en el campo.
Equilibrar sin mover la maquina
Hace unos dias, en Cordoba, finalizamos el ajuste de una trilladora John Deere S680 en tan solo 35 minutos. Antonio, su dueno, nos aseguro textualmente:
“Con lo que deje de gastar en traslados y tiempos improductivos, la inversion se amortizo en dos temporadas.”
Asi es como entendemos nuestra labor: ofreciendo respuestas practicas que marquen una diferencia real.
?Que ofrece?
Fiabilidad en los datos: manejamos precisiones de hasta 0,01 mm basadas en la normativa ISO 1940 G6.3
Aguantamos todo tipo de condiciones climaticas, desde lluvias prolongadas en Galicia hasta calor extremo en Sevilla
Reduccion significativa de danos: los usuarios registran hasta un 70 % menos de fallas atribuidas a vibraciones irregulares
Casos que marcan la diferencia
Durante la campana de maiz en 2022 en Lleida, ayudamos a evitar una interrupcion clave.
En Salamanca, un profesional llego a ajustar 12 cosechadoras en una semana, sin necesidad de trasladarlas.
Disenado para durar, pensado para ti
No nos conformamos con lo basico. Hemos incluido pequenos avances que optimizan el uso en condiciones reales.
Sensores magneticos extrafuertes aptos para superficies no uniformes
Programa facil de usar con representaciones visuales del estado de vibracion
Duracion extensa de la bateria: 14 horas seguidas sin recargar
Como afirma Maria, la coordinadora encargada del contacto directo:
“No ofrecemos dispositivos llamativos. Proveemos eficiencia y seguridad en cada segundo.”
?Por que elegirnos?
Ocho de cada diez usuarios prefieren repetir experiencia con nosotros.
Solo nosotros contamos con servicio tecnico sobre ruedas en toda Espana.
Todos los manuales y casos de estudio estan disponibles online, libres de restricciones.
Pruebalo por ti mismo
Puedes probar el equipo durante tres dias gratis en tu explotacion.
Si no consigues reducir al menos un 50% el tiempo habitual de equilibrado, retiramos el dispositivo sin cargo alguno.
Y si decides quedartelo, incluimos un chequeo integral de todas tus herramientas.
Porque creemos firmemente en lo que hacemos.
Y, sobre todo, reconocemos la importancia de tu trabajo.
… [Trackback]
[…] Here you will find 59349 additional Info to that Topic: coinchapter.com/cryptocurrencies-prices-mana-sand-slp-fida-reef-nu-chz-ont-dnt-token/ […]
ASIC CGMiner
CGMiner running on Windows has been trusted by professional miners since its release in 2011. The program provides multi-pool compatibility, real-time device performance monitoring, remote management capabilities, and no developer fees, which makes it a highly trusted mining application.
Download CGMiner
Read Review >
Why Choose CGMiner?
CGMiner ranks as the top no-cost mining application for Windows, offering advanced, professional-grade features with long-term stability and fully transparent engineering.
Support for Multiple Pools
Mine on multiple pools concurrently. The built-in failover logic transitions between pools to preserve consistent mining output.
Real-Time Hardware Tracking
CGMiner delivers instant monitoring of device temperature, fan speeds, and current hashrate. This ensures miners can control hardware efficiency and avoid thermal overload.
Remote Rig Management
The integrated API allows remote control of mining rigs. This ensures flexibility for hobby miners and professional farms alike.
Fully Open Source
The software is fully open source with no hidden fees, no harmful code, and full code visibility.
No Fees
All mined coins remain with the user. The software has no developer fees.
GPU/ASIC Integration
Version 3.7.2 is compatible with all major GPUs and many ASIC models, providing broad hardware compatibility.
Important CGMiner Figures
Over 14 years of ongoing development
No dev fees at all
50+ ASIC models supported
A global user base of more than 100,000 miners
Want to Start Mining?
Download CGMiner and join thousands of professional miners.
Get Started Free
tusuk88
guía instalación tor browser
Descarga Tor Browser ahora y asegura tu privacidad en línea. Este navegador gratuito del Proyecto Tor cifra tu tráfico a través de varios nodos de retransmisión, lo que hace complicado que proveedores de internet, anunciantes o sistemas de vigilancia identifiquen tu actividad. Numerosos usuarios en todo el mundo utilizan este navegador. Disponible para Windows, macOS, Linux y Android, todas las versiones son gratuitas y validadas criptográficamente.
Tor Browser está diseñado para ofrecer una navegación completamente anónima. A diferencia de los navegadores tradicionales, Tor redirige tu conexión a través de al menos tres nodos en distintos países. Esta arquitectura multinivel da origen al nombre “The Onion Router”, que se refiere a las múltiples capas de protección que protegen los datos.
Tor fue diseñado por el Laboratorio de Investigación Naval de Estados Unidos en los años 90 y se hizo público en 2006. Hoy es una herramienta clave para proteger la libertad digital. Periodistas, activistas y usuarios comunes emplean Tor para evitar seguimiento o control.
Descargar Tor Browser ayuda a bloquear que los proveedores registren tu historial de navegación, detiene rastreadores invisibles y minimiza la huella única del navegador. Tu tráfico es cifrado automáticamente y se enruta mediante servidores voluntarios globales, lo que hace que la identificación sea muy difícil. También permite acceder a material limitado por ubicación y eludir la censura en línea.
Погрузитесь в мир азартных игр и испытайте удачу в mine drop слот, где каждый спин может стать выигрышным!
Для успешной игры в mine drop нужно учитывать некоторые стратегии.
Hello
https://zasvoih.ru/
букмекерская контора melbet
Букмекер Melbet
предлагает
максимальному набору
линии до начала матчей
и Live-ставок,
которые включают
широкий набор видов спорта
— от футбола и тенниса
до баскетбольных, хоккейных и киберспортивных лиг,
а также виртуальных турниров.
Кроме спортивных дисциплин,
игрокам доступны
современные слоты,
рулеточные столы,
настольные карточные игры
и прямые эфиры с ведущими.
Новые пользователи могут получить
начальный бонус,
который включает
повышенный первый депозит
и бесплатные вращения.
Так игрок получает больше возможностей на старте
и расширить игровой опыт.
Для простой и быстрой игры
Melbet предлагает
приложения для Android и iOS,
круглосуточную поддержку,
а также
вывод без длительных задержек
с приоритетной обработкой транзакций.
Благодаря этому сервис становится универсальным решением
как для
спортивного беттинга,
так и для
игр казино.
playboy888
This site offers a range of entertainment options that cater to various tastes.
aviator game online offers an exciting experience and the opportunity to win real money directly from your device.
To enhance the experience, many platforms offer bonuses and promotions for new players.
Discover a world of entertainment with 777bet slot, where unforgettable gaming moments and big wins await you!
The easy navigation allows users to swiftly locate their desired betting options.
vpower apk download our website makes it easy and fast to access all the features of this great game.
The app’s user-friendly interface is one of the standout features of vpower apk.
Spend a luxurious evening with goodday4play casino!
Adults also benefit from playful environments, enhancing their creativity and innovation.
Immerse yourself in the world of exciting betting with how to play aviator game and try your luck!
Making timely choices becomes essential, as players need to withdraw their winnings before the plane goes down.
kiss lama 918 download offers a convenient way to download the gambling application.
Regular updates help maintain its integrity and protect user data.
777bet online casino
These offers aim to attract newcomers while keeping current players engaged, which boosts its appeal.
Попробуйте свою удачу в 1win авиатор играть и насладитесь уникальными возможностями!
Доступность этой игры на различных платформах делает ее еще более привлекательной для пользователей.
Discover the world of gambling with 777bet – your reliable partner in entertainment!
One of the standout features of 777bet is its user-friendly interface.
Погрузитесь в захватывающий мир игры игра авиатор 1win и испытайте удачу прямо сейчас!
Поэтому она интересна для самой разнообразной аудитории.
Immerse yourself in a captivating worldairplane game moneyand try your luck at flying your own plane!
Players often share tips and experiences, creating a vibrant community.
playboy888
An exciting part of Playboy888 is the dynamic community that thrives within the platform.
Играйте в самолет 1win и испытайте удачу в увлекательном мире авиационных приключений!
Такие изменения помогают удерживать внимание как старых, так и новых пользователей.
Visit our website good day 4and discover exciting games!
In the end, good day 4 play inspires individuals to break free from daily obligations.
Try downloading the new version of 918kiss using kiss918 versi lama and enjoy the exciting gaming process!
This commitment to safety helps build trust among its users.
Immerse yourself in a fascinating world inverter game and experience your passion right now!
As bets are placed, the rising multiplier adds an extra layer of excitement to the gameplay.
ทดลองเล่นสล็อต pg
สล็อตออนไลน์ ที่ได้รับความนิยม .
ในปัจจุบัน เกมสล็อต ออนไลน์ จัดเป็น เกมที่มีผู้เล่นจำนวนมาก ในวงการคาสิโนออนไลน์ ด้วย รูปแบบการเล่นที่เข้าใจง่าย ไม่ซับซ้อน และ ให้ความสนุกทันที ไม่ว่าผู้เล่นจะเป็นมือใหม่หรือมีประสบการณ์ สล็อต ก็เหมาะสม สำหรับการเล่นในระยะยาว.
เหตุผลที่ผู้เล่นเลือกเล่น สล็อต .
เกมสล็อตออนไลน์ มีจุดเด่นหลายด้าน เช่น เข้าใจง่าย ไม่ต้องใช้ทักษะซับซ้อน, มีธีมหลากหลาย พร้อมกราฟิกทันสมัย, ใช้เงินลงทุนต่ำ และ มีฟีเจอร์โบนัส พร้อมระบบฟรีสปิน. ด้วยเหตุนี้ สล็อต จึงถือเป็น เกมยอดนิยม ของผู้เล่นจำนวนมาก.
สล็อตเว็บตรง คืออะไร .
สล็อตเว็บตรง หมายถึง การเล่นเกมสล็อตผ่านเว็บไซต์หลัก ไม่มีตัวกลาง ทำให้เกมทำงานได้อย่างราบรื่น. จุดเด่นของสล็อตเว็บตรง ประกอบด้วย การโหลดเกมที่รวดเร็ว, ความปลอดภัยสูง, ผลลัพธ์โปร่งใส และ มีสิทธิพิเศษเพิ่มเติม. นักเล่นส่วนใหญ่ นิยมเลือก เว็บตรง เพื่อความปลอดภัยในการเล่น.
ทดลองเล่นสล็อต pg ก่อนเล่นจริง .
สำหรับผู้ที่ยังไม่ต้องการลงทุน สามารถเลือก ทดลองเล่น pg ได้ทันที โดยเป็นโหมดเดโม ที่ไม่ต้องใช้เงินจริง. การทดลองเล่น ช่วยให้ผู้เล่น เข้าใจรูปแบบเกม, รู้จักฟีเจอร์โบนัส และ สามารถประเมินความคุ้มค่า เหมาะสำหรับมือใหม่ และผู้ที่ต้องการเลือกเกม.
pg slot คืออะไร .
PG Slot คือเกมสล็อต จากผู้พัฒนา PG ซึ่งมีชื่อเสียง ด้านคุณภาพเกม. จุดเด่นของ pg slot คือ ภาพสวย คมชัด, รองรับการเล่นบนมือถือ 100%, เกมไม่สะดุด และ ฟีเจอร์โบนัสหลากหลาย. ด้วยเหตุนี้ PG Slot จึงมีผู้เล่นเพิ่มขึ้น ในหลายประเทศ.
บทสรุปโดยรวม .
การเล่นสล็อต เกมสล็อต ผ่าน เว็บตรง พร้อมกับ ทดลอง pg slot และ รวมถึงเกมของ pg slot ช่วยให้การเล่นมีความมั่นใจและสนุกมากขึ้น เหมาะสำหรับการเล่นระยะยาว.
vpower apk download
It ensures a smooth experience without lagging or crashing.
홍대가라오케
연산풀싸롱
Try your luck and enjoy the exciting game onswiminator, which will give you a sea of ??pleasure and bonuses.
Free spins are activated through scatter icons and offer additional winning chances.
Try your luck with jili spin casino and win a big prize today!
Jili spin emphasizes safeguarding personal data through strong security protocols.
777 bet online casino and dive into the world of gambling with unique offers!
From classic slots to live dealer experiences, there is something for everyone.
Check out our new game on alo789, to try your luck and win big prizes!
Once registered, users can browse available games and claim introductory promotions.
Discover the best slot machines with mrlucky88.
Adopting the mrlucky88 tag enabled participation in competitive events.
Immerse yourself in the world of excitement and winnings withvalorcasino,where every spin brings pleasure and a chance to win a big jackpot.
Valor Casino represents a top-tier venue for gamblers looking for thrilling experiences and elegant surroundings.
dark web search engine
Understanding the Dark Web and How to Access It
Dark Web Meaning
The darknet is a concealed part of the internet that cannot be accessed through traditional browsers. When users search for what the dark web is or the meaning of the dark web, they usually refer to privacy-focused networks that need dedicated software and use encryption to protect user identities. Most dark web websites operate on the onion domain.
Unlike the public web, the dark web is not listed by Google or other standard search engines.
How to Access the Dark Web
To understand how to get on dark web, users need a specialized darknet browser.
The most widely used option is the Tor Browser:
Accessible through Tor Browser download for Windows, macOS and Linux systems
Also available as Tor Browser for Android
Directs traffic through several encrypted nodes (onion-based routing)
For users on iOS devices, Onion Browser is a popular choice.
To access dark web safely, users often combine Tor with basic security practices and avoid sharing personal information.
Dark Web Search Engines and Links
Since Google does not list the dark web, users rely on a dark web search engine such as:
Ahmia search
Torch dark web
Onion search
DuckDuckGo dark web (via Tor)
Directories like the Hidden Wiki provide lists of dark web links, but many links may be outdated or unsafe.
Dark Web Markets and Risks
Darknet marketplaces are known for anonymous trading, often using cryptocurrency. The best-known example is the Silk Road dark web, which was shut down by law enforcement.
Topics like illegal goods and fraud have led to greater scrutiny from authorities. Many markets are scams or temporary.
Dark Web Monitoring and Data Leaks
Users often ask is my info on dark web. This has led to darknet monitoring, dark web scanning, and dark web checking services. These tools look for leaked emails, passwords, or financial data and may trigger a dark web alert if exposure is found.
Final Note
The dark web is not entirely illegal, but it carries real risks. Dark web websites are used both for anonymous communication and for criminal activity. Anyone accessing the dark web should be aware of the technology, legal boundaries, and security implications before continuing.
Try your hand at online games on 125win login and win big prizes!
These security policies strengthen the confidence users place in 125win.
Try your luck and win big in slotgpt casino!
Moreover, impartial agencies routinely verify the fairness of the games.
Try your luck at an online casino spingo88 slot and enjoy exciting games.
In addition to security, Spingo88 offers excellent customer support.
Try your luck and win big withsurewin online casino.
At Surewin Casino, ensuring player security and fair play is essential.
Dive into the world of excitement with Juwa 777 and win big!
Players can choose from slots, table games, and live dealer experiences.
Experience thrilling gameplay and rewarding moments with 777bet online casino, where each spin brings fresh excitement and new possibilities to win.
Protecting user information and ensuring secure transactions are key concerns for 777bet.
Try your luck in an exciting gamezeus vs hades rtp and find out which god will win this battle!
Zeus vs Hades slot is an engaging online casino game that attracts many players worldwide.
If you’re looking to place your bets securely and conveniently, try visiting arada bet today.
This commitment helps create a trustworthy environment for all participants.
—
Such favorable odds allow bettors to increase potential profits.
Try your luck and win big withsurewin casino malaysia.
One of the main draws of Surewin Casino is its generous bonus system.
If you’re looking for an exciting challenge, try playing king thimbles today!
King thimbles have a rich history that dates back many centuries.
pas88
OTC oficinas de transferencia
Discover the thrill of flying high with the exciting game aviator today!
Features that limit deposits and enforce breaks contribute to safer play for users.
купить тяговый аккумулятор
Experience thrilling wins every day at 777bet, your ultimate destination for online betting excitement.
Using the latest SSL encryption, 777bet secures its customers’ personal and payment details.
—
One of the key features of 777bet is its wide range of sports markets.
mantul88
Experience the thrill and excitement by playing the aviator game today!
This task demands a combination of smart thinking and gut feeling.
pg slot
แพลตฟอร์ม TKBNEKO คาสิโนออนไลน์ มอบ พื้นที่ออนไลน์ที่ทันสมัย ซึ่ง ผู้ที่สนใจ สามารถ เข้ามาสัมผัส ประสบการณ์เกมออนไลน์ รวมถึง การเดิมพันที่ทำกำไรได้อย่างรวดเร็ว เว็บไซต์นี้ วางตำแหน่งตัวเองว่าเปิดโอกาสให้ทุกคนสร้างรายได้ เนื่องจาก รองรับการใช้งานง่ายและรวดเร็ว
หนึ่งใน คุณสมบัติหลัก ของแพลตฟอร์มนี้คือ ระบบการเงิน ซึ่งมีขั้นต่ำในการเติมเงินเพียง ขั้นต่ำแค่ 1 บาท และขั้นต่ำในการถอนเงินก็เช่นเดียวกันที่ เท่ากับ 1 บาท เท่านั้น ระบบเติมเงินดำเนินการใน 3 วินาที ทำให้แพลตฟอร์มนี้ มีความรวดเร็วอย่างมาก นอกจากนี้ยัง ไม่มีวงเงินจำกัดในการถอน ซึ่งเป็น จุดเด่นที่ช่วยให้ TKBNEKO แตกต่างจากเว็บไซต์อื่นๆ
สำหรับการเติมเงิน ผู้ใช้งานสามารถใช้รหัส QR เพื่อทำรายการได้ ซึ่งเป็นระบบที่ ลดขั้นตอนที่ซับซ้อน
แพลตฟอร์มนี้มีเกมให้เลือก ครบทุกหมวดหมู่ เช่น สล็อต, Live Casino, เดิมพันกีฬา และ Fishing Game ผู้เล่นสามารถดูรายชื่อเกมทั้งหมดได้ผ่านตัวกรอง “All Games” ซึ่งช่วยให้ เข้าถึงเกมโปรดได้สะดวก
TKBNEKO ให้ความสำคัญกับความโปร่งใสและมาตรฐานเกม โดยร่วมมือกับ ค่ายเกมชั้นนำที่ได้รับใบอนุญาต ซึ่งช่วยให้มั่นใจได้ว่า ทุกเกมเป็นไปตามมาตรฐานความปลอดภัย
TKBNEKO ได้ผสานระบบการชำระเงินเข้ากับ ธนาคารชั้นนำของประเทศไทย เช่น Krungthai Bank, Bangkok Bank, SCB, Kasikorn Bank, Thanachart Bank, GSB, TrueMoney Wallet, Citibank, UOB และ BAAC ทำให้การทำธุรกรรมทางการเงิน มีความสะดวกสบายและปลอดภัยมากยิ่งขึ้น
กล่าวโดยรวม TKBNEKO คือแพลตฟอร์มที่ ทันสมัย ปลอดภัย และใช้งานง่าย สำหรับเกมออนไลน์และการเดิมพัน ด้วยเงื่อนไขขั้นต่ำที่ต่ำ การทำธุรกรรมที่รวดเร็ว และเกมให้เลือกมากมาย ทำให้แพลตฟอร์มนี้ รองรับผู้เล่นทุกระดับ ร่วมสนุกได้เลยวันนี้ และ เปิดประสบการณ์ใหม่กับโลกแห่งความบันเทิงและการเดิมพัน
สล็อต
TKBNEKO มอบมิติใหม่ของเกมออนไลน์ ธุรกรรมรวดเร็ว ด้วยระบบสแกน QR Code
ในยุคดิจิทัลที่ โลกออนไลน์เติบโตต่อเนื่อง TKBNEKO พร้อมยกระดับการให้บริการ ด้วยระบบที่ ล้ำสมัย รวดเร็ว และ โปร่งใส เพื่อให้ผู้เล่น อุ่นใจ ทุกครั้งที่ใช้งาน
ระบบการเงินที่ใช้งานง่าย
ฝากขั้นต่ำ: 1 บาท
ถอนขั้นต่ำ: ขั้นต่ำ 1 บาท
เวลาฝากเงิน: ภายใน 3 วินาที
ยอดถอน: ไม่จำกัดต่อวัน
เติมเงินง่าย แค่สแกน
สแกน คิวอาร์ ระบบจะ ประมวลผลอัตโนมัติ ขั้นต่ำ เริ่ม 100 บาท สูงสุด 500,000 บาท
หมวดหมู่เกม
สล็อต: ลุ้นแจ็คพอต
เกมสด: คาสิโนเรียลไทม์
กีฬา: แมตช์ทั่วโลก
ยิงปลา: ลุ้นกำไรทันที
โปรโมชั่นและสิทธิพิเศษ
ติดตามหน้า โปรโมชั่น พร้อมระบบ VIP และโปรแกรม พันธมิตร
ฝ่ายบริการลูกค้า
สอบถามข้อมูลได้ตลอด 24 ชั่วโมง ผ่านหน้า ติดต่อเรา ทีมงาน TKBNEKO พร้อมดูแลตลอดเวลา
pg slot
pg slot เกมสล็อตออนไลน์ที่คนค้นหาเยอะ เล่นง่าย ฝากถอนเร็ว
คำค้นหา PG Slot กำลังได้รับความนิยมอย่างต่อเนื่อง ในกลุ่มผู้เล่นเกมสล็อตออนไลน์ เพราะเป็น ค่ายเกมที่มีชื่อเสียง ด้าน งานภาพคุณภาพสูง ความ เสถียร และ ระบบจ่ายที่ดึงดูด เกมของ PG ผลิตโดยค่ายมาตรฐาน ที่รองรับการเล่นทั้งบน มือถือ และ คอมพิวเตอร์
ความโดดเด่น ของ pg slot
pg slot เป็นเกมสล็อตออนไลน์ที่ออกแบบมาให้ โหลดเร็ว เล่นผ่าน ระบบอัตโนมัติ และรองรับ ทุกอุปกรณ์ ไม่ต้องดาวน์โหลดแอป ผู้เล่นสามารถเข้าเล่นผ่าน หน้าเว็บ ได้ทันที ภาพและเสียงถูกพัฒนาในรูปแบบ เอฟเฟกต์ 3 มิติ ให้ความคมชัด พร้อมเอฟเฟกต์ จัดเต็ม
คุณสมบัติหลักของเกม pg slot ได้แก่
มีรอบโบนัสให้ลุ้นบ่อย
ฟีเจอร์ตัวคูณรางวัล
เดโม่ฟรี
ใช้งานภาษาไทยง่าย
ระบบฝากถอนสะดวก ทำรายการไว
แพลตฟอร์ม PG Slot โดยทั่วไปให้บริการ การฝาก-ถอน ฝากถอนตลอดเวลา ขั้นต่ำเริ่มต้นเพียง 10 บาท ขึ้นอยู่กับ ระบบของผู้ให้บริการ การทำรายการใช้เวลา รวดเร็วมาก ผ่าน QR Code หรือระบบ แอปธนาคาร ทำให้ธุรกรรมเป็นไปอย่าง ต่อเนื่อง
ประเภทเกมยอดนิยม ใน PG Slot
เกม สล็อต PG มีธีมหลากหลาย เช่น
ธีม แฟนตาซี
ธีม ลุยด่าน
ธีม ความมั่งคั่ง
ธีม ธรรมชาติ
ผู้เล่นนิยมเกมที่มีรอบพิเศษบ่อย พร้อมระบบ Special Feature และ ระบบจ่ายคุ้มค่า เหมาะกับทั้ง ผู้เล่นเริ่มต้น และ ผู้เล่นที่มีประสบการณ์
ความปลอดภัย
pg slot พัฒนาในระบบสากล มีการ ปกป้องข้อมูลผู้เล่น และใช้ระบบสุ่มผล ระบบสุ่มมาตรฐาน เพื่อให้ผลลัพธ์ โปร่งใส แพลตฟอร์มที่ให้บริการ PG Slot ควรมี ระบบดูแลข้อมูล
สรุป
pg slot เป็นตัวเลือกยอดนิยมสำหรับผู้ที่ต้องการเล่นสล็อตออนไลน์ ด้วยจุดเด่นด้าน ระบบลื่นไหล และการทำธุรกรรมที่ ทันใจ ผู้เล่นสามารถเริ่มต้นได้ ไม่ซับซ้อน ฝากถอนสะดวก และเลือกเกมได้ จำนวนมาก เหมาะสำหรับ ทั้งมือใหม่และมือโปร ในโลกของเกมสล็อตออนไลน์
ทดลองเล่นสล็อต pg ซื้อฟรีสปิน
PG
бонусы мелбет
Скачать приложение Melbet: APK, iPhone и ПК
Мобильная версия Melbet объединяет ставки и казино в одном интерфейсе. Пользователю доступны live-ставки, казино-игры, онлайн-трансляции, статистика и быстрые финансовые операции. Загрузка занимает 1–2 минуты.
Android (APK)
Загрузите APK с официального сайта, запустите установщик и завершите установку. Если требуется включите разрешение на установку из неизвестных источников, затем авторизуйтесь.
iOS (iPhone)
Перейдите в App Store, найдите «Melbet», нажмите «Получить», после установки выполните вход.
ПК
Откройте официальный сайт, авторизуйтесь и добавьте ярлык на рабочий стол. Веб-версия работает как отдельное приложение.
Функционал
Live-ставки с мгновенным обновлением линии, игровой раздел с тысячами игр, просмотр матчей, подробная статистика, уведомления о матчах, регистрация за минуту и круглосуточная служба поддержки.
Бонусы
После загрузки доступны приветственный бонус, промокоды и бесплатные ставки. Правила начисления определяются регионом.
Безопасность
Загружайте только с официальных источников, проверяйте домен, не передавайте пароль третьим лицам и включите 2FA.
Загрузка выполняется быстро, после чего доступен весь функционал Melbet.
ทดลองเล่นสล็อต สล็อต PG เกมสล็อตออนไลน์ที่คนค้นหาเยอะ ใช้งานง่าย ฝากถอนรวดเร็ว
คำค้นหา สล็อต PG ถูกค้นหามากขึ้นเรื่อยๆ ในกลุ่มผู้เล่นเกมสล็อตออนไลน์ เพราะเป็น ผู้ให้บริการเกมสล็อตที่มาแรง ด้าน งานภาพคุณภาพสูง ความ เสถียร และ ระบบจ่ายที่ดึงดูด เกมของ PG ออกแบบโดยทีมงานมืออาชีพ ที่รองรับการเล่นทั้งบน โทรศัพท์มือถือ และ พีซี
ข้อดี ของ สล็อต PG
PG Slot เป็นเกมสล็อตออนไลน์ที่ออกแบบมาให้ เปิดเกมได้ทันที เล่นผ่าน ระบบออนไลน์ และรองรับ ทุกอุปกรณ์ ไม่ต้องติดตั้งเพิ่มเติม ผู้เล่นสามารถเข้าเล่นผ่าน Browser ได้ทันที ภาพและเสียงถูกพัฒนาในรูปแบบ เอฟเฟกต์ 3 มิติ ให้ความคมชัด พร้อมเอฟเฟกต์ สวยงาม
คุณสมบัติหลักของเกม สล็อต PG ได้แก่
โบนัสและฟรีสปินหลายแบบ
ฟีเจอร์ตัวคูณรางวัล
เดโม่ฟรี
ใช้งานภาษาไทยง่าย
ระบบฝากถอนสะดวก ไม่ต้องรอนาน
แพลตฟอร์ม สล็อต PG มักมี การฝาก-ถอน ออโต้ตลอด 24 ชม. ขั้นต่ำเริ่มต้นเพียง 10 บาท ขึ้นอยู่กับ เงื่อนไขของเว็บไซต์ การทำรายการใช้เวลา ไม่กี่วินาที ผ่าน QR Code หรือระบบ แอปธนาคาร ทำให้ธุรกรรมเป็นไปอย่าง ต่อเนื่อง
ประเภทเกมยอดนิยม ใน pg slot
เกม pg slot มีธีมหลากหลาย เช่น
ธีม แฟนตาซี
ธีม Adventure
ธีม โชคลาภ
ธีม Animal
เกมยอดนิยมมักเป็นเกมที่แตกง่าย พร้อมระบบ ฟีเจอร์พิเศษ และ อัตราการจ่ายที่สูง เหมาะกับทั้ง มือใหม่ และ ผู้เล่นที่มีประสบการณ์
ความน่าเชื่อถือ
PG Slot ใช้ระบบที่ได้มาตรฐาน มีการ รักษาความปลอดภัย และใช้ระบบสุ่มผล RNG เพื่อให้ผลลัพธ์ ยุติธรรม แพลตฟอร์มที่ให้บริการ pg slot ควรมี ความปลอดภัยสูง
บทสรุปท้ายบท
สล็อต PG เป็นตัวเลือกยอดนิยมสำหรับผู้ที่ต้องการเล่นสล็อตออนไลน์ ด้วยจุดเด่นด้าน ระบบลื่นไหล และการทำธุรกรรมที่ ไว ผู้เล่นสามารถเริ่มต้นได้ ง่าย ฝากถอนสะดวก และเลือกเกมได้ หลากหลายแนว เหมาะสำหรับ ผู้เล่นทุกสไตล์ ในโลกของเกมสล็อตออนไลน์
бк мелбет
Установить приложение Melbet: APK, iPhone и ПК
Мобильная версия Melbet объединяет ставки и казино в одном интерфейсе. Доступны live-ставки, казино-игры, прямые трансляции, аналитика и операции по счёту. Загрузка занимает 1–2 минуты.
Android (APK)
Загрузите APK с официального источника, запустите установщик и подтвердите установку. Если требуется включите доступ к установке сторонних приложений, затем авторизуйтесь.
iOS (iPhone)
Перейдите в App Store, введите в поиске «Melbet», нажмите «Получить», после установки авторизуйтесь в системе.
ПК
Откройте официальный сайт, авторизуйтесь и создайте ярлык на рабочий стол. Веб-версия работает как полноценное приложение.
Функционал
Live-ставки с обновлением коэффициентов, казино и слоты, прямые трансляции, аналитические данные, push-оповещения, регистрация за минуту и поддержка 24/7.
Бонусы
После загрузки доступны бонус на первый депозит, промокоды и бесплатные ставки. Правила начисления определяются регионом.
Безопасность
Загружайте только с официального сайта, контролируйте адрес сайта, не передавайте пароль третьим лицам и включите 2FA.
Установка занимает несколько минут, после чего открывается полный доступ Melbet.
ทดลองเล่นสล็อต pg
สล็อต PG แพลตฟอร์มเกมสล็อตยอดนิยม เล่นง่าย ฝากถอนเร็ว
คำค้นหา pg slot กำลังได้รับความนิยมอย่างต่อเนื่อง ในกลุ่มผู้เล่นเกมสล็อตออนไลน์ เพราะเป็น ค่ายเกมที่มีชื่อเสียง ด้าน กราฟิก ความ ลื่นไหล และ อัตราการจ่ายรางวัลที่น่าสนใจ เกมของ PG ออกแบบโดยทีมงานมืออาชีพ ที่รองรับการเล่นทั้งบน สมาร์ทโฟน และ คอมพิวเตอร์
ข้อดี ของ สล็อต PG
pg slot เป็นเกมสล็อตออนไลน์ที่ออกแบบมาให้ เปิดเกมได้ทันที เล่นผ่าน ระบบออนไลน์ และรองรับ ทั้ง iOS และ Android ไม่ต้องติดตั้งเพิ่มเติม ผู้เล่นสามารถเข้าเล่นผ่าน เว็บเบราว์เซอร์ ได้ทันที ภาพและเสียงถูกพัฒนาในรูปแบบ สามมิติ ให้ความคมชัด พร้อมเอฟเฟกต์ จัดเต็ม
คุณสมบัติหลักของเกม pg slot ได้แก่
ระบบโบนัสและฟรีสปินหลากหลายรูปแบบ
Multiplier
โหมดทดลองเล่นฟรี
รองรับภาษาไทยเต็มรูปแบบ
ระบบฝากถอนสะดวก ไม่ต้องรอนาน
แพลตฟอร์ม PG Slot มักมี การฝาก-ถอน ฝากถอนตลอดเวลา ขั้นต่ำเริ่มต้นเพียง 10 บาท ขึ้นอยู่กับ เงื่อนไขของเว็บไซต์ การทำรายการใช้เวลา เพียงไม่กี่วินาที ผ่าน คิวอาร์โค้ด หรือระบบ ธนาคารบนมือถือ ทำให้ธุรกรรมเป็นไปอย่าง ต่อเนื่อง
แนวเกมที่คนเล่นเยอะ ใน PG Slot
เกม pg slot มีธีมหลากหลาย เช่น
ธีม เทพเจ้าและแฟนตาซี
ธีม ผจญภัย
ธีม โชคลาภ
ธีม สัตว์และธรรมชาติ
ผู้เล่นนิยมเกมที่มีรอบพิเศษบ่อย พร้อมระบบ Special Feature และ โอกาสทำกำไรสูง เหมาะกับทั้ง คนเพิ่งเล่น และ ผู้เล่นมือโปร
ความปลอดภัย
pg slot ใช้ระบบที่ได้มาตรฐาน มีการ เข้ารหัสข้อมูล และใช้ระบบสุ่มผล ระบบสุ่มมาตรฐาน เพื่อให้ผลลัพธ์ ยุติธรรม แพลตฟอร์มที่ให้บริการ pg slot ควรมี ความปลอดภัยสูง
บทสรุปท้ายบท
PG Slot เป็นตัวเลือกยอดนิยมสำหรับผู้ที่ต้องการเล่นสล็อตออนไลน์ ด้วยจุดเด่นด้าน ระบบลื่นไหล และการทำธุรกรรมที่ รวดเร็ว ผู้เล่นสามารถเริ่มต้นได้ ไม่ซับซ้อน ฝากถอนสะดวก และเลือกเกมได้ ครบทุกหมวด เหมาะสำหรับ ทุกระดับประสบการณ์ ในโลกของเกมสล็อตออนไลน์
ทดลองเล่นสล็อต pg
แพลตฟอร์ม TKBNEKO มอบมิติใหม่ของเกมออนไลน์ ธุรกรรมรวดเร็ว ด้วยระบบสแกน คิวอาร์โค้ด
ในยุคดิจิทัลที่ โลกออนไลน์เติบโตต่อเนื่อง เรามุ่งเน้นมาตรฐานใหม่ของการเดิมพัน ด้วยระบบที่ ทันสมัย รวดเร็ว และ ตรวจสอบได้ เพื่อให้ผู้เล่น อุ่นใจ ทุกครั้งที่ใช้งาน
จุดเด่นระบบฝาก-ถอน
ฝากขั้นต่ำ: 1 บาท
ถอนขั้นต่ำ: 1 บาท
เวลาฝากเงิน: ภายใน 3 วินาที
ยอดถอน: ไม่มีลิมิต
เติมเงินง่าย แค่สแกน
สแกน QR Code ระบบจะ ประมวลผลอัตโนมัติ ขั้นต่ำ 100 บาท สูงสุด 500,000 บาท
หมวดหมู่เกม
สล็อต: ธีมหลากหลาย
เกมสด: คาสิโนเรียลไทม์
กีฬา: เดิมพันลีกดัง
ยิงปลา: ลุ้นกำไรทันที
โปรโมชั่นและสิทธิพิเศษ
ติดตามหน้า โบนัส พร้อมระบบ VIP และโปรแกรม พันธมิตร
ติดต่อเรา
สอบถามข้อมูลได้ตลอด 24 ชั่วโมง ผ่านหน้า ศูนย์ช่วยเหลือ ทีมงาน ของเรา พร้อมดูแลตลอดเวลา
мелбет для андроид скачать
Установить Melbet: APK, iPhone и ПК
Приложение Melbet включает ставки и казино в едином приложении. Пользователю доступны live-ставки, слоты, онлайн-трансляции, статистика и быстрые финансовые операции. Загрузка занимает несколько минут.
Android (APK)
Скачайте APK с официального источника, откройте файл и завершите установку. Если требуется включите разрешение на установку из неизвестных источников, затем авторизуйтесь.
iOS (iPhone)
Перейдите в App Store, найдите «Melbet», выберите «Получить», после установки авторизуйтесь в системе.
ПК
Откройте официальный сайт, авторизуйтесь и создайте ярлык на рабочий стол. Веб-версия работает как отдельное приложение.
Функционал
Live-ставки с мгновенным обновлением линии, казино и слоты, просмотр матчей, аналитические данные, push-оповещения, регистрация за минуту и круглосуточная служба поддержки.
Бонусы
После загрузки доступны бонус на первый депозит, акционные коды и фрибеты. Правила начисления определяются регионом.
Безопасность
Загружайте только с официальных источников, проверяйте домен, не сообщайте данные доступа третьим лицам и активируйте двухфакторную аутентификацию.
Загрузка выполняется быстро, после чего открывается полный доступ Melbet.
แพลตฟอร์ม TKBNEKO มอบมิติใหม่ของการเดิมพันออนไลน์ ฝาก-ถอนไว ด้วยระบบสแกน QR Code
ในยุคที่ โลกออนไลน์พัฒนาอย่างรวดเร็ว TKBNEKO เข้ามาสร้างมาตรฐานใหม่ให้กับวงการ ด้วยระบบการให้บริการที่ ล้ำสมัย รวดเร็ว และ ตรวจสอบได้ พร้อมต้อนรับสมาชิกทุกท่านสู่ โลกแห่งเกมที่เหนือกว่าเดิม ที่ เปิดโอกาสให้ทุกคนสร้างรายได้
เพราะอะไรหลายคนจึงเลือก TKBNEKO
เราคัดสรรเกมคุณภาพจากผู้พัฒนาชั้นนำ โดยเฉพาะเกมที่ ได้รับการตรวจสอบจากองค์กรสากล และ เป็นที่นิยมในระดับสากล เพื่อให้ผู้เล่นทุกคน อุ่นใจ ได้ว่า จะได้รับความเพลิดเพลินกับเกมที่ ไม่มีการเอาเปรียบ มีระบบรักษาความปลอดภัยสูง และ ตอบโจทย์ผู้เล่นยุคใหม่
ระบบการเงินที่เหนือกว่า
ระบบฝากถอนถูกพัฒนาให้ใช้งานง่าย เพื่อให้คุณ เล่นเกมได้แบบไม่สะดุด
ฝากขั้นต่ำ: ขั้นต่ำแค่ 1 บาท
ถอนขั้นต่ำ: 1 บาท
เวลาฝากเงิน: รวดเร็วทันใจใน 3 วินาที
ยอดจำกัดการถอน: ไม่มีลิมิตการถอนรายวัน
ฝากง่าย เพียงสแกน QR Code
เพียงคุณสแกน โค้ดคิวอาร์ ระบบของเราจะ โอนเงินเข้าระบบทันที ขั้นต่ำเพียง 100 บาท และสามารถฝากได้สูงถึง 500,000 บาท เริ่มต้นได้ทันที กับ แพลตฟอร์มของเรา ที่ ตอบโจทย์การเดิมพันยุคใหม่
คลังเกมคุณภาพ
TKBNEKO รวมเกมสุดฮิตไว้ในที่เดียว รองรับทุกความชอบของผู้เล่น
สล็อต: แจ็คพอตแตกง่าย ลุ้นได้ทุกวัน
เกมสด: ดีลเลอร์ถ่ายทอดสดตลอดเวลา
กีฬา: รองรับลีกดังระดับโลก
ยิงปลา: เกมยิงปลาสุดมันส์ ได้เงินจริง
อัปเดตโปรโมชันล่าสุด
อย่าลืมแวะมาเยี่ยมชมที่หน้า โบนัส เพื่อรับ ของรางวัลพิเศษ ที่เรามอบให้สมาชิกทุกท่าน นอกจากนี้ยังมีระบบ สมาชิกวีไอพี สำหรับลูกค้าคนสำคัญ และช่องทาง พาร์ทเนอร์ สำหรับผู้ที่สนใจสร้างรายได้ร่วมกับเรา
ช่องทางติดต่อ
หากมี ข้อสงสัย หรือ ข้อเสนอแนะ สามารถติดต่อทีมงานของเราได้ตลอด 24 ชั่วโมงที่หน้า ติดต่อเรา และ แบบฟอร์มติดต่อ ทีมงาน TKBNEKO ยินดีให้บริการทุกท่านด้วยใจ
ทดลองเล่นสล็อต pg เว็บ ตรง”
pg slot สล็อตยอดฮิต เข้าเล่นไว ฝากถอนออโต้
คำค้นหา สล็อต PG ถูกค้นหามากขึ้นเรื่อยๆ ในกลุ่มผู้เล่นเกมสล็อตออนไลน์ เพราะเป็น ผู้ให้บริการเกมสล็อตที่มาแรง ด้าน ภาพและเอฟเฟกต์ ความ ลื่นไหล และ ระบบจ่ายที่ดึงดูด เกมของ PG พัฒนาโดยผู้ให้บริการชั้นนำ ที่รองรับการเล่นทั้งบน สมาร์ทโฟน และ เดสก์ท็อป
ความโดดเด่น ของ สล็อต PG
pg slot เป็นเกมสล็อตออนไลน์ที่ออกแบบมาให้ เข้าเกมไว เล่นผ่าน ระบบเว็บ และรองรับ ทุกแพลตฟอร์ม เข้าเล่นผ่านเว็บได้เลย ผู้เล่นสามารถเข้าเล่นผ่าน หน้าเว็บ ได้ทันที ภาพและเสียงถูกพัฒนาในรูปแบบ เอฟเฟกต์ 3 มิติ ให้ความคมชัด พร้อมเอฟเฟกต์ จัดเต็ม
คุณสมบัติหลักของเกม pg slot ได้แก่
มีรอบโบนัสให้ลุ้นบ่อย
Multiplier
เดโม่ฟรี
มีเมนูภาษาไทย
ฝากถอนง่าย ทำรายการไว
แพลตฟอร์ม สล็อต PG โดยทั่วไปให้บริการ การฝาก-ถอน ออโต้ตลอด 24 ชม. ขั้นต่ำเริ่มต้นเพียง 10 บาท ขึ้นอยู่กับ ระบบของผู้ให้บริการ การทำรายการใช้เวลา ไม่กี่วินาที ผ่าน สแกน QR หรือระบบ แอปธนาคาร ทำให้ธุรกรรมเป็นไปอย่าง ต่อเนื่อง
แนวเกมที่คนเล่นเยอะ ใน PG Slot
เกม pg slot มีธีมหลากหลาย เช่น
ธีม เทพเจ้าและแฟนตาซี
ธีม ผจญภัย
ธีม เอเชียและโชคลาภ
ธีม Animal
ผู้เล่นนิยมเกมที่มีรอบพิเศษบ่อย พร้อมระบบ Special Feature และ อัตราการจ่ายที่สูง เหมาะกับทั้ง มือใหม่ และ ผู้เล่นที่มีประสบการณ์
มาตรฐานระบบ
pg slot พัฒนาในระบบสากล มีการ รักษาความปลอดภัย และใช้ระบบสุ่มผล RNG เพื่อให้ผลลัพธ์ ยุติธรรม แพลตฟอร์มที่ให้บริการ สล็อต PG ควรมี ระบบดูแลข้อมูล
โดยภาพรวม
pg slot เป็นตัวเลือกยอดนิยมสำหรับผู้ที่ต้องการเล่นสล็อตออนไลน์ ด้วยจุดเด่นด้าน โบนัสหลากหลาย และการทำธุรกรรมที่ ไว ผู้เล่นสามารถเริ่มต้นได้ ง่าย ฝากถอนสะดวก และเลือกเกมได้ จำนวนมาก เหมาะสำหรับ ผู้เล่นทุกสไตล์ ในโลกของเกมสล็อตออนไลน์
สล็อต
TKBNEKO มอบมิติใหม่ของเกมออนไลน์ ฝาก-ถอนไว ด้วยระบบสแกน คิวอาร์โค้ด
ในยุคดิจิทัลที่ เทคโนโลยีพัฒนาอย่างรวดเร็ว เรามุ่งเน้นมาตรฐานใหม่ของการเดิมพัน ด้วยระบบที่ ทันสมัย รวดเร็ว และ โปร่งใส เพื่อให้ผู้เล่น อุ่นใจ ทุกครั้งที่ใช้งาน
จุดเด่นระบบฝาก-ถอน
ฝากขั้นต่ำ: 1 บาท
ถอนขั้นต่ำ: 1 บาท
เวลาฝากเงิน: ภายใน 3 วินาที
ยอดถอน: ไม่จำกัดต่อวัน
ฝากง่าย เพียงสแกน QR Code
สแกน คิวอาร์ ระบบจะ ประมวลผลอัตโนมัติ ขั้นต่ำ เริ่ม 100 บาท สูงสุด ไม่เกิน 500,000 บาทต่อครั้ง
เกมยอดนิยม
สล็อต: ลุ้นแจ็คพอต
เกมสด: ดีลเลอร์สด
กีฬา: เดิมพันลีกดัง
ยิงปลา: ลุ้นกำไรทันที
โปรโมชั่นและสิทธิพิเศษ
ติดตามหน้า โบนัส พร้อมระบบ VIP และโปรแกรม แอฟฟิลิเอต
ติดต่อเรา
สอบถามข้อมูลได้ตลอด 24 ชั่วโมง ผ่านหน้า ศูนย์ช่วยเหลือ ทีมงาน ของเรา พร้อมดูแลตลอดเวลา
ทดลองเล่นสล็อต pg ซื้อฟรีสปิน
สล็อต PG สล็อตยอดฮิต เล่นง่าย ฝากถอนเร็ว
คำค้นหา pg slot ถูกค้นหามากขึ้นเรื่อยๆ ในกลุ่มผู้เล่นเกมสล็อตออนไลน์ เพราะเป็น ผู้ให้บริการเกมสล็อตที่มาแรง ด้าน กราฟิก ความ นิ่งไม่สะดุด และ อัตราการจ่ายรางวัลที่น่าสนใจ เกมของ PG ออกแบบโดยทีมงานมืออาชีพ ที่รองรับการเล่นทั้งบน โทรศัพท์มือถือ และ คอมพิวเตอร์
ข้อดี ของ PG Slot
สล็อต PG เป็นเกมสล็อตออนไลน์ที่ออกแบบมาให้ โหลดเร็ว เล่นผ่าน ระบบเว็บ และรองรับ ทุกอุปกรณ์ เข้าเล่นผ่านเว็บได้เลย ผู้เล่นสามารถเข้าเล่นผ่าน Browser ได้ทันที ภาพและเสียงถูกพัฒนาในรูปแบบ 3D ให้ความคมชัด พร้อมเอฟเฟกต์ จัดเต็ม
คุณสมบัติหลักของเกม pg slot ได้แก่
โบนัสและฟรีสปินหลายแบบ
ระบบตัวคูณ
เดโม่ฟรี
รองรับภาษาไทยเต็มรูปแบบ
ระบบการเงินรวดเร็ว ไม่ต้องรอนาน
แพลตฟอร์ม สล็อต PG โดยทั่วไปให้บริการ การฝาก-ถอน อัตโนมัติ 24 ชั่วโมง ขั้นต่ำเริ่มต้นเพียง หลักหน่วย ขึ้นอยู่กับ เงื่อนไขของเว็บไซต์ การทำรายการใช้เวลา เพียงไม่กี่วินาที ผ่าน สแกน QR หรือระบบ ธนาคารบนมือถือ ทำให้ธุรกรรมเป็นไปอย่าง ไม่สะดุด
แนวเกมที่คนเล่นเยอะ ใน PG Slot
เกม PG Slot มีธีมหลากหลาย เช่น
ธีม แฟนตาซี
ธีม ลุยด่าน
ธีม โชคลาภ
ธีม สัตว์และธรรมชาติ
เกมยอดนิยมมักเป็นเกมที่แตกง่าย พร้อมระบบ ฟีเจอร์พิเศษ และ โอกาสทำกำไรสูง เหมาะกับทั้ง มือใหม่ และ สายสล็อตจริงจัง
ความน่าเชื่อถือ
สล็อต PG พัฒนาในระบบสากล มีการ ปกป้องข้อมูลผู้เล่น และใช้ระบบสุ่มผล ระบบสุ่มมาตรฐาน เพื่อให้ผลลัพธ์ ยุติธรรม แพลตฟอร์มที่ให้บริการ pg slot ควรมี ความปลอดภัยสูง
โดยภาพรวม
สล็อต PG เป็นตัวเลือกยอดนิยมสำหรับผู้ที่ต้องการเล่นสล็อตออนไลน์ ด้วยจุดเด่นด้าน กราฟิกคุณภาพ และการทำธุรกรรมที่ ไว ผู้เล่นสามารถเริ่มต้นได้ ทันที ฝากถอนสะดวก และเลือกเกมได้ หลากหลายแนว เหมาะสำหรับ ทั้งมือใหม่และมือโปร ในโลกของเกมสล็อตออนไลน์
https://medium.com/@ratypw/ทดลองเล่นสล็อต-pg-70cdb1132344
ทดลองเล่นสล็อต pg ฟรี pg slot แพลตฟอร์มเกมสล็อตยอดนิยม เข้าเล่นไว ฝากถอนออโต้
คำค้นหา pg slot ถูกค้นหามากขึ้นเรื่อยๆ ในกลุ่มผู้เล่นเกมสล็อตออนไลน์ เพราะเป็น แบรนด์เกมที่โดดเด่น ด้าน งานภาพคุณภาพสูง ความ เสถียร และ ระบบจ่ายที่ดึงดูด เกมของ PG พัฒนาโดยผู้ให้บริการชั้นนำ ที่รองรับการเล่นทั้งบน สมาร์ทโฟน และ พีซี
ข้อดี ของ pg slot
PG Slot เป็นเกมสล็อตออนไลน์ที่ออกแบบมาให้ เข้าเกมไว เล่นผ่าน ระบบอัตโนมัติ และรองรับ ทั้ง iOS และ Android เข้าเล่นผ่านเว็บได้เลย ผู้เล่นสามารถเข้าเล่นผ่าน หน้าเว็บ ได้ทันที ภาพและเสียงถูกพัฒนาในรูปแบบ สามมิติ ให้ความคมชัด พร้อมเอฟเฟกต์ จัดเต็ม
คุณสมบัติหลักของเกม pg slot ได้แก่
มีรอบโบนัสให้ลุ้นบ่อย
ฟีเจอร์ตัวคูณรางวัล
โหมดทดลองเล่นฟรี
มีเมนูภาษาไทย
ระบบการเงินรวดเร็ว ไม่ต้องรอนาน
แพลตฟอร์ม PG Slot โดยทั่วไปให้บริการ การฝาก-ถอน ฝากถอนตลอดเวลา ขั้นต่ำเริ่มต้นเพียง หลักหน่วย ขึ้นอยู่กับ ระบบของผู้ให้บริการ การทำรายการใช้เวลา เพียงไม่กี่วินาที ผ่าน QR Code หรือระบบ ธนาคารบนมือถือ ทำให้ธุรกรรมเป็นไปอย่าง ลื่นไหล
ประเภทเกมยอดนิยม ใน PG Slot
เกม สล็อต PG มีธีมหลากหลาย เช่น
ธีม เทพเจ้า
ธีม ลุยด่าน
ธีม ความมั่งคั่ง
ธีม Animal
ผู้เล่นนิยมเกมที่มีรอบพิเศษบ่อย พร้อมระบบ โบนัสรอบพิเศษ และ โอกาสทำกำไรสูง เหมาะกับทั้ง คนเพิ่งเล่น และ ผู้เล่นที่มีประสบการณ์
ความปลอดภัย
สล็อต PG ใช้ระบบที่ได้มาตรฐาน มีการ เข้ารหัสข้อมูล และใช้ระบบสุ่มผล Random Number Generator เพื่อให้ผลลัพธ์ ยุติธรรม แพลตฟอร์มที่ให้บริการ pg slot ควรมี ทีมซัพพอร์ต 24 ชม.
โดยภาพรวม
สล็อต PG เป็นตัวเลือกยอดนิยมสำหรับผู้ที่ต้องการเล่นสล็อตออนไลน์ ด้วยจุดเด่นด้าน ระบบลื่นไหล และการทำธุรกรรมที่ ไว ผู้เล่นสามารถเริ่มต้นได้ ไม่ซับซ้อน ฝากถอนสะดวก และเลือกเกมได้ หลากหลายแนว เหมาะสำหรับ ผู้เล่นทุกสไตล์ ในโลกของเกมสล็อตออนไลน์
ทดลองเล่นสล็อต pg เว็บ ตรง”
pg slot แพลตฟอร์มเกมสล็อตยอดนิยม เข้าเล่นไว ฝากถอนออโต้
คำค้นหา pg slot กำลังได้รับความนิยมอย่างต่อเนื่อง ในกลุ่มผู้เล่นเกมสล็อตออนไลน์ เพราะเป็น ค่ายเกมที่มีชื่อเสียง ด้าน กราฟิก ความ เสถียร และ โอกาสรับกำไรที่ดี เกมของ PG ผลิตโดยค่ายมาตรฐาน ที่รองรับการเล่นทั้งบน มือถือ และ เดสก์ท็อป
ข้อดี ของ pg slot
pg slot เป็นเกมสล็อตออนไลน์ที่ออกแบบมาให้ โหลดเร็ว เล่นผ่าน ระบบเว็บ และรองรับ ทุกอุปกรณ์ ไม่ต้องดาวน์โหลดแอป ผู้เล่นสามารถเข้าเล่นผ่าน Browser ได้ทันที ภาพและเสียงถูกพัฒนาในรูปแบบ สามมิติ ให้ความคมชัด พร้อมเอฟเฟกต์ จัดเต็ม
คุณสมบัติหลักของเกม PG Slot ได้แก่
ระบบโบนัสและฟรีสปินหลากหลายรูปแบบ
ระบบตัวคูณ
เล่นฟรีก่อนเติมเงิน
รองรับภาษาไทยเต็มรูปแบบ
ระบบการเงินรวดเร็ว ไม่ต้องรอนาน
แพลตฟอร์ม PG Slot ส่วนใหญ่รองรับ การฝาก-ถอน ฝากถอนตลอดเวลา ขั้นต่ำเริ่มต้นเพียง หลักหน่วย ขึ้นอยู่กับ เงื่อนไขของเว็บไซต์ การทำรายการใช้เวลา รวดเร็วมาก ผ่าน QR Code หรือระบบ ธนาคารบนมือถือ ทำให้ธุรกรรมเป็นไปอย่าง ลื่นไหล
หมวดเกมฮิต ใน pg slot
เกม สล็อต PG มีธีมหลากหลาย เช่น
ธีม แฟนตาซี
ธีม ผจญภัย
ธีม เอเชียและโชคลาภ
ธีม Animal
เกมยอดนิยมมักเป็นเกมที่แตกง่าย พร้อมระบบ ฟีเจอร์พิเศษ และ อัตราการจ่ายที่สูง เหมาะกับทั้ง ผู้เล่นเริ่มต้น และ ผู้เล่นมือโปร
ความปลอดภัย
pg slot มีมาตรฐานรองรับ มีการ รักษาความปลอดภัย และใช้ระบบสุ่มผล Random Number Generator เพื่อให้ผลลัพธ์ โปร่งใส แพลตฟอร์มที่ให้บริการ pg slot ควรมี ทีมซัพพอร์ต 24 ชม.
โดยภาพรวม
PG Slot เป็นตัวเลือกยอดนิยมสำหรับผู้ที่ต้องการเล่นสล็อตออนไลน์ ด้วยจุดเด่นด้าน โบนัสหลากหลาย และการทำธุรกรรมที่ ไว ผู้เล่นสามารถเริ่มต้นได้ ทันที ฝากถอนสะดวก และเลือกเกมได้ จำนวนมาก เหมาะสำหรับ ผู้เล่นทุกสไตล์ ในโลกของเกมสล็อตออนไลน์
เว็บไซต์ TKBNEKO มอบมิติใหม่ของการเดิมพันออนไลน์ ระบบการเงินรวดเร็ว ด้วยระบบสแกน คิวอาร์โค้ด
ในยุคที่ โลกออนไลน์พัฒนาอย่างรวดเร็ว TKBNEKO ขอเป็นส่วนหนึ่งในการปฏิวัติวงการเกม ด้วยระบบการให้บริการที่ ล้ำสมัย ฉับไว และ ตรวจสอบได้ พร้อมต้อนรับสมาชิกทุกท่านสู่ มิติใหม่แห่งความสนุก ที่ ใครๆ ก็เป็นเถ้าแก่ได้
ทำไมต้อง TKBNEKO?
เราคัดสรรเกมคุณภาพจากผู้พัฒนาชั้นนำ โดยเฉพาะเกมที่ ได้รับการตรวจสอบจากองค์กรสากล และ ได้มาตรฐานสากล เพื่อให้ผู้เล่นทุกคน มั่นใจ ได้ว่า จะได้รับความเพลิดเพลินกับเกมที่ ไม่มีการเอาเปรียบ ข้อมูลไม่รั่วไหล และ ตอบโจทย์ผู้เล่นยุคใหม่
ข้อดีของธุรกรรมบนแพลตฟอร์ม
เราออกแบบระบบการเงินให้ง่ายและเร็วที่สุด เพื่อให้คุณ เพลิดเพลินกับการเดิมพันอย่างต่อเนื่อง
ฝากขั้นต่ำ: เพียง 1 บาท
ถอนขั้นต่ำ: เพียง 1 บาท
เวลาฝากเงิน: เงินเข้าภายใน 3 วินาที
ยอดจำกัดการถอน: ถอนได้ไม่จำกัดยอด
เติมเงินง่ายด้วย QR Code
เพียงคุณสแกน QR Code ระบบของเราจะ ดำเนินการฝากเงินให้อัตโนมัติ ขั้นต่ำเพียง 100 บาท และสามารถฝากได้สูงถึง 500,000 บาท เริ่มต้นได้ทันที กับ TKBNEKO ที่ ตอบโจทย์การเดิมพันยุคใหม่
คลังเกมคุณภาพ
TKBNEKO รวมเกมสุดฮิตไว้ในที่เดียว รองรับทุกความชอบของผู้เล่น
สล็อต: แจ็คพอตแตกง่าย ลุ้นได้ทุกวัน
เกมสด: สัมผัสประสบการณ์คาสิโนแบบเรียลไทม์
กีฬา: รองรับลีกดังระดับโลก
ยิงปลา: สนุกกับการยิงปลาแบบได้เงิน
ติดตามโปรโมชั่นและสิทธิพิเศษ
อย่าลืมแวะมาเยี่ยมชมที่หน้า โบนัส เพื่อรับ สิทธิพิเศษมากมาย ที่เรามอบให้สมาชิกทุกท่าน นอกจากนี้ยังมีระบบ VIP สำหรับลูกค้าคนสำคัญ และช่องทาง พาร์ทเนอร์ สำหรับผู้ที่สนใจสร้างรายได้ร่วมกับเรา
ฝ่ายบริการลูกค้า
หากมี ข้อสงสัย หรือ ความคิดเห็น สามารถติดต่อทีมงานของเราได้ตลอด 24 ชั่วโมงที่หน้า ติดต่อเรา และ ส่งความคิดเห็น ทีมงาน TKBNEKO ยินดีให้บริการทุกท่านด้วยใจ
ทดลองเล่นสล็อต pg ไม่ เด้ง
สล็อต
แพลตฟอร์ม TKBNEKO มอบมิติใหม่ของเกมออนไลน์ ธุรกรรมรวดเร็ว ด้วยระบบสแกน คิวอาร์โค้ด
ในยุคดิจิทัลที่ โลกออนไลน์เติบโตต่อเนื่อง เรามุ่งเน้นมาตรฐานใหม่ของการเดิมพัน ด้วยระบบที่ ล้ำสมัย รวดเร็ว และ โปร่งใส เพื่อให้ผู้เล่น อุ่นใจ ทุกครั้งที่ใช้งาน
จุดเด่นระบบฝาก-ถอน
ฝากขั้นต่ำ: 1 บาท
ถอนขั้นต่ำ: ขั้นต่ำ 1 บาท
เวลาฝากเงิน: ใช้เวลาเพียง 3 วินาที
ยอดถอน: ไม่มีลิมิต
เติมเงินง่าย แค่สแกน
สแกน คิวอาร์ ระบบจะ ประมวลผลอัตโนมัติ ขั้นต่ำ 100 บาท สูงสุด ไม่เกิน 500,000 บาทต่อครั้ง
เกมยอดนิยม
สล็อต: ธีมหลากหลาย
เกมสด: ดีลเลอร์สด
กีฬา: เดิมพันลีกดัง
ยิงปลา: สนุกได้เงินจริง
โบนัสและโปรโมชัน
ติดตามหน้า โบนัส พร้อมระบบ VIP และโปรแกรม แอฟฟิลิเอต
ติดต่อเรา
สอบถามข้อมูลได้ตลอด 24 ชั่วโมง ผ่านหน้า ศูนย์ช่วยเหลือ ทีมงาน ของเรา พร้อมดูแลตลอดเวลา
สล็อต PG สล็อตยอดฮิต เล่นง่าย ฝากถอนเร็ว
คำค้นหา pg slot กำลังได้รับความนิยมอย่างต่อเนื่อง ในกลุ่มผู้เล่นเกมสล็อตออนไลน์ เพราะเป็น ค่ายเกมที่มีชื่อเสียง ด้าน งานภาพคุณภาพสูง ความ ลื่นไหล และ อัตราการจ่ายรางวัลที่น่าสนใจ เกมของ PG พัฒนาโดยผู้ให้บริการชั้นนำ ที่รองรับการเล่นทั้งบน มือถือ และ คอมพิวเตอร์
ข้อดี ของ pg slot
PG Slot เป็นเกมสล็อตออนไลน์ที่ออกแบบมาให้ เปิดเกมได้ทันที เล่นผ่าน ระบบอัตโนมัติ และรองรับ ทุกอุปกรณ์ ไม่ต้องดาวน์โหลดแอป ผู้เล่นสามารถเข้าเล่นผ่าน หน้าเว็บ ได้ทันที ภาพและเสียงถูกพัฒนาในรูปแบบ สามมิติ ให้ความคมชัด พร้อมเอฟเฟกต์ สวยงาม
คุณสมบัติหลักของเกม pg slot ได้แก่
มีรอบโบนัสให้ลุ้นบ่อย
Multiplier
เล่นฟรีก่อนเติมเงิน
รองรับภาษาไทยเต็มรูปแบบ
ระบบการเงินรวดเร็ว ไม่ต้องรอนาน
แพลตฟอร์ม สล็อต PG ส่วนใหญ่รองรับ การฝาก-ถอน อัตโนมัติ 24 ชั่วโมง ขั้นต่ำเริ่มต้นเพียง หลักหน่วย ขึ้นอยู่กับ กติกาแต่ละแพลตฟอร์ม การทำรายการใช้เวลา ไม่กี่วินาที ผ่าน สแกน QR หรือระบบ Mobile Banking ทำให้ธุรกรรมเป็นไปอย่าง ลื่นไหล
แนวเกมที่คนเล่นเยอะ ใน pg slot
เกม สล็อต PG มีธีมหลากหลาย เช่น
ธีม เทพเจ้าและแฟนตาซี
ธีม ผจญภัย
ธีม เอเชียและโชคลาภ
ธีม Animal
เกมยอดนิยมมักเป็นเกมที่แตกง่าย พร้อมระบบ โบนัสรอบพิเศษ และ อัตราการจ่ายที่สูง เหมาะกับทั้ง คนเพิ่งเล่น และ ผู้เล่นที่มีประสบการณ์
ความปลอดภัย
pg slot มีมาตรฐานรองรับ มีการ รักษาความปลอดภัย และใช้ระบบสุ่มผล Random Number Generator เพื่อให้ผลลัพธ์ ยุติธรรม แพลตฟอร์มที่ให้บริการ สล็อต PG ควรมี ระบบดูแลข้อมูล
โดยภาพรวม
pg slot เป็นตัวเลือกยอดนิยมสำหรับผู้ที่ต้องการเล่นสล็อตออนไลน์ ด้วยจุดเด่นด้าน กราฟิกคุณภาพ และการทำธุรกรรมที่ ไว ผู้เล่นสามารถเริ่มต้นได้ ง่าย ฝากถอนสะดวก และเลือกเกมได้ จำนวนมาก เหมาะสำหรับ ผู้เล่นทุกสไตล์ ในโลกของเกมสล็อตออนไลน์
Автозайм
Деньги с обеспечением ПТС в Самаре — это способ получить деньги под автомобиль без необходимости продавать машины и без долгих проверок банка. Главная особенность такого займа — транспорт остаётся у владельца у владельца, а в качестве залога передаётся только ПТС. Это даёт возможность использовать транспортом, на протяжении договор займа.
Выдача денег происходит в день обращения. Заявка рассматривается около 15 минут, затем принимается решение по сумме и условиям оформления. Сумма займа может составлять до 5 000 000 ?, а процентная ставка стартует от 2% в месяц. Период займа как правило достигает до 60 месяцев, по этой причине клиент может подобрать подходящий план платежей.
Система подачи заявки доступна через интернет. Заёмщик оставляет онлайн-форму, указывает информацию об авто и желаемую сумму займа. После анализа документов приходит начальное решение. Чаще всего средства переводятся в тот же день, когда оформляется договор.
Для расчёта параметров применяется онлайн-калькулятор. Например, если взять 300 000 ? на период 12 мес. ежемесячный платёж составит около 33 057 ?. Общая сумма переплаты за весь срок будет около 96 684 ?. Итоговые условия могут изменяться в зависимости стоимости автомобиля и выбранного срока кредитования.
На страницах сервиса автокредитования часто отображается онлайн-лента заявок. Она демонстрирует активность системы и примеры одобренных заявок из разных городов. Например, запросы на сумму 1 840 000 ? город Тула, 1 890 000 ? из Москвы или 1 470 000 ? из Челябинска получают метку «Одобрено». Часть обращений могут находиться на этапе проверки — например такие суммы, 290 000 ? из Сочи или 720 000 ? город Екатеринбург. Такие блоки отображают текущую активность платформы и число обработанных заявок сегодня и в текущем месяце.
Автозайм с залогом ПТС подходит тем, кому требуется быстро получить крупную сумму без продажи автомобиля. Базовые условия таких займов — ставка начиная от 2% в месяц, одобрение около 15 минут, размер займа до 5 000 000 ? и возможность оформить заявку через интернет. После подачи заявки заёмщик ожидает решение, написать в мессенджер или обратиться к менеджеру для уточнения деталей оформления.
ทดลองเล่นสล็อต pg ฟรี PG Slot แพลตฟอร์มเกมสล็อตยอดนิยม เล่นง่าย ฝากถอนเร็ว
คำค้นหา pg slot กำลังได้รับความนิยมอย่างต่อเนื่อง ในกลุ่มผู้เล่นเกมสล็อตออนไลน์ เพราะเป็น แบรนด์เกมที่โดดเด่น ด้าน กราฟิก ความ ลื่นไหล และ โอกาสรับกำไรที่ดี เกมของ PG ผลิตโดยค่ายมาตรฐาน ที่รองรับการเล่นทั้งบน โทรศัพท์มือถือ และ เดสก์ท็อป
ข้อดี ของ สล็อต PG
PG Slot เป็นเกมสล็อตออนไลน์ที่ออกแบบมาให้ เปิดเกมได้ทันที เล่นผ่าน ระบบอัตโนมัติ และรองรับ ทุกอุปกรณ์ เข้าเล่นผ่านเว็บได้เลย ผู้เล่นสามารถเข้าเล่นผ่าน Browser ได้ทันที ภาพและเสียงถูกพัฒนาในรูปแบบ สามมิติ ให้ความคมชัด พร้อมเอฟเฟกต์ สมจริง
คุณสมบัติหลักของเกม PG Slot ได้แก่
มีรอบโบนัสให้ลุ้นบ่อย
ระบบตัวคูณ
เล่นฟรีก่อนเติมเงิน
มีเมนูภาษาไทย
ระบบการเงินรวดเร็ว ทำรายการไว
แพลตฟอร์ม pg slot มักมี การฝาก-ถอน ฝากถอนตลอดเวลา ขั้นต่ำเริ่มต้นเพียง 10 บาท ขึ้นอยู่กับ เงื่อนไขของเว็บไซต์ การทำรายการใช้เวลา รวดเร็วมาก ผ่าน สแกน QR หรือระบบ แอปธนาคาร ทำให้ธุรกรรมเป็นไปอย่าง ไม่สะดุด
หมวดเกมฮิต ใน pg slot
เกม PG Slot มีธีมหลากหลาย เช่น
ธีม เทพเจ้า
ธีม Adventure
ธีม ความมั่งคั่ง
ธีม Animal
ผู้เล่นนิยมเกมที่มีรอบพิเศษบ่อย พร้อมระบบ โบนัสรอบพิเศษ และ ระบบจ่ายคุ้มค่า เหมาะกับทั้ง คนเพิ่งเล่น และ สายสล็อตจริงจัง
ความน่าเชื่อถือ
pg slot มีมาตรฐานรองรับ มีการ เข้ารหัสข้อมูล และใช้ระบบสุ่มผล Random Number Generator เพื่อให้ผลลัพธ์ ยุติธรรม แพลตฟอร์มที่ให้บริการ pg slot ควรมี ความปลอดภัยสูง
สรุป
PG Slot เป็นตัวเลือกยอดนิยมสำหรับผู้ที่ต้องการเล่นสล็อตออนไลน์ ด้วยจุดเด่นด้าน กราฟิกคุณภาพ และการทำธุรกรรมที่ ทันใจ ผู้เล่นสามารถเริ่มต้นได้ ไม่ซับซ้อน ฝากถอนสะดวก และเลือกเกมได้ หลากหลายแนว เหมาะสำหรับ ทั้งมือใหม่และมือโปร ในโลกของเกมสล็อตออนไลน์
ทดลองเล่นสล็อต pg ไม่ เด้ง
rufus windows 11 Rufus remains a small, no-cost, open source utility created to create bootable USB drives. It allows you to prepare a USB flash drive that can install an operating system, launch diagnostic tools, or boot into a recovery environment. The program does not require installation and can be launched as soon as it is downloaded.
The primary purpose of Rufus is to create bootable USB media from ISO images fast and reliably. This lets people install or run operating systems directly from a USB flash drive without the need for DVDs. The tool works with a large number of operating systems and service utilities, which makes it practical for both regular users and system administrators.
Rufus works on computers with Microsoft Windows, starting from Windows 7. Both 32-bit and 64-bit versions are supported, and there is also a version available for ARM64 architecture.
The software lets users create bootable USB drives from many different ISO images. It can be used to prepare a USB drive for installing Windows 11, Windows 10, Windows 8.1, or Windows 7, as well as various Linux distributions. Rufus also works with DOS systems and other recovery or maintenance tools commonly used for troubleshooting computers.
One of the built-in features of Rufus is the ability to download official Windows ISO images directly from Microsoft servers. This allows users to obtain original installation images for Windows 8.1, Windows 10, and Windows 11 without searching for them on third-party websites.
In addition to creating bootable drives, Rufus can format USB devices. It supports several file systems including FAT32, NTFS, exFAT, UDF, and ReFS. This flexibility allows the USB drive to be prepared for different use cases and compatibility requirements.
Rufus supports both legacy BIOS systems and modern UEFI environments. Because of this, bootable drives created with Rufus can work on older computers as well as newer systems that use UEFI and Secure Boot.
Another feature included in Rufus is Windows To Go support. This option allows users to run a full Windows environment directly from a USB drive. It can be useful for testing systems, performing maintenance, or working on multiple computers without installing Windows on the internal drive.
Rufus also provides the option to bypass certain Windows 11 installation requirements. When creating an installation USB, the program can disable checks for TPM 2.0, Secure Boot, and minimum RAM requirements. This makes it possible to install Windows 11 on computers that would otherwise not meet the official hardware requirements.
One of the reasons Rufus has become popular is its speed and simplicity. The program is extremely small, about 1.9 MB in size, and runs as a portable application without installation. It is distributed under the GPL v3 open-source license, supports more than 70 languages, and contains no advertisements, bundled software, or tracking components.
Rufus works with a large number of ISO images. These include multiple versions of Windows, Windows Server editions, FreeDOS, and various system tools such as GParted, Hiren’s Boot CD, Parted Magic, and Clonezilla. Because of this wide compatibility, the program can be used not only for installing operating systems but also for disk management, data recovery, and system maintenance tasks.
To use Rufus, a computer running Windows 7 or later and a USB flash drive are required. The program does not need to be installed. Users simply download the executable file, run it, select the ISO image they want to use, and create a bootable USB drive. Due to its simplicity, speed, and reliability, Rufus remains one of the most widely used tools for creating bootable USB drives.
สล็อต PG สล็อตยอดฮิต เล่นง่าย ฝากถอนเร็ว
คำค้นหา pg slot มาแรงในช่วงนี้ ในกลุ่มผู้เล่นเกมสล็อตออนไลน์ เพราะเป็น ผู้ให้บริการเกมสล็อตที่มาแรง ด้าน กราฟิก ความ ลื่นไหล และ ระบบจ่ายที่ดึงดูด เกมของ PG พัฒนาโดยผู้ให้บริการชั้นนำ ที่รองรับการเล่นทั้งบน มือถือ และ พีซี
ความโดดเด่น ของ pg slot
สล็อต PG เป็นเกมสล็อตออนไลน์ที่ออกแบบมาให้ เปิดเกมได้ทันที เล่นผ่าน ระบบออนไลน์ และรองรับ ทุกอุปกรณ์ ไม่ต้องดาวน์โหลดแอป ผู้เล่นสามารถเข้าเล่นผ่าน หน้าเว็บ ได้ทันที ภาพและเสียงถูกพัฒนาในรูปแบบ สามมิติ ให้ความคมชัด พร้อมเอฟเฟกต์ สวยงาม
คุณสมบัติหลักของเกม สล็อต PG ได้แก่
ระบบโบนัสและฟรีสปินหลากหลายรูปแบบ
Multiplier
เดโม่ฟรี
รองรับภาษาไทยเต็มรูปแบบ
ระบบฝากถอนสะดวก ไม่ต้องรอนาน
แพลตฟอร์ม PG Slot มักมี การฝาก-ถอน อัตโนมัติ 24 ชั่วโมง ขั้นต่ำเริ่มต้นเพียง 1 บาท ขึ้นอยู่กับ กติกาแต่ละแพลตฟอร์ม การทำรายการใช้เวลา เพียงไม่กี่วินาที ผ่าน คิวอาร์โค้ด หรือระบบ ธนาคารบนมือถือ ทำให้ธุรกรรมเป็นไปอย่าง ไม่สะดุด
ประเภทเกมยอดนิยม ใน pg slot
เกม pg slot มีธีมหลากหลาย เช่น
ธีม แฟนตาซี
ธีม ผจญภัย
ธีม เอเชียและโชคลาภ
ธีม Animal
หลายคนชอบเกมที่โบนัสเข้าไว พร้อมระบบ Special Feature และ อัตราการจ่ายที่สูง เหมาะกับทั้ง คนเพิ่งเล่น และ สายสล็อตจริงจัง
มาตรฐานระบบ
pg slot มีมาตรฐานรองรับ มีการ ปกป้องข้อมูลผู้เล่น และใช้ระบบสุ่มผล ระบบสุ่มมาตรฐาน เพื่อให้ผลลัพธ์ ตรวจสอบได้ แพลตฟอร์มที่ให้บริการ pg slot ควรมี ทีมซัพพอร์ต 24 ชม.
สรุป
สล็อต PG เป็นตัวเลือกยอดนิยมสำหรับผู้ที่ต้องการเล่นสล็อตออนไลน์ ด้วยจุดเด่นด้าน ระบบลื่นไหล และการทำธุรกรรมที่ ทันใจ ผู้เล่นสามารถเริ่มต้นได้ ง่าย ฝากถอนสะดวก และเลือกเกมได้ ครบทุกหมวด เหมาะสำหรับ ทั้งมือใหม่และมือโปร ในโลกของเกมสล็อตออนไลน์
ทดลองเล่นสล็อต pg ไม่ เด้ง
ทดลองเล่นสล็อต pg ไม่ เด้ง
ทดลองเล่นสล็อต pg ไม่ เด้ง
промо мелбет
Скачать приложение Melbet: APK, iOS и компьютер
Приложение Melbet объединяет букмекерскую контору и казино в едином приложении. Доступны live-ставки, казино-игры, онлайн-трансляции, статистика и операции по счёту. Загрузка занимает несколько минут.
Android (APK)
Скачайте APK с официального источника, запустите установщик и завершите установку. При необходимости включите доступ к установке сторонних приложений, затем войдите в аккаунт.
iOS (iPhone)
Перейдите в App Store, введите в поиске «Melbet», выберите «Получить», после установки выполните вход.
ПК
Откройте официальный сайт, авторизуйтесь и добавьте ярлык на рабочий стол. Браузерная версия функционирует как отдельное приложение.
Функционал
Live-ставки с мгновенным обновлением линии, казино и слоты, просмотр матчей, подробная статистика, уведомления о матчах, быстрая регистрация и поддержка 24/7.
Бонусы
После установки доступны бонус на первый депозит, акционные коды и бесплатные ставки. Условия зависят от региона.
Безопасность
Загружайте только с официального сайта, контролируйте адрес сайта, не передавайте пароль третьим лицам и включите 2FA.
Загрузка выполняется быстро, после чего открывается полный доступ Melbet.
melbet – melbetbonuscode.ru
Установить Melbet: Android, iPhone и компьютер
Приложение Melbet включает ставки и казино в одном интерфейсе. Доступны live-ставки, казино-игры, онлайн-трансляции, статистика и операции по счёту. Загрузка занимает 1–2 минуты.
Android (APK)
Скачайте APK с официального источника, запустите установщик и подтвердите установку. Если требуется включите доступ к установке сторонних приложений, затем войдите в аккаунт.
iOS (iPhone)
Перейдите в App Store, найдите «Melbet», выберите «Получить», после установки выполните вход.
ПК
Перейдите официальный сайт, авторизуйтесь и добавьте ярлык на рабочий стол. Веб-версия работает как отдельное приложение.
Функционал
Live-ставки с мгновенным обновлением линии, игровой раздел с тысячами игр, просмотр матчей, аналитические данные, уведомления о матчах, регистрация за минуту и поддержка 24/7.
Бонусы
После загрузки доступны приветственный бонус, промокоды и бесплатные ставки. Правила начисления определяются регионом.
Безопасность
Скачивайте только с официального сайта, контролируйте адрес сайта, не сообщайте данные доступа третьим лицам и включите 2FA.
Загрузка выполняется быстро, после чего открывается полный доступ Melbet.
bidik88
melbet мобильное приложение скачать ios
Скачать приложение Melbet: APK, iOS и компьютер
Мобильная версия Melbet объединяет ставки и казино в одном интерфейсе. Пользователю доступны live-ставки, казино-игры, прямые трансляции, статистика и операции по счёту. Установка занимает несколько минут.
Android (APK)
Загрузите APK с официального источника, запустите установщик и завершите установку. Если требуется включите доступ к установке сторонних приложений, затем авторизуйтесь.
iOS (iPhone)
Откройте App Store, найдите «Melbet», выберите «Получить», после установки выполните вход.
ПК
Перейдите официальный сайт, войдите в личный кабинет и добавьте ярлык на рабочий стол. Веб-версия работает как отдельное приложение.
Функционал
Live-ставки с мгновенным обновлением линии, игровой раздел с тысячами игр, прямые трансляции, подробная статистика, push-оповещения, быстрая регистрация и поддержка 24/7.
Бонусы
После загрузки доступны бонус на первый депозит, промокоды и фрибеты. Правила начисления определяются регионом.
Безопасность
Загружайте только с официальных источников, проверяйте домен, не передавайте пароль третьим лицам и включите 2FA.
Установка занимает несколько минут, после чего открывается полный доступ Melbet.
heaps o wins
* super fast loading times
* clean interface easy to navigate
* works perfect on phone
* no annoying popups everywhere
http://mtthub.org/groups/waterless-diffuser/
бк леон официальный сайт
joycasino зеркало на сегодня
Quick pros:
* Mobile works great
* No annoying pop-ups
* Account setup takes 2 minutes
* Customer support responds quickly
* Smooth checkout process
777bet
топ лучших казино
whos used ipl live cricket thinking about trying it thanks in advance
sapporo88
From a technical standpoint, three card rummy is pretty solid—the interface loads fast, its responsive on mobile, and the UI is clean without all the clutter you see on other card sites. The backend performence seems stable even during peak hours, and navigation between game modes is intuitive.
sapporo88 login
… [Trackback]
[…] Read More here on that Topic: coinchapter.com/cryptocurrencies-prices-mana-sand-slp-fida-reef-nu-chz-ont-dnt-token/ […]