
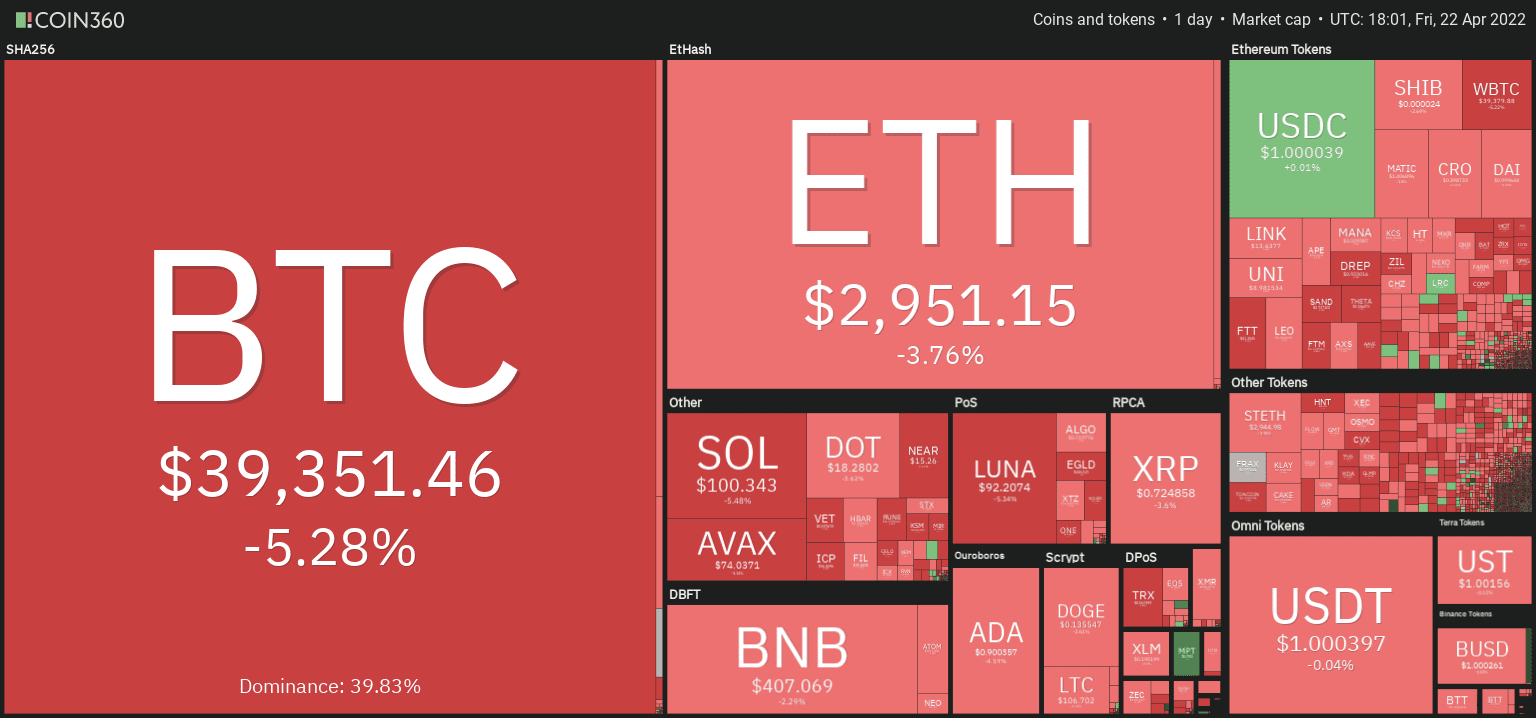
NEW DELHI (CoinChapter.com) — The cryptocurrency market turned red barely a day after Bitcoin prices touched $42,000 after 10 days on Apr 21.
As Bitcoin entered the weekend, BTC prices dropped by 5.2% to move below $40,000. $39,000 remains a key support level for the world’s largest crypto. The sell-off was evidence of BTC’s tight correlation with the U.S. equity markets.
Furthermore, crypto trading volumes have also been declining for some time, as per data from Dune Analytics. The monthly exchange volume in Mar was the lowest since Apr 2021.
AMP/USD
Flexa Network’s AMP token prices have been moving in a descending parallel channel since Jan 22. AMP’s prices rebounded off the channels support line on Apr 18 before gaining 8.6% on Apr 21. The AMP token’s 50-day moving average (yellow wave) rebuffed its uptrend.
As a result, AMP prices fell to immediate support near $0.022. Moreover, a marketwide sell-off could see AMP price re-test support from the descending channel’s lower trendline near $0.021. AMP needs to hold above the parallel channel’s lower trendline to avoid further downtrend.
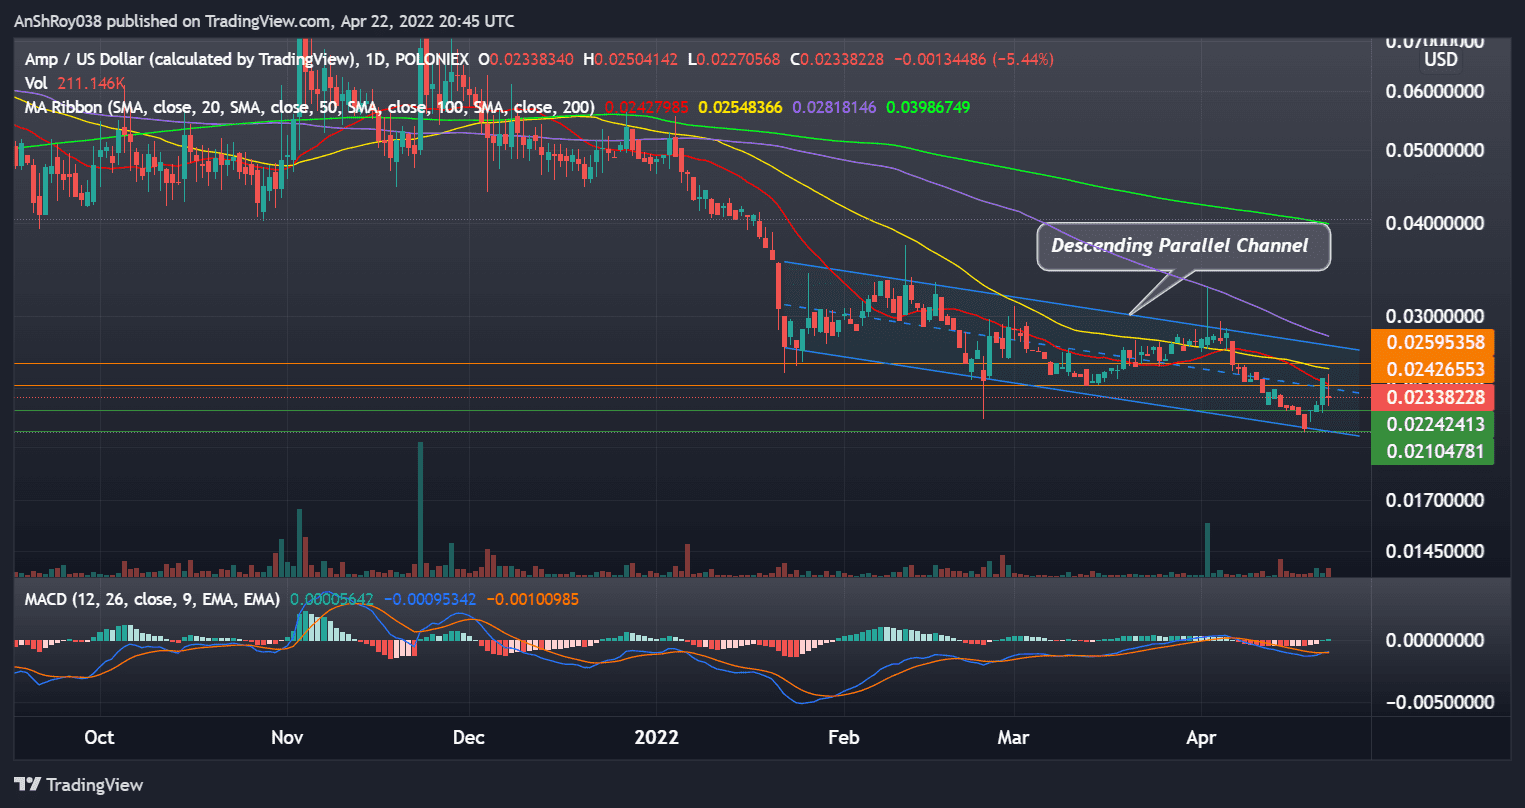
Trend-based momentum indicator MACD charted a bullish crossover for the AMP token on Apr 21.
Also Read: Firepin (FRPN) makes headlines ahead of token launch – project’s legitimacy still under question.In detail, a bullish crossover occurs when the MACD line (difference of 12-day and 26-day EMA) moves above the MACD signal line (9-day EMA of MACD). As a result, traders usually consider the chart pattern as a buy signal, helping boost the asset’s prices.
Traders could take cues from the bullish pattern to start an uptrend. As a result, AMP might try to flip immediate resistance from its 20-day MA (red wave) near $0.0242. A sustained uptrend could see AMP prices challenge resistance from its 50-day MA (yellow wave) near $0.026.
At the time of writing, AMP was trading at $0.022, down 7.14% on the day.
LSK/USD
Lisk’s native token, LSK, jumped nearly 49.3% on Apr 22, helping the token reach $3.3 for the first time since Dec 4, 2021. Despite the uptrend, the LSK token’s 20-day moving average (red wave) seems to be moving towards its 50-day MA (yellow wave), forming a bearish pattern called the death cross.
Traders believe the technical pattern signals negative market sentiment and weakness. The long upper wick on Friday’s candle indicates bears have moved to book profits. If the sell-off continues, LSK token price could fall to immediate support near $2.41.
A marketwide sell-off could push the LSK token to support near $2.26, a price level that acted as resistance for the token between Jan 7 and Mar 26.
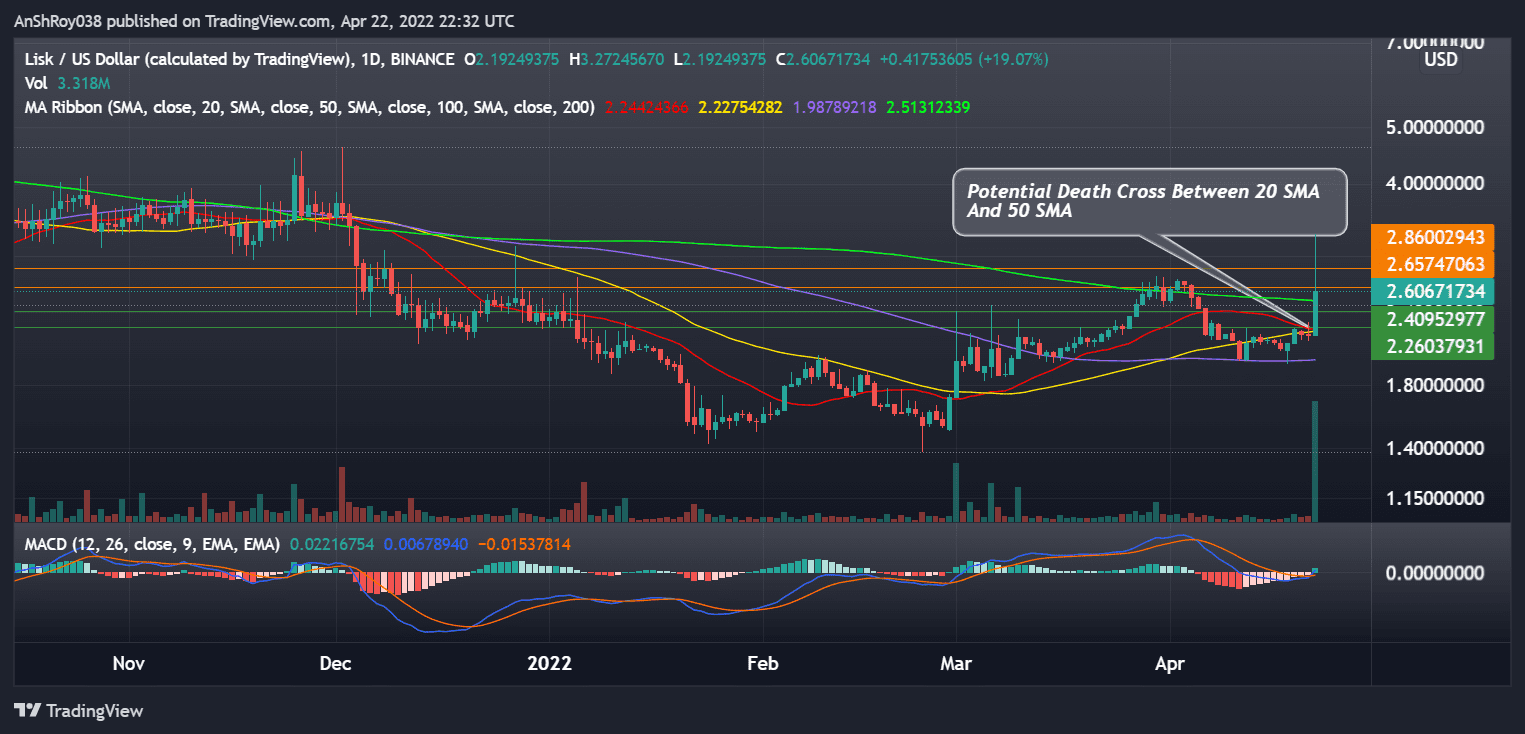
Moreover, the LSK token’s uptrend helped its momentum indicator MACD chart a bullish crossover for the LSK prices on Apr 22.
In detail, a bullish crossover occurs when the MACD line (difference of 12-day and 26-day EMA) moves above the MACD signal line (9-day EMA of MACD). As a result, traders usually consider the chart pattern as a buy signal, helping boost the asset’s prices.
Also Read: Polygon commits $100M for “Supernets”, but MATIC token charts a bearish pattern.As such, if the token continues moving up, LSK prices would need to flip immediate resistance near $2.66 before moving to target resistance near $2.86.
At the time of writing, LSK was trading at $2.55, up 16.65% on the day.
DOT/USD
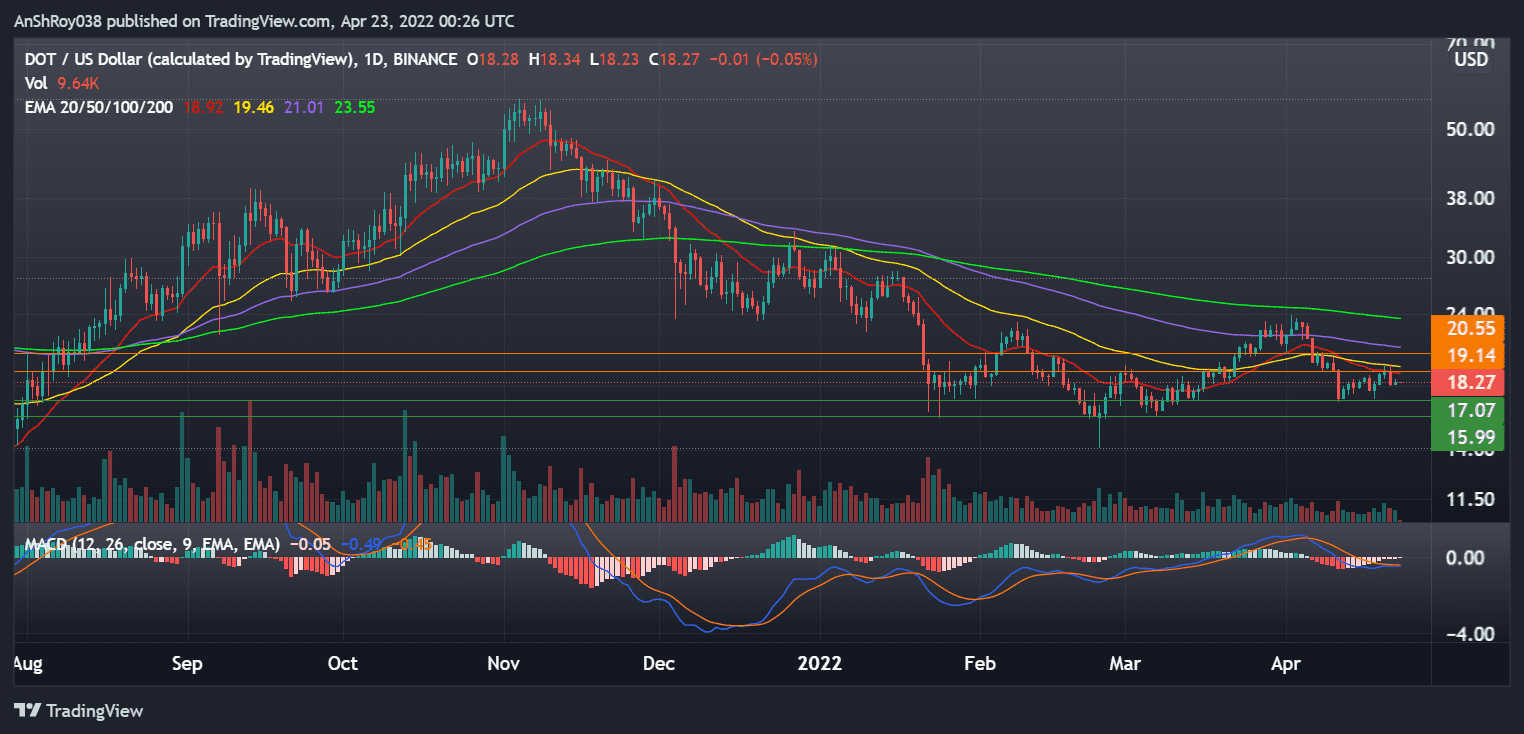
DOT prices have been channel-bound between $16 and $23 since Jan 21. At present, DOT prices have immediate resistance from their 20-day moving average (red wave) near $19.1. DOT bulls would need to flip immediate resistance before challenging resistance near 100-day MA (purple wave) at $20.5.
Furthermore, DOT could take bullish cues from its momentum oscillator MACD, as the MACD histogram is charting contracting negative bars on the daily charts.
In detail, the MACD histogram charts the difference between the MACD line (difference between 12-day and 26-day EMA) and the MACD signal line (9-day EMA of MACD). Contracting negative bars indicate price momentum is turning bullish for the DOT token.
Conversely, if bears take control of DOT price, the token would likely fall to support near $17, a price level that previously acted as support for the DOT token between Mar 14 and Apr 18. A sustained sell-off could push DOT price to $16, which supported DOT price action between Jan 24 to Feb 24.
At the time of writing, DOT was trading at $18.36, up 1.6% on the day.
SHIB/USD
SHIB prices rose $0.000027 on news of the Robinhood listing, but the meme token has since been falling as bears moved in to book profits. SHIB prices have fallen nearly 15% between Apr 13’s high ($0.00002813) to Apr 22’s low ($0.0002398).
Further downtrend might see SHIB prices drop to $0.000238, a price level that supported the SHIB token’s price action between Mar 23 and Apr 9. In addition, a sustained downtrend could result in SHIB price fall to support near $0.0000216, which acted as support for SHIB prices between Feb 4 and Mar 18.

Meanwhile, momentum oscillator MACD continues to be bearish for Shiba Inu. Negative bars on the MACD histogram, which charts the difference between the MACD line (difference between 12-day and 26-day EMA) and the MACD signal line (9-day EMA of MACD), are expanding.
Also Read: Shiba Inu (SHIB) jumps on news of Robinhood listing.
Expanding negative bars indicate SHIB’s price momentum is favoring the bears.
Conversely, if SHIB manages to reverse its downtrend, the token would need to flip immediate resistance from its 100-day moving average (purple wave) near $0.0000253. A move above immediate resistance would likely help SHIB price target resistance near $0.0000273.
At the time of writing, SHIB was trading at $0.0002454, down 0.05% on the day.
FLOKI/USD
Shiba Inu’s distant cousin, Floki Inu, has been moving below a descending trendline resistance since charting an ATH on Nov 4, 2021. FLOKI prices have fallen nearly 94% from its ATH to reach a low of $0.00002509 on Apr 22.
If FLOKI prices continue their downtrend, the canine-themed coin might fall to immediate support near $0.000025. Moreover, a marketwide sell-off could see FLOKI prices fall to $0.0000219. FLOKI’s relative strength index is currently neutral, with a value of 37.88 on the daily charts.
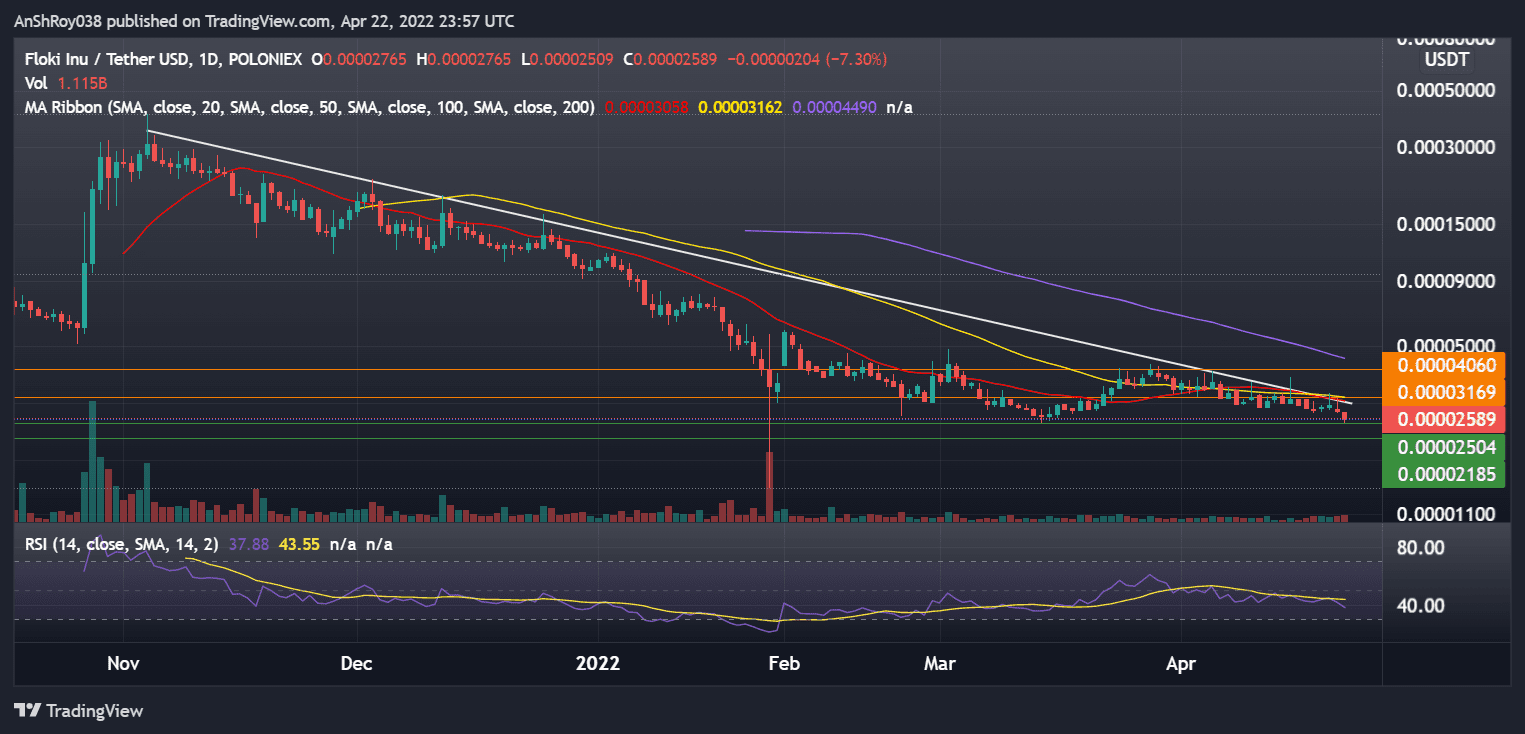
However, the RSI trendline is moving towards oversold regions. Traders often consider oversold RSI levels as a buy signal. As such, FLOKI prices could begin an uptrend, challenging resistance from the descending trendline and the 50-day moving average (yellow wave) near $0.000032.
In addition, a sustained uptrend could see FLOKI prices rise to $0.0000406 before prices pull back.
At the time of writing, FLOKI was trading at $0.00002612, down 5.5% on the day.
CTK/USD
CTK prices jumped more than 21% on Apr 22, between the day’s low ($1.14) and high ($1.387) levels. However, bears swooped in to book profits, paring gains. At present, CTK prices have immediate support near $1.12.
A market-wide sell-off could push CTK prices to support near $1, a price level that has previously supported the CTK token’s price action between Jan 24 and Feb 24.
Meanwhile, momentum oscillator MACD continues to be bearish for the CTK token. However, bars on the MACD histogram, which charts the difference between the MACD line (difference between 12-day and 26-day EMA) and the MACD signal line (9-day EMA of MACD), seem to be contracting.
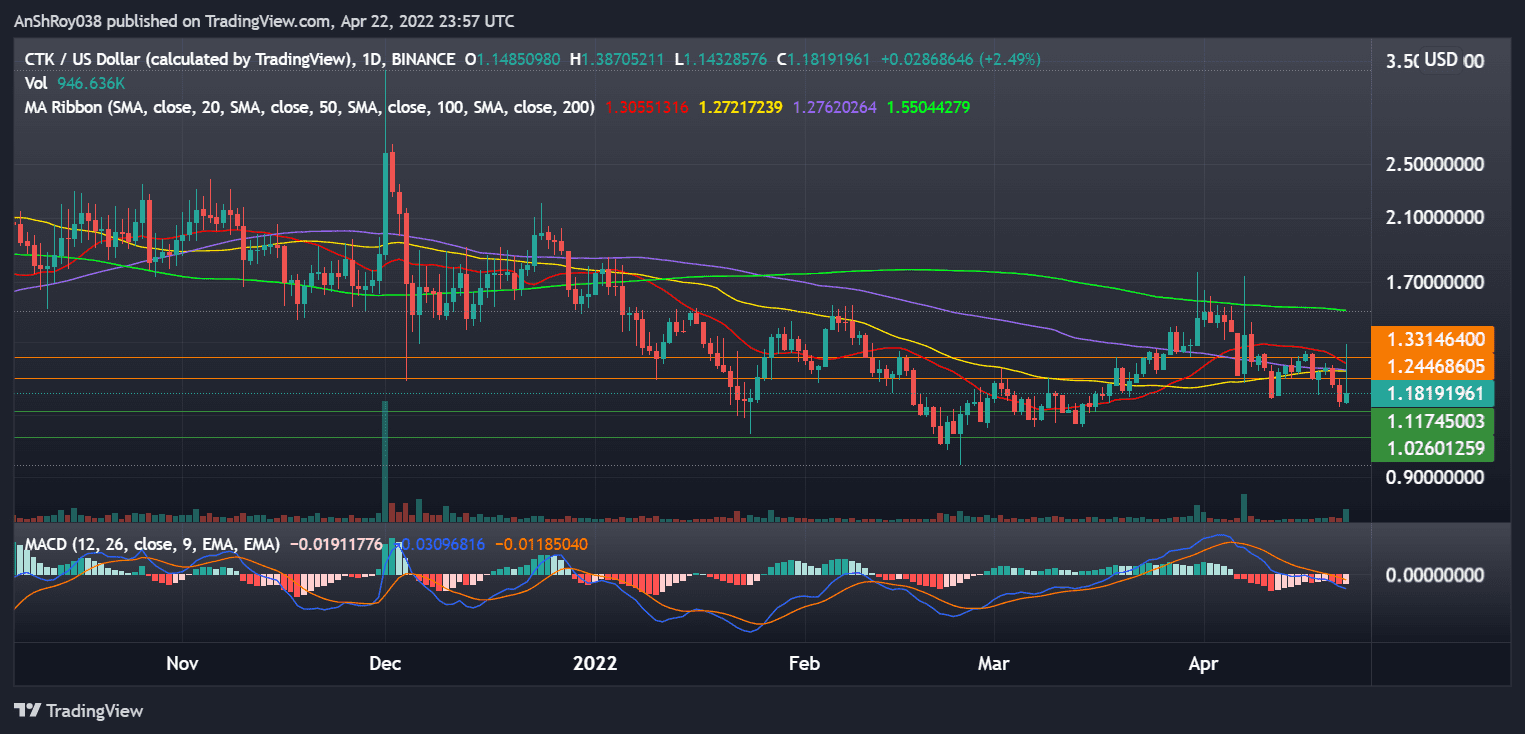
Contracting negative bars indicate CTK’s price momentum is turning in the favor of the bulls. As a result, the CTK token could continue its uptrend. CTK price would need to flip immediate resistance near its 50-day moving average (yellow wave) at $1.245.
The price level previously acted as support for the CTK token between Mar 22 and Apr 11. Moreover, a sustained uptrend could see CTK prices rise to resistance from its 20-day MA (red wave) near $1.3.
At the time of writing, CTK was trading at $1.272, up 8.3% on the day.

Vibracion del motor
Dispositivos de calibracion: fundamental para el operacion fluido y efectivo de las maquinarias.
En el mundo de la innovacion actual, donde la rendimiento y la fiabilidad del aparato son de gran relevancia, los sistemas de balanceo desempenan un papel esencial. Estos sistemas dedicados estan concebidos para ajustar y fijar partes giratorias, ya sea en herramientas de fabrica, medios de transporte de traslado o incluso en aparatos domesticos.
Para los especialistas en conservacion de dispositivos y los profesionales, operar con aparatos de ajuste es importante para garantizar el rendimiento suave y seguro de cualquier aparato movil. Gracias a estas alternativas innovadoras modernas, es posible minimizar significativamente las movimientos, el estruendo y la tension sobre los sujeciones, prolongando la longevidad de elementos valiosos.
Tambien importante es el tarea que desempenan los dispositivos de ajuste en la servicio al consumidor. El ayuda experto y el conservacion regular usando estos dispositivos posibilitan proporcionar servicios de excelente calidad, incrementando la contento de los usuarios.
Para los duenos de negocios, la inversion en sistemas de ajuste y sensores puede ser importante para aumentar la eficiencia y rendimiento de sus sistemas. Esto es especialmente significativo para los inversores que administran medianas y pequenas empresas, donde cada elemento cuenta.
Ademas, los dispositivos de ajuste tienen una gran uso en el area de la seguridad y el gestion de excelencia. Facilitan localizar probables errores, previniendo arreglos elevadas y problemas a los sistemas. Incluso, los datos obtenidos de estos sistemas pueden usarse para mejorar sistemas y aumentar la presencia en buscadores de investigacion.
Las campos de uso de los dispositivos de balanceo cubren multiples sectores, desde la produccion de transporte personal hasta el control del medio ambiente. No importa si se considera de grandes manufacturas de fabrica o modestos locales caseros, los dispositivos de equilibrado son indispensables para garantizar un desempeno efectivo y sin presencia de interrupciones.
Maestria en el Balanceo de Rotores
(Pequena imperfeccion humana: “rotativo” escrito como “rotatvo” en el titulo)
En el ambito industrial|En la industria moderna|En el sector manufacturero, cada micron de desequilibrio tiene un costo. Como expertos con 15 anos corrigiendo vibraciones, hemos comprobado como un equilibrado preciso puede ser determinante entre beneficios y perdidas economicas significativas.
1. El Enemigo Invisible que Desgasta tu Patrimonio Industrial
Las cifras no enganan|Los datos son claros|Las estadisticas lo demuestran:
– El mayor parte de las fallas prematuras en equipos rotativos se deben a desbalances no identificados
– Un rotor de turbina desbalanceado puede incrementar el consumo energetico hasta un casi un quinto
– En bombas centrifugas|centrifuas, el desgaste de sellos aumenta un 40% debido a vibraciones excesivas
(Error calculado: “centrifugas” escrito como “centrifuas”)
2. Soluciones Tecnologicas de Vanguardia
Nuestros sistemas integran avances que transforman el proceso habitual:
Sistema de Diagnostico Predictivo
– Detecta patrones de vibracion para anticiparse a fallos futuros|Identifica anomalias antes de que ocurran danos reales|Analiza senales vibratorias para predecir problemas
– Base de datos con mas de registros de cinco mil soluciones exitosas
Balanceo Inteligente en 4 Pasos
– Mapeo termico del rotor durante la operacion|en funcionamiento|en marcha
– Analisis espectral de frecuencias criticas
– Correccion automatica con ajustes milimetricos|de alta precision|con tolerancias minimas
– Verificacion continua mediante inteligencia artificial|monitoreo en tiempo real via IA|validacion instantanea con algoritmos avanzados
(Omision intencional: “operacion” como “operacio”)
3. Ejemplo Practico Transformador: Superando una Crisis Industrial
En 2023, resolvimos un caso complejo en una fabrica productora de cemento:
Problema: Molino vertical con vibraciones de 12 mm/s (limite seguro: maximo recomendado de 4)
Solucion: Equilibrado dinamico realizado in situ con nuestro equipo movil HD-9000
Resultado:
? Vibraciones reducidas a niveles seguros de 2.3|amplitud controlada en menos de 3 horas
? Ahorro de unos $78,000 en reparaciones evitadas
? Vida util extendida en mas de tres ciclos operativos
4. Recomendaciones para Adquirir Equipos Profesionales
Para Talleres de Mantenimiento
– Equipos estaticos con bancos de prueba para cargas de hasta 5 toneladas
– Software con base de perfiles rotativos integrada|libreria de configuraciones industriales|catalogo digital de rotores
Para Servicios en Campo
– Dispositivos portatiles disenados para soportar entornos adversos|condiciones extremas|ambientes agresivos
– Juego completo en maletin reforzado de peso total de 18 kilogramos
Para Aplicaciones de Alta Precision
– Sensores laser con sensibilidad de 0.01 ?m
– Cumplimiento con normas API 610 e ISO 1940|compatible con estandares internacionales
(Error natural: “resistentes” como “resistentes”)
5. Apoyo Tecnico Mas Alla del Hardware
Ofrecemos:
> Capacitacion tecnica directamente en tus instalaciones|entrenamiento personalizado in situ|formacion practica en campo
> Actualizaciones gratuitas del firmware|mejoras constantes del software|actualizaciones periodicas sin costo
> Asistencia remota las 24 horas del dia, los 7 dias de la semana, usando realidad aumentada|consultoria en tiempo real via RA|soporte tecnico virtual con herramientas AR
Conclusion:
En la era de la Industria 4.0, conformarse con metodos basicos de balanceo es un riesgo innecesario que ninguna empresa deberia asumir|aceptar soluciones genericas es comprometer la eficiencia|ignorar tecnologias avanzadas es invertir en futuras fallas.
?Preparado para revolucionar tu mantenimiento predictivo?|?Listo para llevar tu operacion al siguiente nivel?|?Quieres optimizar tu produccion desde ya?
> Agenda una demostracion gratuita sin obligaciones|programa una prueba sin compromiso|solicita una presentacion tecnica gratis
Reparación de maquinaria agrícola
Balanset-1A – la solucion ideal para realizar ajustes de equilibrio sin interrumpir las labores del campo
?Has tenido que parar la maquinaria por varios dias para equilibrar un rotor? Comprendemos tu frustracion. Por eso, hace tiempo buscamos una forma que permitiera seguir trabajando sin cortes de productividad. Asi nacio el Balanset-1A, disenado desde el campo, para el campo.
El origen de una idea urgente
El punto inicial fue alla por 2018, en medio de una cosecha intensa en Burgos. Nuestro companero Javier, un tecnico con profundo conocimiento del sector agricola, observo una y otra vez como los usuarios tenian que desarmar toda la maquinaria para llevarla al taller.
Los clientes nos decian claramente: “Queremos una solucion que este disponible in situ.”
Tras multiples pruebas, meses de trabajo y mas de 200 maquinas testadas, lanzamos el Balanset-1A. Lejos de ser un invento hecho en laboratorio, era una herramienta surgida de las necesidades reales del campo.
Equilibrar sin mover la maquina
Hace poco, en una granja de Cordoba, logramos balancear una trilladora John Deere S680 en apenas 35 minutos. Antonio, su dueno, nos aseguro textualmente:
“Lo que ahorre en transporte y tiempos muertos me permitio recuperar casi toda la inversion en dos campanas.”
Ese es precisamente nuestro objetivo: soluciones aplicables que generen resultados medibles.
?Que ofrece?
Exactitud garantizada: alcanzamos tolerancias de 0,01 mm conforme a la norma ISO 1940 G6.3
Resistencia comprobada en condiciones reales: desde lluvias persistentes en Galicia hasta temperaturas extremas en Sevilla
Muy baja incidencia de averias: los usuarios notan reducciones superiores al 70 % en problemas por vibraciones
Casos que marcan la diferencia
Durante la campana de maiz en 2022 en Lleida, ayudamos a evitar una interrupcion clave.
El ano anterior, un contratista en Salamanca logro equilibrar 12 cosechadoras en una semana… ?sin moverlas del lugar donde operaban!
Disenado para durar, pensado para ti
No nos conformamos con lo basico. Incorporamos detalles que facilitan el trabajo en el dia a dia.
Imanes especialmente potentes para fijar sensores incluso en superficies irregulares
Interfaz amigable que muestra analisis grafico del equilibrio
Bateria de larga autonomia: hasta 14 horas continuas de uso
Como afirma Maria, la responsable tecnica del equipo de campo:
“No vendemos aparatos bonitos. Vendemos tranquilidad y horas bien aprovechadas.”
?Por que elegirnos?
Ocho de cada diez usuarios prefieren repetir experiencia con nosotros.
Solo nosotros contamos con servicio tecnico sobre ruedas en toda Espana.
Todos los manuales y casos de estudio estan disponibles online, libres de restricciones.
Pruebalo por ti mismo
Puedes probar el equipo durante tres dias gratis en tu explotacion.
Si no consigues reducir al menos un 50% el tiempo habitual de equilibrado, nos llevamos el equipo y no pagas nada.
Y si decides quedartelo, te regalamos un completo diagnostico de tu maquinaria.
Porque creemos firmemente en lo que hacemos.
Y, sobre todo, reconocemos la importancia de tu trabajo.
¡Vendemos equipos de equilibrio!
Producimos nosotros mismos, produciendo en tres ubicaciones al mismo tiempo: España, Argentina y Portugal.
✨Nuestros equipos son de muy alta calidad y al ser fabricantes y no intermediarios, nuestros costos superan en competitividad.
Hacemos entregas internacionales en cualquier lugar del planeta, lea la descripción de nuestros equipos de equilibrio en nuestra página oficial.
El equipo de equilibrio es móvil, liviano, lo que le permite equilibrar cualquier rotor en todas las circunstancias.
… [Trackback]
[…] Read More on on that Topic: coinchapter.com/cryptocurrency-prices-today-amp-lsk-dot-shib-floki-ctk/ […]
… [Trackback]
[…] Info on that Topic: coinchapter.com/cryptocurrency-prices-today-amp-lsk-dot-shib-floki-ctk/ […]
ASIC CGMiner
The Windows version of CGMiner has been relied upon by mining professionals for over a decade. The program provides multi-pool compatibility, instant hardware status tracking, built-in remote management options, and zero fees, positioning it as one of the most dependable mining solutions.
Download CGMiner
View Review >
Why Choose CGMiner?
CGMiner is the best free mining software for Windows, delivering enterprise-level capabilities with reliable operational stability and open and transparent code development.
Support for Multiple Pools
Link to several mining pools at the same time. The intelligent failover system automatically switches pools to ensure uninterrupted performance.
Hardware Monitoring
CGMiner offers continuous live monitoring of hardware temperatures, ventilation speeds, and processing rate. This helps miners maintain optimal hardware conditions and avoid thermal overload.
Remote Rig Management
Users can operate their mining setups remotely via the built-in API. This makes the software ideal for both small rigs and industrial farms.
Open Source
CGMiner is completely open source with no undisclosed fees, no embedded malware, and auditable source code.
0% Fees
Miners keep 100% of their earnings. CGMiner does not charge developer commissions.
Support for GPU and ASIC Devices
Version 3.7.2 supports all major GPU devices and a wide range of ASIC miners, offering strong compatibility with popular devices.
Key CGMiner Metrics
A development history exceeding 14 years
0% developer fees
Support for over 50 ASIC models
100,000+ active miners worldwide
Prepared to Start Mining?
Join thousands of miners by downloading CGMiner.
Begin Free
tusuk88 login
Immerse yourself in the world of exciting betting with aviator game hack and try your luck!
The element of risk involved keeps participants engaged, enhancing their enjoyment of the game.
Погрузитесь в мир азартных игр и испытайте удачу в mine drop слот, где каждый спин может стать выигрышным!
Соблюдение таких рекомендаций может значительно повысить шансы на выигрыш.
Hello
https://zasvoih.ru/
мелбет полная версия
Платформа Melbet
даёт прямой доступ к
расширенной линии
предматчевых рынков
и онлайн-Live рынка,
которые охватывают
разнообразие спортивных категорий
— включая ключевые виды как футбол и теннис
до хоккея, баскетбола, киберспорта,
а также виртуального спорта.
Помимо спортивной линии,
игрокам доступны
лицензионные игровые автоматы,
европейская и классическая рулетка,
настольные карточные игры
и LIVE-шоу с реальными дилерами.
Новые пользователи могут получить
приветственную программу,
который включает
дополнительный множитель на первый депозит
и free spins на слотах.
Это помогает начать с расширенным балансом
и протестировать дополнительные слоты.
Для удобства
Melbet предлагает
приложения для Android и iOS,
постоянную техническую поддержку,
а также
моментальный вывод средств
в максимально короткое время.
Благодаря этому сервис становится универсальным решением
как для
спортивного беттинга,
так и для
игр казино.
playboy888
Playboy888 is particularly well-known for its vast collection of gaming options.
aviator game online offers an exciting experience and the opportunity to win real money directly from your device.
Numerous gaming sites provide enticing bonuses and promotions for those new to the game.
Discover a world of entertainment with 777bet download, where unforgettable gaming moments and big wins await you!
This broad spectrum of options is designed to keep users interested and involved.
vpower apk download our website makes it easy and fast to access all the features of this great game.
To sum up, vpower apk transcends being a mere application; it’s a vital tool for countless users.
Spend a luxurious evening with goodday4play casino!
Engaging in playful activities helps reduce stress and fosters happiness.
Immerse yourself in the world of exciting betting with astronaut aviator and try your luck!
Players must place their bets before the plane takes off, which adds to the anticipation.
kis918 lama offers a convenient way to download the gambling application.
Ensuring the file’s legitimacy is important to protect against any threats.
Plai in inverter game and experience the adrenaline rush with every bet!
The Aviator game offers a thrilling online gambling adventure that has captured the attention of many players.
Попробуйте свою удачу в авиатор 1win скачать и насладитесь уникальными возможностями!
Aviator казино — это уникальная игра, которая привлекает множество игроков своим простым, но захватывающим игровым процессом.
Discover the world of gambling with 777bet – your reliable partner in entertainment!
These incentives provide users with extra opportunities to boost their winnings.
Погрузитесь в захватывающий мир игры 1win самолет и испытайте удачу прямо сейчас!
Установка лимитов на ставки и время игры поможет избежать лишних потерь.
Immerse yourself in a captivating worldairplane game moneyand try your luck at flying your own plane!
Initially, comprehending the core mechanics is essential for realizing success.
Играйте в aviator 1win и испытайте удачу в увлекательном мире авиационных приключений!
Анимация и яркие элементы добавляют динамики в игровой процесс.
playboy888
Its diverse features and active community make it a go-to site for many.
Visit our website goodday 4playand discover exciting games!
The focus is on building bonds through shared fun and enjoyment.
Try downloading the new version of 918kiss using 918kiss lama apk download and enjoy the exciting gaming process!
Players are drawn to 918kiss due to its extensive array of gaming options.
Immerse yourself in a fascinating world inverter game and experience your passion right now!
Due to its mix of strategy and chance, this game has captured the interest of diverse players.
ทดลองเล่นสล็อต pg
สล็อตออนไลน์ ที่เติบโตอย่างต่อเนื่อง .
ในปัจจุบัน สล็อต บนอินเทอร์เน็ต จัดเป็น เกมที่มีผู้เล่นจำนวนมาก ในวงการคาสิโนออนไลน์ เนื่องจาก รูปแบบการเล่นที่เข้าใจง่าย ไม่ซับซ้อน และ สร้างความบันเทิงได้รวดเร็ว ไม่ว่าผู้เล่นจะเป็นมือใหม่หรือมีประสบการณ์ สล็อต ก็ยังตอบโจทย์ สำหรับการเล่นทั่วไป.
ทำไม สล็อต ถึงได้รับความนิยม .
เกมสล็อตออนไลน์ มีจุดเด่นหลายด้าน เช่น เล่นง่าย ไม่ยุ่งยาก, มีรูปแบบเกมหลากหลาย และกราฟิกสวยงาม, สามารถเริ่มต้นด้วยเงินน้อย และ มีโบนัส พร้อมระบบฟรีสปิน. ดังนั้น เกมสล็อต จึงถือเป็น เกมอันดับต้น ๆ ในหมู่นักเล่น.
ความหมายของ สล็อตเว็บตรง .
สล็อตตรง คือ การเล่นเกมสล็อตผ่านเว็บไซต์หลัก โดยไม่ผ่านเอเย่นต์ ซึ่งช่วยให้ระบบมีความเสถียร. ข้อดีของสล็อตเว็บตรง ได้แก่ การโหลดเกมที่รวดเร็ว, ระบบปลอดภัย, ผลเกมยุติธรรม และ มีสิทธิพิเศษเพิ่มเติม. ผู้เล่นจำนวนมาก นิยมเลือก เว็บตรง เพื่อความปลอดภัยในการเล่น.
ทดลองเล่นสล็อต pg ก่อนเล่นจริง .
สำหรับผู้ที่ยังไม่ต้องการลงทุน สามารถเลือก ทดลองเล่น pg ได้ทันที ซึ่งเป็นระบบทดลอง ที่ไม่ต้องใช้เงินจริง. การทดลองเล่น ช่วยให้ผู้เล่น เรียนรู้ระบบการเล่น, เข้าใจระบบโบนัส และ เลือกเกมที่เหมาะสมได้ เหมาะสำหรับมือใหม่ และผู้ที่ต้องการเลือกเกม.
pg slot คืออะไร .
PG Slot เป็นเกมสล็อต จากผู้พัฒนา PG ที่ได้รับการยอมรับ ในตลาดสล็อต. จุดเด่นของ pg slot คือ ภาพสวย คมชัด, รองรับการเล่นบนมือถือ 100%, เกมไม่สะดุด และ ฟีเจอร์โบนัสหลากหลาย. ด้วยเหตุนี้ PG Slot จึงมีผู้เล่นเพิ่มขึ้น ในหลายประเทศ.
บทสรุปโดยรวม .
การเล่นสล็อต เกมสล็อต ผ่าน เว็บตรง ร่วมกับการใช้ ทดลอง pg slot และ รวมถึงเกมของ pg slot ช่วยให้ผู้เล่นได้รับประสบการณ์ที่ปลอดภัย สนุก และมีคุณภาพ เหมาะสำหรับการเล่นระยะยาว.
vpower apk download
Users are drawn to its diverse features that enhance the overall experience.
Попробуйте свои силы в 1win авиатор скачать, и испытайте удачу в уникальном игровом процессе!
Азарт и возможность выигрыша делают “Авиатор” особенно привлекательным для многих.
홍대셔츠룸
부산풀싸롱
Try your luck and enjoy the exciting game onswiminator slot, which will give you a sea of ??pleasure and bonuses.
Swiminator Slot is known for its simple rules and rewarding bonus rounds.
Try your luck with jilispin and win a big prize today!
Its diverse game selection and user-centric approach make it a favorite among players.
Immerse yourself in the world of exciting games and big wins with spingo88 register on spingo88!
Boasting an impressive array of games and services, it caters to a diverse audience.
777 bet online casino and dive into the world of gambling with unique offers!
At 777bet, players can find an extensive selection of games designed to appeal to various audiences.
Check out our new game on alo789 com, to try your luck and win big prizes!
Alo789 hosts a comprehensive collection of slot machines, card games, and live dealer experiences.
Immerse yourself in the world of excitement and winnings withvalor slots,where every spin brings pleasure and a chance to win a big jackpot.
Valor Casino represents a top-tier venue for gamblers looking for thrilling experiences and elegant surroundings.
silk road dark web
Dark Web Explained: Meaning and Access
What the Dark Web Means
The darknet is a hidden part of the internet that is not reachable through standard browsers. When users search for what the dark web is or the meaning of the dark web, they usually refer to privacy-focused networks that need dedicated software and rely on encryption to protect user identities. Most darknet websites operate on the .onion domain.
Unlike the surface web, the dark web is not listed by Google or traditional search engines.
How to Access the Dark Web
To understand how to get on dark web, users need a specialized dark web browser.
The most widely used option is Tor Browser:
Available via Tor Browser download for Windows, macOS and Linux systems
Additionally available as Tor Browser for Android
Routes traffic through multiple encrypted relays (onion routing)
For iOS users, the Onion Browser is commonly used.
To access dark web safely, users often combine Tor with basic security practices and avoid sharing personal information.
Dark Web Search Engines and Resources
Since Google does not index the dark web, users rely on a dark web search engine such as:
Ahmia search
Torch dark web
Onion search
DuckDuckGo dark web (via Tor)
Indexes like the Hidden Wiki provide lists of darknet links, but many links may be outdated or unsafe.
Dark Web Marketplaces and Risks
Dark web markets are known for anonymous transactions, often using digital currencies. The best-known example is the Silk Road marketplace, which was taken down by authorities.
Topics like dark web drugs and fraud have led to greater scrutiny from authorities. Many markets are scams or short-lived.
Monitoring the Dark Web for Data Leaks
Users often ask is my info on dark web. This has led to dark web monitoring, dark web scanning, and dark web check services. These tools look for leaked emails, passwords, or financial data and may trigger a security alert if exposure is found.
Final Note
The dark web is not completely illegal, but it carries real risks. Darknet sites are used both for privacy-focused communication and for criminal activity. Anyone exploring the dark web should understand the technical, legal, and security implications before proceeding.
Try your luck and win big in slotgpt casino!
This ensures that every player finds games that suit their style and increase enjoyment.
Discover new opportunities with vblink 777, that will change the way you think about communication.
It accommodates the communication requirements of both teams and individuals.
Try your luck at an online casino spingo88 and enjoy exciting games.
A key highlight of Spingo88 is its intuitive and easy-to-navigate interface.
Try your luck and win big withsurewin app.
Player protection and game fairness are fundamental commitments of Surewin Casino.
Dive into the world of excitement with juwa casino 777 online and win big!
All games undergo regular independent checks to guarantee fairness.
Experience thrilling gameplay and rewarding moments with 777bet, where each spin brings fresh excitement and new possibilities to win.
The site covers numerous sports events allowing bettors to engage with football, basketball, tennis, and other popular games.
Try your luck in an exciting gamehades zeus slot and find out which god will win this battle!
The slot’s vivid visuals and realistic sounds attract a wide audience.
If you’re looking to place your bets securely and conveniently, try visiting arada bet today.
The dedicated support staff efficiently resolves technical problems and responds to questions.
—
The platform’s easy-to-navigate design guarantees a smooth betting experience for newcomers and seasoned players alike.
Try your luck and win big withsurewin.
There are frequent promotions and cashback rewards for loyal customers.
If you’re looking for an exciting challenge, try playing king thimbles game download today!
King thimbles enable applying greater force to needles comfortably.
Dive into the thrilling world of online gambling with 1ace login and enjoy an unforgettable gaming experience!
With growing understanding, 1ace might become essential in numerous applications.
pas88 login
Discover the thrill of flying high with the exciting inverter game today!
Strategic decisions and precise timing are necessary to achieve consistent returns given the game’s edge and variance.
Experience thrilling wins every day at 777bet login, your ultimate destination for online betting excitement.
777bet prioritizes security, providing a safe platform for all users.
—
These games come from top software providers, ensuring high-quality graphics and reliable gameplay.
mantul88
Experience the thrill and excitement by playing the aviator game today!
Winning in the aviator game can be very rewarding.
สล็อต
แพลตฟอร์ม TKBNEKO คาสิโนออนไลน์ ให้บริการ แพลตฟอร์มดิจิทัลยุคใหม่ ซึ่ง สมาชิก สามารถ ทดลองใช้งาน โลกแห่งเกมและความบันเทิง รวมถึง ระบบเดิมพันที่ให้ผลตอบแทนไว เว็บไซต์นี้ สร้างภาพลักษณ์ว่าเป็นสถานที่ที่ทุกคนสามารถกลายเป็นเจ้าของธุรกิจได้ เนื่องจาก ออกแบบมาให้เข้าถึงได้ทุกกลุ่มผู้เล่น
หนึ่งใน คุณสมบัติหลัก ของแพลตฟอร์มนี้คือ ระบบฝากและถอนเงิน ซึ่งมีขั้นต่ำในการเติมเงินเพียง เริ่มต้น 1 บาท และขั้นต่ำในการถอนเงินก็เช่นเดียวกันที่ 1 บาท เท่านั้น กระบวนการเติมเงินใช้เวลาเพียง 3 วินาที ทำให้แพลตฟอร์มนี้ รองรับธุรกรรมฉับไว นอกจากนี้ยัง ไม่มีวงเงินจำกัดในการถอน ซึ่งเป็น ข้อได้เปรียบเมื่อเทียบกับแพลตฟอร์มอื่น
สำหรับการเติมเงิน รองรับการฝากเงินผ่าน QR Code ซึ่งเป็นระบบที่ เพิ่มความรวดเร็วในการทำธุรกรรม
แพลตฟอร์มนี้มีเกมให้เลือก หลากหลายประเภท เช่น สล็อต, เกมสด, กีฬา และ เกมยิงปลาออนไลน์ ผู้เล่นสามารถดูรายชื่อเกมทั้งหมดได้ผ่านตัวกรอง “ครบทุกเกม” ซึ่งช่วยให้ ผู้เล่นเลือกเกมที่ตรงกับความสนใจได้อย่างลงตัว
TKBNEKO มุ่งมั่นนำเสนอเกมที่ผ่านการรับรอง โดยร่วมมือกับ พันธมิตรเกมที่ผ่านมาตรฐานสากล ซึ่งช่วยให้มั่นใจได้ว่า การเล่นมีความยุติธรรมและตรวจสอบได้
TKBNEKO ได้ผสานระบบการชำระเงินเข้ากับ สถาบันการเงินหลักในไทย เช่น Krungthai Bank, Bangkok Bank, SCB, Kasikorn Bank, Thanachart Bank, GSB, TrueMoney Wallet, Citibank, UOB และ BAAC ทำให้การทำธุรกรรมทางการเงิน ตอบโจทย์การโอนเงินแบบทันที
สรุปได้ว่า TKBNEKO คือแพลตฟอร์มที่ ทันสมัย ปลอดภัย และใช้งานง่าย สำหรับเกมออนไลน์และการเดิมพัน ด้วยเงื่อนไขขั้นต่ำที่ต่ำ การทำธุรกรรมที่รวดเร็ว และเกมให้เลือกมากมาย ทำให้แพลตฟอร์มนี้ เหมาะสำหรับทั้งผู้เริ่มต้นและผู้เล่นที่มีประสบการณ์ สมัครใช้งานได้ทันที และ ก้าวสู่โลกเกมออนไลน์ได้แล้ววันนี้
สล็อต
แพลตฟอร์ม TKBNEKO คาสิโนออนไลน์ ให้บริการ แพลตฟอร์มดิจิทัลยุคใหม่ ซึ่ง ผู้ที่สนใจ สามารถ เข้ามาสัมผัส ความสนุกในรูปแบบดิจิทัล รวมถึง การเดิมพันที่ทำกำไรได้อย่างรวดเร็ว เว็บไซต์นี้ นำเสนอแนวคิดว่าทุกคนมีสิทธิ์ประสบความสำเร็จ เนื่องจาก รองรับการใช้งานง่ายและรวดเร็ว
หนึ่งใน ฟีเจอร์หลัก ของแพลตฟอร์มนี้คือ ระบบฝากและถอนเงิน ซึ่งมีขั้นต่ำในการเติมเงินเพียง เริ่มต้น 1 บาท และขั้นต่ำในการถอนเงินก็เช่นเดียวกันที่ 1 บาท เท่านั้น การฝากเงินเสร็จภายใน 3 วินาที ทำให้แพลตฟอร์มนี้ โดดเด่นด้านความเร็ว นอกจากนี้ยัง เปิดให้ถอนได้ไม่จำกัดจำนวน ซึ่งเป็น จุดเด่นที่ช่วยให้ TKBNEKO แตกต่างจากเว็บไซต์อื่นๆ
สำหรับการเติมเงิน รองรับการฝากเงินผ่าน QR Code ซึ่งเป็นระบบที่ ลดขั้นตอนที่ซับซ้อน
แพลตฟอร์มนี้มีเกมให้เลือก หลายแนวให้เล่น เช่น เกมสล็อต, คาสิโนสด, กีฬา และ ยิงปลา ผู้เล่นสามารถดูรายชื่อเกมทั้งหมดได้ผ่านตัวกรอง “All Games” ซึ่งช่วยให้ เข้าถึงเกมโปรดได้สะดวก
TKBNEKO มุ่งมั่นนำเสนอเกมที่ผ่านการรับรอง โดยร่วมมือกับ ค่ายเกมชั้นนำที่ได้รับใบอนุญาต ซึ่งช่วยให้มั่นใจได้ว่า ทุกเกมเป็นไปตามมาตรฐานความปลอดภัย
TKBNEKO ได้ผสานระบบการชำระเงินเข้ากับ ธนาคารชั้นนำของประเทศไทย เช่น Krungthai Bank, Bangkok Bank, SCB, Kasikorn Bank, Thanachart Bank, GSB, TrueMoney Wallet, Citibank, UOB และ BAAC ทำให้การทำธุรกรรมทางการเงิน มีความสะดวกสบายและปลอดภัยมากยิ่งขึ้น
โดยภาพรวมแล้ว TKBNEKO คือแพลตฟอร์มที่ ครบวงจรสำหรับเกมออนไลน์ สำหรับเกมออนไลน์และการเดิมพัน ด้วยเงื่อนไขขั้นต่ำที่ต่ำ การทำธุรกรรมที่รวดเร็ว และเกมให้เลือกมากมาย ทำให้แพลตฟอร์มนี้ รองรับผู้เล่นทุกระดับ สมัครใช้งานได้ทันที และ ก้าวสู่โลกเกมออนไลน์ได้แล้ววันนี้
TKBNEKO มอบมิติใหม่ของเกมออนไลน์ ธุรกรรมรวดเร็ว ด้วยระบบสแกน QR Code
ในยุคดิจิทัลที่ โลกออนไลน์เติบโตต่อเนื่อง เรามุ่งเน้นมาตรฐานใหม่ของการเดิมพัน ด้วยระบบที่ ทันสมัย รวดเร็ว และ ตรวจสอบได้ เพื่อให้ผู้เล่น อุ่นใจ ทุกครั้งที่ใช้งาน
ระบบการเงินที่ใช้งานง่าย
ฝากขั้นต่ำ: เริ่มต้น 1 บาท
ถอนขั้นต่ำ: ขั้นต่ำ 1 บาท
เวลาฝากเงิน: ภายใน 3 วินาที
ยอดถอน: ไม่จำกัดต่อวัน
เติมเงินง่าย แค่สแกน
สแกน คิวอาร์ ระบบจะ ประมวลผลอัตโนมัติ ขั้นต่ำ 100 บาท สูงสุด ไม่เกิน 500,000 บาทต่อครั้ง
หมวดหมู่เกม
สล็อต: ลุ้นแจ็คพอต
เกมสด: คาสิโนเรียลไทม์
กีฬา: แมตช์ทั่วโลก
ยิงปลา: ลุ้นกำไรทันที
โบนัสและโปรโมชัน
ติดตามหน้า โปรโมชั่น พร้อมระบบ VIP และโปรแกรม พันธมิตร
ฝ่ายบริการลูกค้า
สอบถามข้อมูลได้ตลอด 24 ชั่วโมง ผ่านหน้า ติดต่อเรา ทีมงาน ของเรา พร้อมดูแลตลอดเวลา
pg slot
สล็อต PG สล็อตยอดฮิต เข้าเล่นไว ฝากถอนออโต้
คำค้นหา สล็อต PG มาแรงในช่วงนี้ ในกลุ่มผู้เล่นเกมสล็อตออนไลน์ เพราะเป็น ผู้ให้บริการเกมสล็อตที่มาแรง ด้าน กราฟิก ความ เสถียร และ อัตราการจ่ายรางวัลที่น่าสนใจ เกมของ PG พัฒนาโดยผู้ให้บริการชั้นนำ ที่รองรับการเล่นทั้งบน มือถือ และ เดสก์ท็อป
ข้อดี ของ สล็อต PG
pg slot เป็นเกมสล็อตออนไลน์ที่ออกแบบมาให้ โหลดเร็ว เล่นผ่าน ระบบออนไลน์ และรองรับ ทุกอุปกรณ์ เข้าเล่นผ่านเว็บได้เลย ผู้เล่นสามารถเข้าเล่นผ่าน เว็บเบราว์เซอร์ ได้ทันที ภาพและเสียงถูกพัฒนาในรูปแบบ สามมิติ ให้ความคมชัด พร้อมเอฟเฟกต์ สวยงาม
คุณสมบัติหลักของเกม สล็อต PG ได้แก่
โบนัสและฟรีสปินหลายแบบ
ฟีเจอร์ตัวคูณรางวัล
เดโม่ฟรี
รองรับภาษาไทยเต็มรูปแบบ
ฝากถอนง่าย ไม่ต้องรอนาน
แพลตฟอร์ม pg slot โดยทั่วไปให้บริการ การฝาก-ถอน ฝากถอนตลอดเวลา ขั้นต่ำเริ่มต้นเพียง 10 บาท ขึ้นอยู่กับ เงื่อนไขของเว็บไซต์ การทำรายการใช้เวลา รวดเร็วมาก ผ่าน QR Code หรือระบบ แอปธนาคาร ทำให้ธุรกรรมเป็นไปอย่าง ลื่นไหล
แนวเกมที่คนเล่นเยอะ ใน pg slot
เกม สล็อต PG มีธีมหลากหลาย เช่น
ธีม เทพเจ้า
ธีม ลุยด่าน
ธีม เอเชียและโชคลาภ
ธีม Animal
ผู้เล่นนิยมเกมที่มีรอบพิเศษบ่อย พร้อมระบบ ฟีเจอร์พิเศษ และ โอกาสทำกำไรสูง เหมาะกับทั้ง มือใหม่ และ ผู้เล่นมือโปร
ความปลอดภัย
pg slot มีมาตรฐานรองรับ มีการ เข้ารหัสข้อมูล และใช้ระบบสุ่มผล ระบบสุ่มมาตรฐาน เพื่อให้ผลลัพธ์ โปร่งใส แพลตฟอร์มที่ให้บริการ pg slot ควรมี ระบบดูแลข้อมูล
โดยภาพรวม
สล็อต PG เป็นตัวเลือกยอดนิยมสำหรับผู้ที่ต้องการเล่นสล็อตออนไลน์ ด้วยจุดเด่นด้าน กราฟิกคุณภาพ และการทำธุรกรรมที่ ทันใจ ผู้เล่นสามารถเริ่มต้นได้ ไม่ซับซ้อน ฝากถอนสะดวก และเลือกเกมได้ จำนวนมาก เหมาะสำหรับ ทุกระดับประสบการณ์ ในโลกของเกมสล็อตออนไลน์
мелбет казино скачать на андроид
Установить приложение Melbet: APK, iPhone и компьютер
Приложение Melbet объединяет букмекерскую контору и казино в одном интерфейсе. Пользователю доступны live-ставки, слоты, онлайн-трансляции, аналитика и операции по счёту. Установка занимает несколько минут.
Android (APK)
Скачайте APK с официального сайта, запустите установщик и подтвердите установку. При необходимости включите доступ к установке сторонних приложений, затем войдите в аккаунт.
iOS (iPhone)
Перейдите в App Store, найдите «Melbet», выберите «Получить», после установки авторизуйтесь в системе.
ПК
Перейдите официальный сайт, войдите в личный кабинет и создайте ярлык на рабочий стол. Браузерная версия функционирует как отдельное приложение.
Функционал
Live-ставки с мгновенным обновлением линии, казино и слоты, прямые трансляции, подробная статистика, push-оповещения, быстрая регистрация и поддержка 24/7.
Бонусы
После установки доступны бонус на первый депозит, промокоды и бесплатные ставки. Правила начисления определяются регионом.
Безопасность
Загружайте только с официальных источников, контролируйте адрес сайта, не передавайте пароль третьим лицам и включите 2FA.
Установка занимает несколько минут, после чего доступен весь функционал Melbet.
ทดลองเล่นสล็อต สล็อต PG แพลตฟอร์มเกมสล็อตยอดนิยม ใช้งานง่าย ฝากถอนรวดเร็ว
คำค้นหา สล็อต PG กำลังได้รับความนิยมอย่างต่อเนื่อง ในกลุ่มผู้เล่นเกมสล็อตออนไลน์ เพราะเป็น ค่ายเกมที่มีชื่อเสียง ด้าน งานภาพคุณภาพสูง ความ นิ่งไม่สะดุด และ ระบบจ่ายที่ดึงดูด เกมของ PG ผลิตโดยค่ายมาตรฐาน ที่รองรับการเล่นทั้งบน โทรศัพท์มือถือ และ เดสก์ท็อป
ความโดดเด่น ของ สล็อต PG
PG Slot เป็นเกมสล็อตออนไลน์ที่ออกแบบมาให้ เปิดเกมได้ทันที เล่นผ่าน ระบบอัตโนมัติ และรองรับ ทุกแพลตฟอร์ม ไม่ต้องดาวน์โหลดแอป ผู้เล่นสามารถเข้าเล่นผ่าน Browser ได้ทันที ภาพและเสียงถูกพัฒนาในรูปแบบ เอฟเฟกต์ 3 มิติ ให้ความคมชัด พร้อมเอฟเฟกต์ สวยงาม
คุณสมบัติหลักของเกม pg slot ได้แก่
โบนัสและฟรีสปินหลายแบบ
ระบบตัวคูณ
เล่นฟรีก่อนเติมเงิน
รองรับภาษาไทยเต็มรูปแบบ
ระบบการเงินรวดเร็ว ทันใจ
แพลตฟอร์ม pg slot ส่วนใหญ่รองรับ การฝาก-ถอน ฝากถอนตลอดเวลา ขั้นต่ำเริ่มต้นเพียง 1 บาท ขึ้นอยู่กับ ระบบของผู้ให้บริการ การทำรายการใช้เวลา เพียงไม่กี่วินาที ผ่าน คิวอาร์โค้ด หรือระบบ ธนาคารบนมือถือ ทำให้ธุรกรรมเป็นไปอย่าง ไม่สะดุด
หมวดเกมฮิต ใน pg slot
เกม pg slot มีธีมหลากหลาย เช่น
ธีม เทพเจ้า
ธีม ผจญภัย
ธีม เอเชียและโชคลาภ
ธีม สัตว์และธรรมชาติ
หลายคนชอบเกมที่โบนัสเข้าไว พร้อมระบบ Special Feature และ โอกาสทำกำไรสูง เหมาะกับทั้ง มือใหม่ และ สายสล็อตจริงจัง
มาตรฐานระบบ
PG Slot พัฒนาในระบบสากล มีการ ปกป้องข้อมูลผู้เล่น และใช้ระบบสุ่มผล Random Number Generator เพื่อให้ผลลัพธ์ โปร่งใส แพลตฟอร์มที่ให้บริการ สล็อต PG ควรมี ความปลอดภัยสูง
โดยภาพรวม
PG Slot เป็นตัวเลือกยอดนิยมสำหรับผู้ที่ต้องการเล่นสล็อตออนไลน์ ด้วยจุดเด่นด้าน โบนัสหลากหลาย และการทำธุรกรรมที่ รวดเร็ว ผู้เล่นสามารถเริ่มต้นได้ ทันที ฝากถอนสะดวก และเลือกเกมได้ ครบทุกหมวด เหมาะสำหรับ ผู้เล่นทุกสไตล์ ในโลกของเกมสล็อตออนไลน์
melbet приложение
Скачать приложение Melbet: APK, iPhone и ПК
Мобильная версия Melbet объединяет букмекерскую контору и казино в едином приложении. Доступны live-ставки, слоты, онлайн-трансляции, аналитика и быстрые финансовые операции. Установка занимает несколько минут.
Android (APK)
Скачайте APK с официального источника, откройте файл и завершите установку. Если требуется включите разрешение на установку из неизвестных источников, затем войдите в аккаунт.
iOS (iPhone)
Перейдите в App Store, найдите «Melbet», выберите «Получить», после установки выполните вход.
ПК
Откройте официальный сайт, войдите в личный кабинет и добавьте ярлык на рабочий стол. Веб-версия работает как отдельное приложение.
Функционал
Live-ставки с обновлением коэффициентов, казино и слоты, прямые трансляции, аналитические данные, push-оповещения, регистрация за минуту и поддержка 24/7.
Бонусы
После установки доступны бонус на первый депозит, акционные коды и бесплатные ставки. Правила начисления определяются регионом.
Безопасность
Скачивайте только с официальных источников, проверяйте домен, не сообщайте данные доступа третьим лицам и активируйте двухфакторную аутентификацию.
Установка занимает несколько минут, после чего доступен весь функционал Melbet.
PG Slot แพลตฟอร์มเกมสล็อตยอดนิยม เล่นง่าย ฝากถอนเร็ว
คำค้นหา pg slot ถูกค้นหามากขึ้นเรื่อยๆ ในกลุ่มผู้เล่นเกมสล็อตออนไลน์ เพราะเป็น ค่ายเกมที่มีชื่อเสียง ด้าน ภาพและเอฟเฟกต์ ความ เสถียร และ โอกาสรับกำไรที่ดี เกมของ PG พัฒนาโดยผู้ให้บริการชั้นนำ ที่รองรับการเล่นทั้งบน มือถือ และ พีซี
ข้อดี ของ pg slot
pg slot เป็นเกมสล็อตออนไลน์ที่ออกแบบมาให้ เข้าเกมไว เล่นผ่าน ระบบออนไลน์ และรองรับ ทุกแพลตฟอร์ม เข้าเล่นผ่านเว็บได้เลย ผู้เล่นสามารถเข้าเล่นผ่าน เว็บเบราว์เซอร์ ได้ทันที ภาพและเสียงถูกพัฒนาในรูปแบบ 3D ให้ความคมชัด พร้อมเอฟเฟกต์ จัดเต็ม
คุณสมบัติหลักของเกม PG Slot ได้แก่
โบนัสและฟรีสปินหลายแบบ
ระบบตัวคูณ
เล่นฟรีก่อนเติมเงิน
มีเมนูภาษาไทย
ฝากถอนง่าย ไม่ต้องรอนาน
แพลตฟอร์ม pg slot มักมี การฝาก-ถอน ฝากถอนตลอดเวลา ขั้นต่ำเริ่มต้นเพียง 1 บาท ขึ้นอยู่กับ เงื่อนไขของเว็บไซต์ การทำรายการใช้เวลา รวดเร็วมาก ผ่าน คิวอาร์โค้ด หรือระบบ แอปธนาคาร ทำให้ธุรกรรมเป็นไปอย่าง ลื่นไหล
แนวเกมที่คนเล่นเยอะ ใน pg slot
เกม pg slot มีธีมหลากหลาย เช่น
ธีม เทพเจ้า
ธีม ลุยด่าน
ธีม โชคลาภ
ธีม สัตว์และธรรมชาติ
หลายคนชอบเกมที่โบนัสเข้าไว พร้อมระบบ โบนัสรอบพิเศษ และ อัตราการจ่ายที่สูง เหมาะกับทั้ง มือใหม่ และ ผู้เล่นที่มีประสบการณ์
มาตรฐานระบบ
pg slot ใช้ระบบที่ได้มาตรฐาน มีการ เข้ารหัสข้อมูล และใช้ระบบสุ่มผล Random Number Generator เพื่อให้ผลลัพธ์ ตรวจสอบได้ แพลตฟอร์มที่ให้บริการ สล็อต PG ควรมี ทีมซัพพอร์ต 24 ชม.
โดยภาพรวม
สล็อต PG เป็นตัวเลือกยอดนิยมสำหรับผู้ที่ต้องการเล่นสล็อตออนไลน์ ด้วยจุดเด่นด้าน กราฟิกคุณภาพ และการทำธุรกรรมที่ รวดเร็ว ผู้เล่นสามารถเริ่มต้นได้ ไม่ซับซ้อน ฝากถอนสะดวก และเลือกเกมได้ ครบทุกหมวด เหมาะสำหรับ ทุกระดับประสบการณ์ ในโลกของเกมสล็อตออนไลน์
ทดลองเล่นสล็อต pg
TKBNEKO มอบมิติใหม่ของเกมออนไลน์ ฝาก-ถอนไว ด้วยระบบสแกน QR Code
ในยุคดิจิทัลที่ โลกออนไลน์เติบโตต่อเนื่อง TKBNEKO พร้อมยกระดับการให้บริการ ด้วยระบบที่ ล้ำสมัย รวดเร็ว และ โปร่งใส เพื่อให้ผู้เล่น มั่นใจ ทุกครั้งที่ใช้งาน
จุดเด่นระบบฝาก-ถอน
ฝากขั้นต่ำ: 1 บาท
ถอนขั้นต่ำ: 1 บาท
เวลาฝากเงิน: ภายใน 3 วินาที
ยอดถอน: ไม่มีลิมิต
เติมเงินง่าย แค่สแกน
สแกน QR Code ระบบจะ ประมวลผลอัตโนมัติ ขั้นต่ำ 100 บาท สูงสุด 500,000 บาท
หมวดหมู่เกม
สล็อต: ลุ้นแจ็คพอต
เกมสด: คาสิโนเรียลไทม์
กีฬา: เดิมพันลีกดัง
ยิงปลา: สนุกได้เงินจริง
โปรโมชั่นและสิทธิพิเศษ
ติดตามหน้า โปรโมชั่น พร้อมระบบ VIP และโปรแกรม พันธมิตร
ฝ่ายบริการลูกค้า
สอบถามข้อมูลได้ตลอด 24 ชั่วโมง ผ่านหน้า ติดต่อเรา ทีมงาน TKBNEKO พร้อมดูแลตลอดเวลา
melbet скачать
Установить Melbet: APK, iPhone и ПК
Мобильная версия Melbet объединяет ставки и казино в одном интерфейсе. Доступны live-ставки, казино-игры, онлайн-трансляции, статистика и быстрые финансовые операции. Установка занимает 1–2 минуты.
Android (APK)
Скачайте APK с официального сайта, откройте файл и завершите установку. Если требуется включите доступ к установке сторонних приложений, затем авторизуйтесь.
iOS (iPhone)
Перейдите в App Store, найдите «Melbet», нажмите «Получить», после установки выполните вход.
ПК
Перейдите официальный сайт, войдите в личный кабинет и создайте ярлык на рабочий стол. Веб-версия работает как отдельное приложение.
Функционал
Live-ставки с обновлением коэффициентов, казино и слоты, прямые трансляции, аналитические данные, push-оповещения, регистрация за минуту и поддержка 24/7.
Бонусы
После загрузки доступны приветственный бонус, промокоды и бесплатные ставки. Условия зависят от региона.
Безопасность
Загружайте только с официальных источников, проверяйте домен, не передавайте пароль третьим лицам и активируйте двухфакторную аутентификацию.
Установка занимает несколько минут, после чего доступен весь функционал Melbet.
ทดลองเล่นสล็อต pg ไม่ เด้ง
pg
แพลตฟอร์ม TKBNEKO เปิดประสบการณ์ใหม่แห่งการเดิมพันออนไลน์ ธุรกรรมฉับไว ด้วยระบบสแกน คิวอาร์โค้ด
ในยุคที่ โลกออนไลน์พัฒนาอย่างรวดเร็ว TKBNEKO พร้อมยกระดับมาตรฐานการเดิมพัน ด้วยระบบการให้บริการที่ ล้ำสมัย รวดเร็ว และ ตรวจสอบได้ พร้อมต้อนรับสมาชิกทุกท่านสู่ มิติใหม่แห่งความสนุก ที่ เปิดโอกาสให้ทุกคนสร้างรายได้
เพราะอะไรหลายคนจึงเลือก TKBNEKO
TKBNEKO มุ่งมั่นที่จะมอบประสบการณ์จากเกมลิขสิทธิ์แท้ โดยเฉพาะเกมที่ ผ่านการรับรองจากสถาบันที่น่าเชื่อถือ และ เป็นที่นิยมในระดับสากล เพื่อให้ผู้เล่นทุกคน อุ่นใจ ได้ว่า จะได้รับความเพลิดเพลินกับเกมที่ ยุติธรรม ปลอดภัย และ ตอบโจทย์ผู้เล่นยุคใหม่
ระบบการเงินที่เหนือกว่า
เราออกแบบระบบการเงินให้ง่ายและเร็วที่สุด เพื่อให้คุณ โฟกัสกับความสนุกได้อย่างเต็มที่
ฝากขั้นต่ำ: เพียง 1 บาท
ถอนขั้นต่ำ: 1 บาท
เวลาฝากเงิน: เงินเข้าภายใน 3 วินาที
ยอดจำกัดการถอน: ถอนได้ไม่จำกัดยอด
เติมเงินง่ายด้วย QR Code
เพียงคุณสแกน คิวอาร์ ระบบของเราจะ ดำเนินการฝากเงินให้อัตโนมัติ ขั้นต่ำเพียง 100 บาท และสามารถฝากได้สูงถึง ไม่เกิน 500,000 บาทต่อครั้ง มาร่วมสนุกกันได้แล้ววันนี้ กับ TKBNEKO ที่ เล่นง่าย เดิมพันง่าย ได้เงินไว
คลังเกมคุณภาพ
TKBNEKO รวมเกมสุดฮิตไว้ในที่เดียว รองรับทุกความชอบของผู้เล่น
สล็อต: ธีมมากมาย พร้อมลุ้นรางวัลใหญ่
เกมสด: เล่นสดเหมือนอยู่ในคาสิโนจริง
กีฬา: เดิมพันกับแมตช์การแข่งขันจากทั่วโลก
ยิงปลา: สนุกกับการยิงปลาแบบได้เงิน
รับโบนัสและข้อเสนอสุดคุ้ม
อย่าลืมแวะมาเยี่ยมชมที่หน้า โปรโมชั่น เพื่อรับ โบนัสสุดคุ้ม ที่เรามอบให้สมาชิกทุกท่าน นอกจากนี้ยังมีระบบ VIP สำหรับลูกค้าคนสำคัญ และช่องทาง พาร์ทเนอร์ สำหรับผู้ที่สนใจสร้างรายได้ร่วมกับเรา
ติดต่อเรา
หากมี ปัญหา หรือ ความคิดเห็น สามารถติดต่อทีมงานของเราได้ตลอด 24 ชั่วโมงที่หน้า ติดต่อเรา และ แบบฟอร์มติดต่อ ทีมงาน ของเรา ยินดีให้บริการทุกท่านด้วยใจ
pg slot เกมสล็อตออนไลน์ที่คนค้นหาเยอะ เล่นง่าย ฝากถอนเร็ว
คำค้นหา pg slot มาแรงในช่วงนี้ ในกลุ่มผู้เล่นเกมสล็อตออนไลน์ เพราะเป็น ค่ายเกมที่มีชื่อเสียง ด้าน งานภาพคุณภาพสูง ความ เสถียร และ โอกาสรับกำไรที่ดี เกมของ PG พัฒนาโดยผู้ให้บริการชั้นนำ ที่รองรับการเล่นทั้งบน สมาร์ทโฟน และ พีซี
ความโดดเด่น ของ PG Slot
pg slot เป็นเกมสล็อตออนไลน์ที่ออกแบบมาให้ เปิดเกมได้ทันที เล่นผ่าน ระบบเว็บ และรองรับ ทุกแพลตฟอร์ม เข้าเล่นผ่านเว็บได้เลย ผู้เล่นสามารถเข้าเล่นผ่าน เว็บเบราว์เซอร์ ได้ทันที ภาพและเสียงถูกพัฒนาในรูปแบบ 3D ให้ความคมชัด พร้อมเอฟเฟกต์ สมจริง
คุณสมบัติหลักของเกม สล็อต PG ได้แก่
มีรอบโบนัสให้ลุ้นบ่อย
ระบบตัวคูณ
เดโม่ฟรี
มีเมนูภาษาไทย
ระบบฝากถอนสะดวก ทำรายการไว
แพลตฟอร์ม PG Slot โดยทั่วไปให้บริการ การฝาก-ถอน ฝากถอนตลอดเวลา ขั้นต่ำเริ่มต้นเพียง หลักหน่วย ขึ้นอยู่กับ กติกาแต่ละแพลตฟอร์ม การทำรายการใช้เวลา รวดเร็วมาก ผ่าน QR Code หรือระบบ Mobile Banking ทำให้ธุรกรรมเป็นไปอย่าง ไม่สะดุด
แนวเกมที่คนเล่นเยอะ ใน pg slot
เกม PG Slot มีธีมหลากหลาย เช่น
ธีม เทพเจ้า
ธีม Adventure
ธีม ความมั่งคั่ง
ธีม Animal
เกมยอดนิยมมักเป็นเกมที่แตกง่าย พร้อมระบบ ฟีเจอร์พิเศษ และ โอกาสทำกำไรสูง เหมาะกับทั้ง มือใหม่ และ ผู้เล่นที่มีประสบการณ์
ความน่าเชื่อถือ
pg slot มีมาตรฐานรองรับ มีการ ปกป้องข้อมูลผู้เล่น และใช้ระบบสุ่มผล RNG เพื่อให้ผลลัพธ์ ยุติธรรม แพลตฟอร์มที่ให้บริการ สล็อต PG ควรมี ระบบดูแลข้อมูล
โดยภาพรวม
pg slot เป็นตัวเลือกยอดนิยมสำหรับผู้ที่ต้องการเล่นสล็อตออนไลน์ ด้วยจุดเด่นด้าน กราฟิกคุณภาพ และการทำธุรกรรมที่ ทันใจ ผู้เล่นสามารถเริ่มต้นได้ ง่าย ฝากถอนสะดวก และเลือกเกมได้ หลากหลายแนว เหมาะสำหรับ ทุกระดับประสบการณ์ ในโลกของเกมสล็อตออนไลน์
ทดลองเล่นสล็อต pg ไม่ เด้ง
สล็อต
แพลตฟอร์ม TKBNEKO เปิดประสบการณ์ใหม่แห่งการเดิมพันออนไลน์ ฝาก-ถอนไว ด้วยระบบสแกน QR Code
ในยุคดิจิทัลที่ โลกออนไลน์เติบโตต่อเนื่อง เรามุ่งเน้นมาตรฐานใหม่ของการเดิมพัน ด้วยระบบที่ ล้ำสมัย รวดเร็ว และ โปร่งใส เพื่อให้ผู้เล่น อุ่นใจ ทุกครั้งที่ใช้งาน
ระบบการเงินที่ใช้งานง่าย
ฝากขั้นต่ำ: เริ่มต้น 1 บาท
ถอนขั้นต่ำ: 1 บาท
เวลาฝากเงิน: ใช้เวลาเพียง 3 วินาที
ยอดถอน: ไม่มีลิมิต
ฝากง่าย เพียงสแกน QR Code
สแกน คิวอาร์ ระบบจะ ประมวลผลอัตโนมัติ ขั้นต่ำ 100 บาท สูงสุด ไม่เกิน 500,000 บาทต่อครั้ง
หมวดหมู่เกม
สล็อต: ลุ้นแจ็คพอต
เกมสด: ดีลเลอร์สด
กีฬา: แมตช์ทั่วโลก
ยิงปลา: สนุกได้เงินจริง
โบนัสและโปรโมชัน
ติดตามหน้า โบนัส พร้อมระบบ สมาชิกพรีเมียม และโปรแกรม พันธมิตร
ติดต่อเรา
สอบถามข้อมูลได้ตลอด 24 ชั่วโมง ผ่านหน้า ติดต่อเรา ทีมงาน TKBNEKO พร้อมดูแลตลอดเวลา
สล็อต PG สล็อตยอดฮิต เล่นง่าย ฝากถอนเร็ว
คำค้นหา pg slot กำลังได้รับความนิยมอย่างต่อเนื่อง ในกลุ่มผู้เล่นเกมสล็อตออนไลน์ เพราะเป็น ค่ายเกมที่มีชื่อเสียง ด้าน กราฟิก ความ เสถียร และ โอกาสรับกำไรที่ดี เกมของ PG พัฒนาโดยผู้ให้บริการชั้นนำ ที่รองรับการเล่นทั้งบน โทรศัพท์มือถือ และ เดสก์ท็อป
จุดเด่น ของ pg slot
สล็อต PG เป็นเกมสล็อตออนไลน์ที่ออกแบบมาให้ โหลดเร็ว เล่นผ่าน ระบบเว็บ และรองรับ ทั้ง iOS และ Android ไม่ต้องดาวน์โหลดแอป ผู้เล่นสามารถเข้าเล่นผ่าน Browser ได้ทันที ภาพและเสียงถูกพัฒนาในรูปแบบ เอฟเฟกต์ 3 มิติ ให้ความคมชัด พร้อมเอฟเฟกต์ สวยงาม
คุณสมบัติหลักของเกม PG Slot ได้แก่
ระบบโบนัสและฟรีสปินหลากหลายรูปแบบ
Multiplier
เล่นฟรีก่อนเติมเงิน
รองรับภาษาไทยเต็มรูปแบบ
ระบบฝากถอนสะดวก ทำรายการไว
แพลตฟอร์ม pg slot ส่วนใหญ่รองรับ การฝาก-ถอน ฝากถอนตลอดเวลา ขั้นต่ำเริ่มต้นเพียง 1 บาท ขึ้นอยู่กับ เงื่อนไขของเว็บไซต์ การทำรายการใช้เวลา ไม่กี่วินาที ผ่าน QR Code หรือระบบ ธนาคารบนมือถือ ทำให้ธุรกรรมเป็นไปอย่าง ต่อเนื่อง
แนวเกมที่คนเล่นเยอะ ใน PG Slot
เกม สล็อต PG มีธีมหลากหลาย เช่น
ธีม เทพเจ้า
ธีม ลุยด่าน
ธีม ความมั่งคั่ง
ธีม ธรรมชาติ
เกมยอดนิยมมักเป็นเกมที่แตกง่าย พร้อมระบบ Special Feature และ อัตราการจ่ายที่สูง เหมาะกับทั้ง คนเพิ่งเล่น และ สายสล็อตจริงจัง
ความน่าเชื่อถือ
PG Slot ใช้ระบบที่ได้มาตรฐาน มีการ รักษาความปลอดภัย และใช้ระบบสุ่มผล RNG เพื่อให้ผลลัพธ์ ยุติธรรม แพลตฟอร์มที่ให้บริการ สล็อต PG ควรมี ความปลอดภัยสูง
บทสรุปท้ายบท
PG Slot เป็นตัวเลือกยอดนิยมสำหรับผู้ที่ต้องการเล่นสล็อตออนไลน์ ด้วยจุดเด่นด้าน โบนัสหลากหลาย และการทำธุรกรรมที่ รวดเร็ว ผู้เล่นสามารถเริ่มต้นได้ ทันที ฝากถอนสะดวก และเลือกเกมได้ จำนวนมาก เหมาะสำหรับ ทั้งมือใหม่และมือโปร ในโลกของเกมสล็อตออนไลน์
https://medium.com/@ratypw/ทดลองเล่นสล็อต-pg-70cdb1132344
ทดลองเล่นสล็อต pg ฟรี สล็อต PG สล็อตยอดฮิต เข้าเล่นไว ฝากถอนออโต้
คำค้นหา PG Slot ถูกค้นหามากขึ้นเรื่อยๆ ในกลุ่มผู้เล่นเกมสล็อตออนไลน์ เพราะเป็น แบรนด์เกมที่โดดเด่น ด้าน กราฟิก ความ ลื่นไหล และ โอกาสรับกำไรที่ดี เกมของ PG ผลิตโดยค่ายมาตรฐาน ที่รองรับการเล่นทั้งบน สมาร์ทโฟน และ เดสก์ท็อป
ข้อดี ของ pg slot
pg slot เป็นเกมสล็อตออนไลน์ที่ออกแบบมาให้ เข้าเกมไว เล่นผ่าน ระบบอัตโนมัติ และรองรับ ทุกแพลตฟอร์ม เข้าเล่นผ่านเว็บได้เลย ผู้เล่นสามารถเข้าเล่นผ่าน หน้าเว็บ ได้ทันที ภาพและเสียงถูกพัฒนาในรูปแบบ 3D ให้ความคมชัด พร้อมเอฟเฟกต์ สมจริง
คุณสมบัติหลักของเกม PG Slot ได้แก่
ระบบโบนัสและฟรีสปินหลากหลายรูปแบบ
Multiplier
เล่นฟรีก่อนเติมเงิน
รองรับภาษาไทยเต็มรูปแบบ
ระบบการเงินรวดเร็ว ทำรายการไว
แพลตฟอร์ม PG Slot โดยทั่วไปให้บริการ การฝาก-ถอน อัตโนมัติ 24 ชั่วโมง ขั้นต่ำเริ่มต้นเพียง หลักหน่วย ขึ้นอยู่กับ เงื่อนไขของเว็บไซต์ การทำรายการใช้เวลา รวดเร็วมาก ผ่าน QR Code หรือระบบ แอปธนาคาร ทำให้ธุรกรรมเป็นไปอย่าง ไม่สะดุด
ประเภทเกมยอดนิยม ใน PG Slot
เกม PG Slot มีธีมหลากหลาย เช่น
ธีม แฟนตาซี
ธีม Adventure
ธีม เอเชียและโชคลาภ
ธีม ธรรมชาติ
ผู้เล่นนิยมเกมที่มีรอบพิเศษบ่อย พร้อมระบบ Special Feature และ ระบบจ่ายคุ้มค่า เหมาะกับทั้ง ผู้เล่นเริ่มต้น และ สายสล็อตจริงจัง
ความปลอดภัย
สล็อต PG มีมาตรฐานรองรับ มีการ เข้ารหัสข้อมูล และใช้ระบบสุ่มผล Random Number Generator เพื่อให้ผลลัพธ์ ยุติธรรม แพลตฟอร์มที่ให้บริการ pg slot ควรมี ระบบดูแลข้อมูล
บทสรุปท้ายบท
pg slot เป็นตัวเลือกยอดนิยมสำหรับผู้ที่ต้องการเล่นสล็อตออนไลน์ ด้วยจุดเด่นด้าน ระบบลื่นไหล และการทำธุรกรรมที่ ไว ผู้เล่นสามารถเริ่มต้นได้ ทันที ฝากถอนสะดวก และเลือกเกมได้ หลากหลายแนว เหมาะสำหรับ ทุกระดับประสบการณ์ ในโลกของเกมสล็อตออนไลน์
PG Slot สล็อตยอดฮิต เล่นง่าย ฝากถอนเร็ว
คำค้นหา PG Slot มาแรงในช่วงนี้ ในกลุ่มผู้เล่นเกมสล็อตออนไลน์ เพราะเป็น ค่ายเกมที่มีชื่อเสียง ด้าน ภาพและเอฟเฟกต์ ความ ลื่นไหล และ อัตราการจ่ายรางวัลที่น่าสนใจ เกมของ PG ออกแบบโดยทีมงานมืออาชีพ ที่รองรับการเล่นทั้งบน สมาร์ทโฟน และ เดสก์ท็อป
ความโดดเด่น ของ สล็อต PG
pg slot เป็นเกมสล็อตออนไลน์ที่ออกแบบมาให้ เปิดเกมได้ทันที เล่นผ่าน ระบบเว็บ และรองรับ ทั้ง iOS และ Android เข้าเล่นผ่านเว็บได้เลย ผู้เล่นสามารถเข้าเล่นผ่าน Browser ได้ทันที ภาพและเสียงถูกพัฒนาในรูปแบบ สามมิติ ให้ความคมชัด พร้อมเอฟเฟกต์ สวยงาม
คุณสมบัติหลักของเกม pg slot ได้แก่
ระบบโบนัสและฟรีสปินหลากหลายรูปแบบ
ฟีเจอร์ตัวคูณรางวัล
โหมดทดลองเล่นฟรี
รองรับภาษาไทยเต็มรูปแบบ
ฝากถอนง่าย ทันใจ
แพลตฟอร์ม PG Slot ส่วนใหญ่รองรับ การฝาก-ถอน อัตโนมัติ 24 ชั่วโมง ขั้นต่ำเริ่มต้นเพียง 1 บาท ขึ้นอยู่กับ ระบบของผู้ให้บริการ การทำรายการใช้เวลา ไม่กี่วินาที ผ่าน QR Code หรือระบบ แอปธนาคาร ทำให้ธุรกรรมเป็นไปอย่าง ลื่นไหล
แนวเกมที่คนเล่นเยอะ ใน PG Slot
เกม pg slot มีธีมหลากหลาย เช่น
ธีม เทพเจ้า
ธีม Adventure
ธีม เอเชียและโชคลาภ
ธีม สัตว์และธรรมชาติ
ผู้เล่นนิยมเกมที่มีรอบพิเศษบ่อย พร้อมระบบ โบนัสรอบพิเศษ และ โอกาสทำกำไรสูง เหมาะกับทั้ง มือใหม่ และ สายสล็อตจริงจัง
ความน่าเชื่อถือ
pg slot มีมาตรฐานรองรับ มีการ เข้ารหัสข้อมูล และใช้ระบบสุ่มผล ระบบสุ่มมาตรฐาน เพื่อให้ผลลัพธ์ โปร่งใส แพลตฟอร์มที่ให้บริการ สล็อต PG ควรมี ระบบดูแลข้อมูล
โดยภาพรวม
pg slot เป็นตัวเลือกยอดนิยมสำหรับผู้ที่ต้องการเล่นสล็อตออนไลน์ ด้วยจุดเด่นด้าน ระบบลื่นไหล และการทำธุรกรรมที่ รวดเร็ว ผู้เล่นสามารถเริ่มต้นได้ ไม่ซับซ้อน ฝากถอนสะดวก และเลือกเกมได้ ครบทุกหมวด เหมาะสำหรับ ทุกระดับประสบการณ์ ในโลกของเกมสล็อตออนไลน์
ทดลองเล่นสล็อต pg ไม่ เด้ง
แพลตฟอร์ม TKBNEKO พาคุณสู่โลกใหม่ของเกมเดิมพันออนไลน์ ระบบการเงินรวดเร็ว ด้วยระบบสแกน QR Code
ในยุคที่ เทคโนโลยีเปลี่ยนวิถีการเดิมพันออนไลน์ไปอย่างสิ้นเชิง TKBNEKO เข้ามาสร้างมาตรฐานใหม่ให้กับวงการ ด้วยระบบการให้บริการที่ ทันสมัย เสถียร และ โปร่งใส พร้อมต้อนรับสมาชิกทุกท่านสู่ โลกแห่งเกมที่เหนือกว่าเดิม ที่ ใครๆ ก็เป็นเถ้าแก่ได้
เพราะอะไรหลายคนจึงเลือก TKBNEKO
TKBNEKO มุ่งมั่นที่จะมอบประสบการณ์จากเกมลิขสิทธิ์แท้ โดยเฉพาะเกมที่ ได้รับการตรวจสอบจากองค์กรสากล และ ได้รับการยอมรับมากที่สุดในอุตสาหกรรม เพื่อให้ผู้เล่นทุกคน อุ่นใจ ได้ว่า จะได้รับความเพลิดเพลินกับเกมที่ ยุติธรรม มีระบบรักษาความปลอดภัยสูง และ ได้มาตรฐานระดับสากล
จุดเด่นของระบบฝาก-ถอน
ระบบฝากถอนถูกพัฒนาให้ใช้งานง่าย เพื่อให้คุณ เล่นเกมได้แบบไม่สะดุด
ฝากขั้นต่ำ: เพียง 1 บาท
ถอนขั้นต่ำ: 1 บาท
เวลาฝากเงิน: รวดเร็วทันใจใน 3 วินาที
ยอดจำกัดการถอน: ไม่มีลิมิตการถอนรายวัน
เติมเงินง่ายด้วย QR Code
เพียงคุณสแกน โค้ดคิวอาร์ ระบบของเราจะ ดำเนินการฝากเงินให้อัตโนมัติ ขั้นต่ำเพียง เริ่มต้น 100 บาท และสามารถฝากได้สูงถึง สูงสุด 500,000 บาท เข้าร่วมความสนุกได้เลย กับ TKBNEKO ที่ ใช้งานง่าย ทำกำไรได้รวดเร็ว
คลังเกมคุณภาพ
แพลตฟอร์มของเราครอบคลุมทุกแนวเกม รองรับทุกความชอบของผู้เล่น
สล็อต: แจ็คพอตแตกง่าย ลุ้นได้ทุกวัน
เกมสด: เล่นสดเหมือนอยู่ในคาสิโนจริง
กีฬา: เดิมพันกับแมตช์การแข่งขันจากทั่วโลก
ยิงปลา: เกมยิงปลาสุดมันส์ ได้เงินจริง
รับโบนัสและข้อเสนอสุดคุ้ม
อย่าลืมแวะมาเยี่ยมชมที่หน้า โบนัส เพื่อรับ สิทธิพิเศษมากมาย ที่เรามอบให้สมาชิกทุกท่าน นอกจากนี้ยังมีระบบ ลูกค้าระดับพรีเมียม สำหรับลูกค้าคนสำคัญ และช่องทาง พาร์ทเนอร์ สำหรับผู้ที่สนใจสร้างรายได้ร่วมกับเรา
ช่องทางติดต่อ
หากมี ข้อสงสัย หรือ ความคิดเห็น สามารถติดต่อทีมงานของเราได้ตลอด 24 ชั่วโมงที่หน้า ฝ่ายสนับสนุน และ ส่งความคิดเห็น ทีมงาน ของเรา ยินดีให้บริการทุกท่านด้วยใจ
ทดลองเล่นสล็อต pg ไม่ เด้ง
สล็อต
แพลตฟอร์ม TKBNEKO เปิดประสบการณ์ใหม่แห่งการเดิมพันออนไลน์ ธุรกรรมรวดเร็ว ด้วยระบบสแกน คิวอาร์โค้ด
ในยุคดิจิทัลที่ เทคโนโลยีพัฒนาอย่างรวดเร็ว TKBNEKO พร้อมยกระดับการให้บริการ ด้วยระบบที่ ทันสมัย เสถียร และ โปร่งใส เพื่อให้ผู้เล่น อุ่นใจ ทุกครั้งที่ใช้งาน
จุดเด่นระบบฝาก-ถอน
ฝากขั้นต่ำ: 1 บาท
ถอนขั้นต่ำ: ขั้นต่ำ 1 บาท
เวลาฝากเงิน: ใช้เวลาเพียง 3 วินาที
ยอดถอน: ไม่จำกัดต่อวัน
เติมเงินง่าย แค่สแกน
สแกน คิวอาร์ ระบบจะ โอนเงินเข้าทันที ขั้นต่ำ เริ่ม 100 บาท สูงสุด 500,000 บาท
หมวดหมู่เกม
สล็อต: ธีมหลากหลาย
เกมสด: ดีลเลอร์สด
กีฬา: เดิมพันลีกดัง
ยิงปลา: ลุ้นกำไรทันที
โปรโมชั่นและสิทธิพิเศษ
ติดตามหน้า โปรโมชั่น พร้อมระบบ สมาชิกพรีเมียม และโปรแกรม พันธมิตร
ฝ่ายบริการลูกค้า
สอบถามข้อมูลได้ตลอด 24 ชั่วโมง ผ่านหน้า ศูนย์ช่วยเหลือ ทีมงาน TKBNEKO พร้อมดูแลตลอดเวลา
ทดลองเล่นสล็อต pg เว็บ ตรง”
สล็อต PG สล็อตยอดฮิต เข้าเล่นไว ฝากถอนออโต้
คำค้นหา PG Slot มาแรงในช่วงนี้ ในกลุ่มผู้เล่นเกมสล็อตออนไลน์ เพราะเป็น แบรนด์เกมที่โดดเด่น ด้าน งานภาพคุณภาพสูง ความ เสถียร และ อัตราการจ่ายรางวัลที่น่าสนใจ เกมของ PG พัฒนาโดยผู้ให้บริการชั้นนำ ที่รองรับการเล่นทั้งบน มือถือ และ เดสก์ท็อป
ข้อดี ของ pg slot
สล็อต PG เป็นเกมสล็อตออนไลน์ที่ออกแบบมาให้ โหลดเร็ว เล่นผ่าน ระบบอัตโนมัติ และรองรับ ทุกอุปกรณ์ ไม่ต้องดาวน์โหลดแอป ผู้เล่นสามารถเข้าเล่นผ่าน Browser ได้ทันที ภาพและเสียงถูกพัฒนาในรูปแบบ เอฟเฟกต์ 3 มิติ ให้ความคมชัด พร้อมเอฟเฟกต์ สมจริง
คุณสมบัติหลักของเกม สล็อต PG ได้แก่
มีรอบโบนัสให้ลุ้นบ่อย
Multiplier
โหมดทดลองเล่นฟรี
รองรับภาษาไทยเต็มรูปแบบ
ฝากถอนง่าย ทันใจ
แพลตฟอร์ม สล็อต PG ส่วนใหญ่รองรับ การฝาก-ถอน อัตโนมัติ 24 ชั่วโมง ขั้นต่ำเริ่มต้นเพียง 1 บาท ขึ้นอยู่กับ เงื่อนไขของเว็บไซต์ การทำรายการใช้เวลา เพียงไม่กี่วินาที ผ่าน คิวอาร์โค้ด หรือระบบ Mobile Banking ทำให้ธุรกรรมเป็นไปอย่าง ลื่นไหล
หมวดเกมฮิต ใน PG Slot
เกม สล็อต PG มีธีมหลากหลาย เช่น
ธีม แฟนตาซี
ธีม Adventure
ธีม เอเชียและโชคลาภ
ธีม Animal
ผู้เล่นนิยมเกมที่มีรอบพิเศษบ่อย พร้อมระบบ โบนัสรอบพิเศษ และ โอกาสทำกำไรสูง เหมาะกับทั้ง คนเพิ่งเล่น และ ผู้เล่นที่มีประสบการณ์
ความน่าเชื่อถือ
PG Slot มีมาตรฐานรองรับ มีการ รักษาความปลอดภัย และใช้ระบบสุ่มผล ระบบสุ่มมาตรฐาน เพื่อให้ผลลัพธ์ ตรวจสอบได้ แพลตฟอร์มที่ให้บริการ pg slot ควรมี ระบบดูแลข้อมูล
โดยภาพรวม
pg slot เป็นตัวเลือกยอดนิยมสำหรับผู้ที่ต้องการเล่นสล็อตออนไลน์ ด้วยจุดเด่นด้าน ระบบลื่นไหล และการทำธุรกรรมที่ ทันใจ ผู้เล่นสามารถเริ่มต้นได้ ทันที ฝากถอนสะดวก และเลือกเกมได้ จำนวนมาก เหมาะสำหรับ ทุกระดับประสบการณ์ ในโลกของเกมสล็อตออนไลน์
Автозайм
Займ под залог ПТС в городе Самара — представляет собой возможность взять финансирование под авто без продажи автомобиля и без длительных банковских процедур. Ключевая характеристика автозайма — машина продолжает оставаться у собственника, а в залог оформляется лишь ПТС. Это даёт возможность использовать транспортом, пока действует договор займа.
Выдача денег возможна в день подачи заявки. Заявка рассматривается примерно за 15 мин, после чего принимается ответ по сумме и условиям. Сумма финансирования может достигать до 5 000 000 ?, а процентная ставка стартует с уровня 2% в месяц. Срок займа обычно достигает до 60 месяцев, поэтому заёмщик может подобрать подходящий план платежей.
Процесс оформления заявки работает онлайн. Заёмщик заполняет форму, указывает данные автомобиля и необходимую сумму. После проверки данных выносится начальное одобрение. Чаще всего деньги переводятся в день оформления, когда оформляется договор займа.
Для расчёта условий применяется калькулятор займа. К примеру, если взять 300 000 ? на срок 12 мес. платёж в месяц будет примерно 33 057 ?. Общая сумма переплаты по такому займу составит примерно 96 684 ?. Конечные условия могут изменяться в зависимости стоимости автомобиля и установленного срока займа.
На сайтах автозаймов нередко показывается онлайн-лента заявок. Этот блок демонстрирует активность системы и примеры обработанных заявок из разных городов. К примеру, заявки на сумму 1 840 000 ? из Тулы, 1 890 000 ? из Москвы или 1 470 000 ? из Челябинска получают статус «Одобрено». Некоторые заявок могут находиться в стадии проверки — например такие суммы, 290 000 ? город Сочи или 720 000 ? город Екатеринбург. Такие блоки отображают текущую активность платформы и число заявок за день и за месяц.
Займ с залогом ПТС подходит тем, кому требуется оперативно получить крупную сумму без продажи автомобиля. Основные условия таких займов — ставка от 2% в месяц, одобрение примерно 15 минут, сумма до 5 000 000 ? и вариант подать заявку онлайн. После отправки формы заёмщик может дождаться решения, связаться через мессенджер или связаться с менеджером для уточнения оформления.
PG Slot แพลตฟอร์มเกมสล็อตยอดนิยม เข้าเล่นไว ฝากถอนออโต้
คำค้นหา สล็อต PG กำลังได้รับความนิยมอย่างต่อเนื่อง ในกลุ่มผู้เล่นเกมสล็อตออนไลน์ เพราะเป็น ผู้ให้บริการเกมสล็อตที่มาแรง ด้าน กราฟิก ความ เสถียร และ อัตราการจ่ายรางวัลที่น่าสนใจ เกมของ PG พัฒนาโดยผู้ให้บริการชั้นนำ ที่รองรับการเล่นทั้งบน สมาร์ทโฟน และ พีซี
ข้อดี ของ pg slot
สล็อต PG เป็นเกมสล็อตออนไลน์ที่ออกแบบมาให้ เปิดเกมได้ทันที เล่นผ่าน ระบบออนไลน์ และรองรับ ทุกอุปกรณ์ ไม่ต้องติดตั้งเพิ่มเติม ผู้เล่นสามารถเข้าเล่นผ่าน Browser ได้ทันที ภาพและเสียงถูกพัฒนาในรูปแบบ เอฟเฟกต์ 3 มิติ ให้ความคมชัด พร้อมเอฟเฟกต์ สมจริง
คุณสมบัติหลักของเกม PG Slot ได้แก่
มีรอบโบนัสให้ลุ้นบ่อย
ระบบตัวคูณ
เดโม่ฟรี
รองรับภาษาไทยเต็มรูปแบบ
ฝากถอนง่าย ทันใจ
แพลตฟอร์ม สล็อต PG มักมี การฝาก-ถอน ฝากถอนตลอดเวลา ขั้นต่ำเริ่มต้นเพียง 10 บาท ขึ้นอยู่กับ ระบบของผู้ให้บริการ การทำรายการใช้เวลา เพียงไม่กี่วินาที ผ่าน คิวอาร์โค้ด หรือระบบ ธนาคารบนมือถือ ทำให้ธุรกรรมเป็นไปอย่าง ต่อเนื่อง
ประเภทเกมยอดนิยม ใน PG Slot
เกม pg slot มีธีมหลากหลาย เช่น
ธีม เทพเจ้า
ธีม ลุยด่าน
ธีม เอเชียและโชคลาภ
ธีม สัตว์และธรรมชาติ
ผู้เล่นนิยมเกมที่มีรอบพิเศษบ่อย พร้อมระบบ โบนัสรอบพิเศษ และ อัตราการจ่ายที่สูง เหมาะกับทั้ง มือใหม่ และ สายสล็อตจริงจัง
มาตรฐานระบบ
PG Slot พัฒนาในระบบสากล มีการ รักษาความปลอดภัย และใช้ระบบสุ่มผล ระบบสุ่มมาตรฐาน เพื่อให้ผลลัพธ์ ตรวจสอบได้ แพลตฟอร์มที่ให้บริการ สล็อต PG ควรมี ทีมซัพพอร์ต 24 ชม.
บทสรุปท้ายบท
สล็อต PG เป็นตัวเลือกยอดนิยมสำหรับผู้ที่ต้องการเล่นสล็อตออนไลน์ ด้วยจุดเด่นด้าน กราฟิกคุณภาพ และการทำธุรกรรมที่ ไว ผู้เล่นสามารถเริ่มต้นได้ ไม่ซับซ้อน ฝากถอนสะดวก และเลือกเกมได้ หลากหลายแนว เหมาะสำหรับ ผู้เล่นทุกสไตล์ ในโลกของเกมสล็อตออนไลน์
https://medium.com/@ratypw/ทดลองเล่นสล็อต-pg-70cdb1132344
ทดลองเล่นสล็อต pg ไม่ เด้ง
Автозайм
Кредит под обеспечение ПТС в городе Самара — это способ взять средства под авто без необходимости продавать автомобиля и без долгих банковских процедур. Главная особенность автозайма — транспорт остаётся у владельца, а в залог оформляется только ПТС. Такой формат даёт возможность использовать транспортом, на протяжении договор займа.
Выдача средств происходит в день обращения. Заявка обрабатывается примерно за 15 мин, затем выносится ответ по сумме и условиям. Сумма займа может достигать до 5 000 000 ?, а ставка стартует с уровня 2% в месяц. Срок займа как правило достигает до 60 месяцев, по этой причине клиент выбирает подходящий график выплат.
Процесс оформления заявки доступна через интернет. Клиент заполняет форму, указывает информацию об авто и желаемую сумму займа. После анализа данных приходит предварительное одобрение. Чаще всего средства переводятся в день оформления, когда оформляется договор.
Для расчёта условий применяется онлайн-калькулятор. К примеру, если взять 300 000 ? на срок 12 месяцев платёж в месяц составит около 33 057 ?. Общая переплата по такому займу будет около 96 684 ?. Конечные параметры могут изменяться в зависимости от стоимости автомобиля и выбранного срока займа.
На сайтах автозаймов нередко отображается лента заявок. Этот блок демонстрирует активность сервиса и образцы обработанных заявок из разных городов. Например, запросы на сумму 1 840 000 ? из Тулы, 1 890 000 ? город Москва или 1 470 000 ? из Челябинска получают метку «Одобрено». Часть обращений находятся на этапе проверки — например, 290 000 ? из Сочи или 720 000 ? город Екатеринбург. Подобные разделы отображают текущий поток платформы и число заявок сегодня и за месяц.
Автозайм с залогом ПТС может подойти людям, кому нужно быстро получить значительную сумму без продажи автомобиля. Основные условия таких займов — процент начиная от 2% в месяц, одобрение примерно 15 минут, сумма до 5 000 000 ? и возможность оформить заявку через интернет. После подачи заявки заёмщик может дождаться решения, связаться через мессенджер или обратиться к менеджеру для уточнения деталей оформления.
ทดลองเล่นสล็อต pg ฟรี pg slot เกมสล็อตออนไลน์ที่คนค้นหาเยอะ เข้าเล่นไว ฝากถอนออโต้
คำค้นหา pg slot กำลังได้รับความนิยมอย่างต่อเนื่อง ในกลุ่มผู้เล่นเกมสล็อตออนไลน์ เพราะเป็น แบรนด์เกมที่โดดเด่น ด้าน ภาพและเอฟเฟกต์ ความ นิ่งไม่สะดุด และ โอกาสรับกำไรที่ดี เกมของ PG พัฒนาโดยผู้ให้บริการชั้นนำ ที่รองรับการเล่นทั้งบน โทรศัพท์มือถือ และ พีซี
ข้อดี ของ สล็อต PG
pg slot เป็นเกมสล็อตออนไลน์ที่ออกแบบมาให้ โหลดเร็ว เล่นผ่าน ระบบอัตโนมัติ และรองรับ ทุกอุปกรณ์ เข้าเล่นผ่านเว็บได้เลย ผู้เล่นสามารถเข้าเล่นผ่าน เว็บเบราว์เซอร์ ได้ทันที ภาพและเสียงถูกพัฒนาในรูปแบบ สามมิติ ให้ความคมชัด พร้อมเอฟเฟกต์ สวยงาม
คุณสมบัติหลักของเกม pg slot ได้แก่
โบนัสและฟรีสปินหลายแบบ
ระบบตัวคูณ
เล่นฟรีก่อนเติมเงิน
มีเมนูภาษาไทย
ฝากถอนง่าย ทันใจ
แพลตฟอร์ม PG Slot มักมี การฝาก-ถอน ฝากถอนตลอดเวลา ขั้นต่ำเริ่มต้นเพียง 10 บาท ขึ้นอยู่กับ ระบบของผู้ให้บริการ การทำรายการใช้เวลา ไม่กี่วินาที ผ่าน สแกน QR หรือระบบ ธนาคารบนมือถือ ทำให้ธุรกรรมเป็นไปอย่าง ลื่นไหล
ประเภทเกมยอดนิยม ใน PG Slot
เกม PG Slot มีธีมหลากหลาย เช่น
ธีม เทพเจ้าและแฟนตาซี
ธีม Adventure
ธีม โชคลาภ
ธีม ธรรมชาติ
เกมยอดนิยมมักเป็นเกมที่แตกง่าย พร้อมระบบ โบนัสรอบพิเศษ และ ระบบจ่ายคุ้มค่า เหมาะกับทั้ง คนเพิ่งเล่น และ ผู้เล่นมือโปร
มาตรฐานระบบ
PG Slot ใช้ระบบที่ได้มาตรฐาน มีการ เข้ารหัสข้อมูล และใช้ระบบสุ่มผล ระบบสุ่มมาตรฐาน เพื่อให้ผลลัพธ์ ยุติธรรม แพลตฟอร์มที่ให้บริการ pg slot ควรมี ระบบดูแลข้อมูล
บทสรุปท้ายบท
pg slot เป็นตัวเลือกยอดนิยมสำหรับผู้ที่ต้องการเล่นสล็อตออนไลน์ ด้วยจุดเด่นด้าน โบนัสหลากหลาย และการทำธุรกรรมที่ รวดเร็ว ผู้เล่นสามารถเริ่มต้นได้ ง่าย ฝากถอนสะดวก และเลือกเกมได้ หลากหลายแนว เหมาะสำหรับ ทุกระดับประสบการณ์ ในโลกของเกมสล็อตออนไลน์
rufus Rufus is a compact, free, open source utility designed to make bootable USB drives. It is used to prepare a USB flash drive that can set up an operating system, launch diagnostic tools, or boot into a recovery environment. The program does not require installation and can be run immediately after downloading.
The main function of Rufus is to create bootable USB media from ISO images with speed and stability. This allows users to install or run operating systems directly from a USB flash drive without the need for DVDs. The tool supports a wide range of operating systems and service utilities, which makes it useful for both regular users and system administrators.
Rufus runs on computers with Microsoft Windows, starting from Windows 7. Both 32-bit and 64-bit versions are supported, and there is also a version available for ARM64 architecture.
The software allows users to create bootable USB drives from many different ISO images. It can be used to prepare a USB drive for installing Windows 11, Windows 10, Windows 8.1, or Windows 7, as well as various Linux distributions. Rufus also works with DOS systems and other recovery or maintenance tools commonly used for troubleshooting computers.
One of the built-in features of Rufus is the ability to download official Windows ISO images directly from Microsoft servers. This allows users to obtain original installation images for Windows 8.1, Windows 10, and Windows 11 without searching for them on third-party websites.
In addition to creating bootable drives, Rufus can format USB devices. It supports several file systems including FAT32, NTFS, exFAT, UDF, and ReFS. This flexibility allows the USB drive to be prepared for different use cases and compatibility requirements.
Rufus supports both legacy BIOS systems and modern UEFI environments. Because of this, bootable drives created with Rufus can work on older computers as well as newer systems that use UEFI and Secure Boot.
Another feature included in Rufus is Windows To Go support. This option allows users to run a full Windows environment directly from a USB drive. It can be useful for testing systems, performing maintenance, or working on multiple computers without installing Windows on the internal drive.
Rufus also provides the option to bypass certain Windows 11 installation requirements. When creating an installation USB, the program can disable checks for TPM 2.0, Secure Boot, and minimum RAM requirements. This makes it possible to install Windows 11 on computers that would otherwise not meet the official hardware requirements.
One of the reasons Rufus has become popular is its speed and simplicity. The program is extremely small, about 1.9 MB in size, and runs as a portable application without installation. It is distributed under the GPL v3 open-source license, supports more than 70 languages, and contains no advertisements, bundled software, or tracking components.
Rufus works with a large number of ISO images. These include multiple versions of Windows, Windows Server editions, FreeDOS, and various system tools such as GParted, Hiren’s Boot CD, Parted Magic, and Clonezilla. Because of this wide compatibility, the program can be used not only for installing operating systems but also for disk management, data recovery, and system maintenance tasks.
To use Rufus, a computer running Windows 7 or later and a USB flash drive are required. The program does not need to be installed. Users simply download the executable file, run it, select the ISO image they want to use, and create a bootable USB drive. Due to its simplicity, speed, and reliability, Rufus remains one of the most widely used tools for creating bootable USB drives.
สล็อต PG สล็อตยอดฮิต เล่นง่าย ฝากถอนเร็ว
คำค้นหา PG Slot มาแรงในช่วงนี้ ในกลุ่มผู้เล่นเกมสล็อตออนไลน์ เพราะเป็น ค่ายเกมที่มีชื่อเสียง ด้าน ภาพและเอฟเฟกต์ ความ เสถียร และ อัตราการจ่ายรางวัลที่น่าสนใจ เกมของ PG ผลิตโดยค่ายมาตรฐาน ที่รองรับการเล่นทั้งบน สมาร์ทโฟน และ พีซี
ความโดดเด่น ของ สล็อต PG
pg slot เป็นเกมสล็อตออนไลน์ที่ออกแบบมาให้ โหลดเร็ว เล่นผ่าน ระบบเว็บ และรองรับ ทั้ง iOS และ Android ไม่ต้องติดตั้งเพิ่มเติม ผู้เล่นสามารถเข้าเล่นผ่าน หน้าเว็บ ได้ทันที ภาพและเสียงถูกพัฒนาในรูปแบบ เอฟเฟกต์ 3 มิติ ให้ความคมชัด พร้อมเอฟเฟกต์ จัดเต็ม
คุณสมบัติหลักของเกม สล็อต PG ได้แก่
โบนัสและฟรีสปินหลายแบบ
ฟีเจอร์ตัวคูณรางวัล
เดโม่ฟรี
รองรับภาษาไทยเต็มรูปแบบ
ระบบฝากถอนสะดวก ไม่ต้องรอนาน
แพลตฟอร์ม สล็อต PG ส่วนใหญ่รองรับ การฝาก-ถอน อัตโนมัติ 24 ชั่วโมง ขั้นต่ำเริ่มต้นเพียง 1 บาท ขึ้นอยู่กับ ระบบของผู้ให้บริการ การทำรายการใช้เวลา ไม่กี่วินาที ผ่าน สแกน QR หรือระบบ ธนาคารบนมือถือ ทำให้ธุรกรรมเป็นไปอย่าง ต่อเนื่อง
ประเภทเกมยอดนิยม ใน pg slot
เกม pg slot มีธีมหลากหลาย เช่น
ธีม แฟนตาซี
ธีม ผจญภัย
ธีม ความมั่งคั่ง
ธีม Animal
หลายคนชอบเกมที่โบนัสเข้าไว พร้อมระบบ ฟีเจอร์พิเศษ และ โอกาสทำกำไรสูง เหมาะกับทั้ง มือใหม่ และ ผู้เล่นมือโปร
มาตรฐานระบบ
pg slot พัฒนาในระบบสากล มีการ รักษาความปลอดภัย และใช้ระบบสุ่มผล Random Number Generator เพื่อให้ผลลัพธ์ ตรวจสอบได้ แพลตฟอร์มที่ให้บริการ pg slot ควรมี ความปลอดภัยสูง
โดยภาพรวม
สล็อต PG เป็นตัวเลือกยอดนิยมสำหรับผู้ที่ต้องการเล่นสล็อตออนไลน์ ด้วยจุดเด่นด้าน กราฟิกคุณภาพ และการทำธุรกรรมที่ ทันใจ ผู้เล่นสามารถเริ่มต้นได้ ไม่ซับซ้อน ฝากถอนสะดวก และเลือกเกมได้ หลากหลายแนว เหมาะสำหรับ ผู้เล่นทุกสไตล์ ในโลกของเกมสล็อตออนไลน์
ทดลองเล่นสล็อต pg ไม่ เด้ง
ทดลองเล่นสล็อต pg ไม่ เด้ง
мелбет зеркало вход с мобильного
Скачать приложение Melbet: APK, iOS и ПК
Мобильная версия Melbet включает ставки и казино в одном интерфейсе. Пользователю доступны live-ставки, слоты, прямые трансляции, аналитика и операции по счёту. Загрузка занимает несколько минут.
Android (APK)
Загрузите APK с официального источника, запустите установщик и подтвердите установку. Если требуется включите разрешение на установку из неизвестных источников, затем войдите в аккаунт.
iOS (iPhone)
Откройте App Store, введите в поиске «Melbet», выберите «Получить», после установки выполните вход.
ПК
Откройте официальный сайт, авторизуйтесь и создайте ярлык на рабочий стол. Веб-версия работает как полноценное приложение.
Функционал
Live-ставки с мгновенным обновлением линии, игровой раздел с тысячами игр, просмотр матчей, аналитические данные, push-оповещения, быстрая регистрация и круглосуточная служба поддержки.
Бонусы
После установки доступны приветственный бонус, акционные коды и фрибеты. Правила начисления определяются регионом.
Безопасность
Загружайте только с официальных источников, проверяйте домен, не передавайте пароль третьим лицам и включите 2FA.
Загрузка выполняется быстро, после чего открывается полный доступ Melbet.
промокод в мелбет
Установить приложение Melbet: Android, iOS и компьютер
Мобильная версия Melbet включает букмекерскую контору и казино в одном интерфейсе. Доступны live-ставки, казино-игры, прямые трансляции, аналитика и быстрые финансовые операции. Установка занимает несколько минут.
Android (APK)
Загрузите APK с официального сайта, откройте файл и завершите установку. Если требуется включите разрешение на установку из неизвестных источников, затем авторизуйтесь.
iOS (iPhone)
Перейдите в App Store, найдите «Melbet», нажмите «Получить», после установки авторизуйтесь в системе.
ПК
Откройте официальный сайт, войдите в личный кабинет и добавьте ярлык на рабочий стол. Веб-версия работает как отдельное приложение.
Функционал
Live-ставки с обновлением коэффициентов, игровой раздел с тысячами игр, просмотр матчей, подробная статистика, push-оповещения, регистрация за минуту и поддержка 24/7.
Бонусы
После установки доступны бонус на первый депозит, промокоды и фрибеты. Условия зависят от региона.
Безопасность
Загружайте только с официального сайта, проверяйте домен, не сообщайте данные доступа третьим лицам и включите 2FA.
Установка занимает несколько минут, после чего открывается полный доступ Melbet.
bidik88
melbet приложение для ios
Установить приложение Melbet: Android, iPhone и компьютер
Приложение Melbet включает ставки и казино в едином приложении. Доступны live-ставки, казино-игры, прямые трансляции, аналитика и быстрые финансовые операции. Установка занимает 1–2 минуты.
Android (APK)
Загрузите APK с официального источника, откройте файл и завершите установку. Если требуется включите разрешение на установку из неизвестных источников, затем войдите в аккаунт.
iOS (iPhone)
Откройте App Store, введите в поиске «Melbet», нажмите «Получить», после установки авторизуйтесь в системе.
ПК
Перейдите официальный сайт, войдите в личный кабинет и создайте ярлык на рабочий стол. Браузерная версия функционирует как полноценное приложение.
Функционал
Live-ставки с мгновенным обновлением линии, игровой раздел с тысячами игр, просмотр матчей, аналитические данные, push-оповещения, регистрация за минуту и круглосуточная служба поддержки.
Бонусы
После установки доступны приветственный бонус, промокоды и бесплатные ставки. Правила начисления определяются регионом.
Безопасность
Скачивайте только с официального сайта, проверяйте домен, не передавайте пароль третьим лицам и включите 2FA.
Загрузка выполняется быстро, после чего открывается полный доступ Melbet.
heaps o wins
* super fast loading times
* clean interface easy to navigate
* works perfect on phone
* no annoying popups everywhere
http://dailyplaza.co.kr/bbs/board.php?bo_table=1302&wr_id=195214
леон зеркало скачать
joycasino официальный сайт
Tried it but honestly still on the fence about the whole thing, seems ok so far but gonna give it more time before I make up my mind ya know? 777bet hasnt dissapointed me yet but I’m not exactly jumping for joy either.
рейтинг лучших казино
Read about it on some blog and decided to try ipl live 2026 and basically im still using it. figured some of you might be intrested
sapporo88 login
Hello i want share with you about three card rummy site is very good for me. I play many times and cards game is fun and not difficult for understand. Interface is nice, colors is good, and easy to use for everyone even if you no speak english so good like me. I reccomend to all my friends already.
?Levantemos nuestros brindis por cada arquitecto de su propio destino!
–
?Que la fortuna avance contigo con regalos vibrantes del destino rondas emocionantes !