
YEREVAN (CoinChapter.com) – The previous week was mostly red for the crypto market, with some digital assets losing double digits. However, the bearish bias was not ubiquitous after all. Thus, here is a list of cryptocurrency prices for today.
Binance (BNB)
Binance coin (BNB) traded at $400 in Tuesday’s European session. The digital asset held on to a significant support trendline but hinted at an upcoming correction. BNB/USD registered a death cross between the 100-day exponential moving average (EMA-100) and the EMA-200.
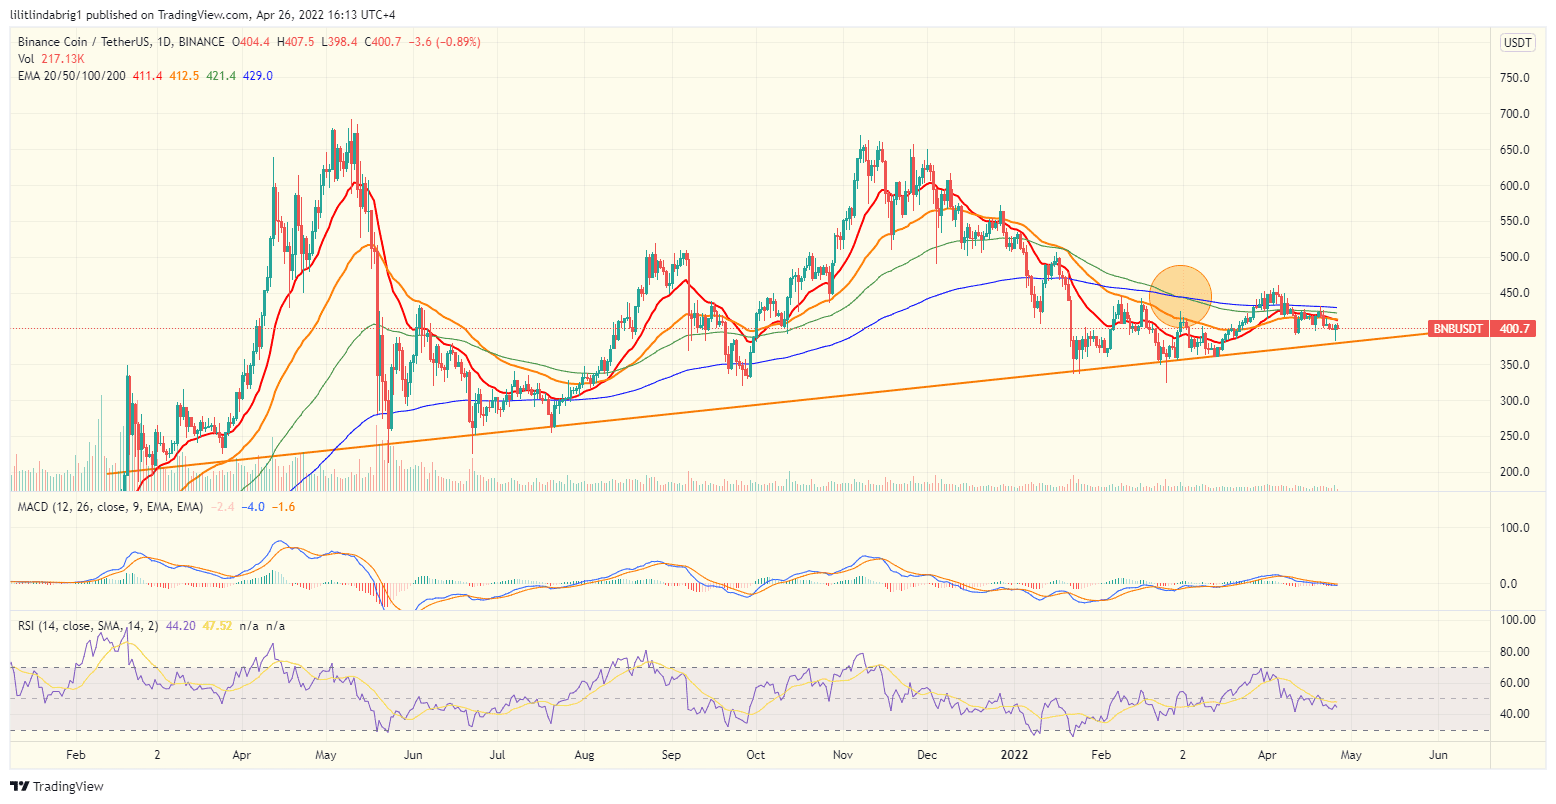
The formation forecasts a bearish continuation until the shorter-term MA manages a reversal. Moreover, the trading volumes have been declining for the previous week, which supports the bearish claim.
Dogecoin (DOGE)
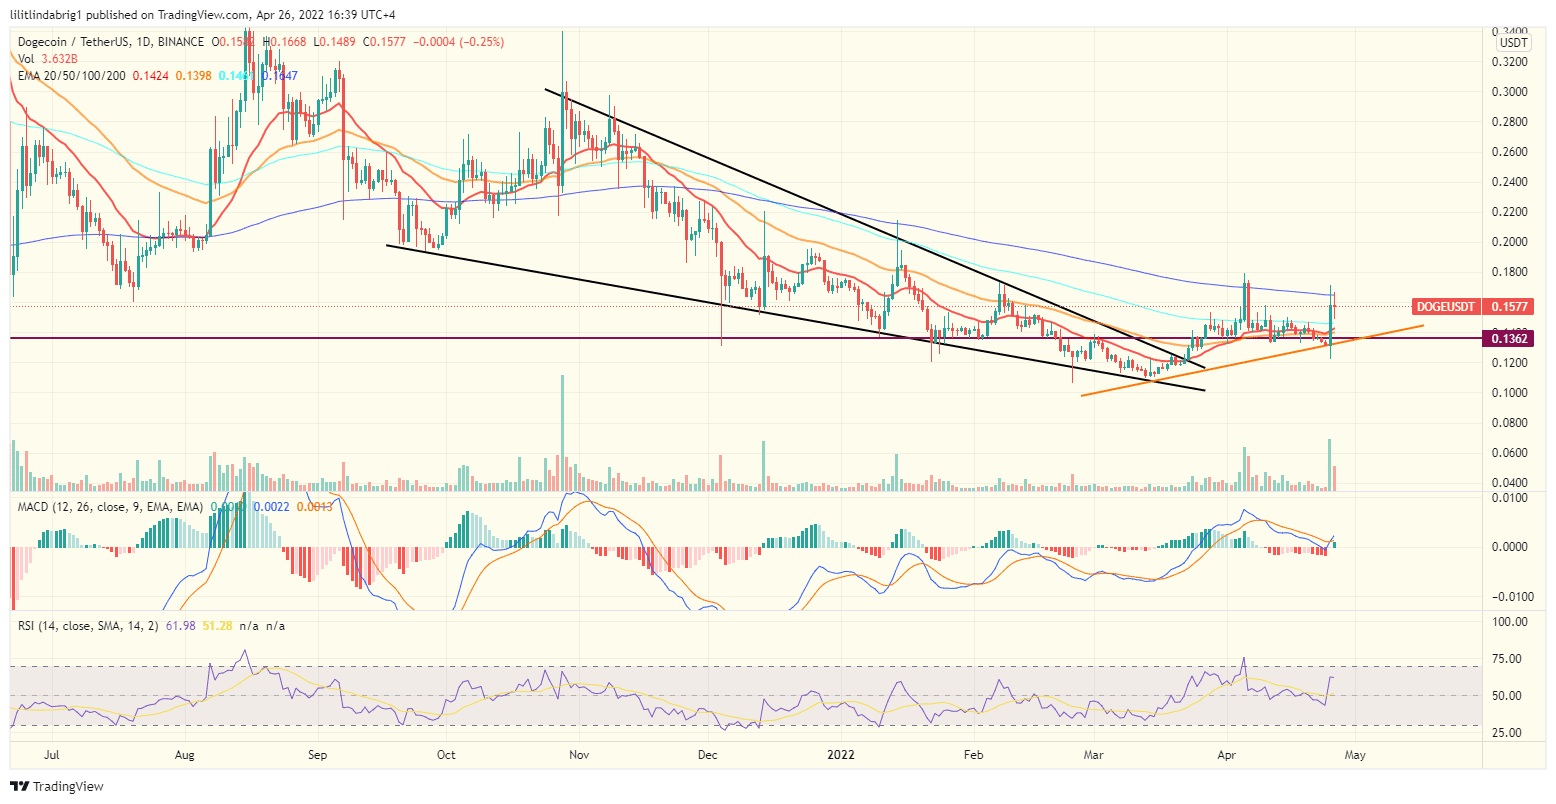
Father of all things meme coin, on the other hand, excited from Elon Musk’s Twitter takeover, jumped 30% in two days and traded at $0.16 on Apr. 26. The upside move reversed the looming Death Crosses and bearish trend-based oscillators. However, the price action retested the EMA-200 as resistance, and the trading volumes on Apr. 26 were lower than the previous day.
Solana (SOL)
Ethereum rival Solana (SOL) traded just below $98 on Apr. 26, after a week of sideways consolidation. However, it could face a decline in the upcoming sessions, towards a support trendline that has been significant for the digital asset since Jul. 2021. If so, SOL could lose nearly 10% within the week.

Furthermore, the Solana death cross between the EMA-20 and EMA-50 supported the bearish claim, along with the dropping trading volumes, and the bearish trend-based oscillators.
Kyber Network (KNC)
Kyber Network’s KNC token defied the bleeding crypto market and scored three-digit value gains quarter-to-date. Moreover, the KNC/USD exchange rate rose over 11% in the previous 24 hours and stood at $5.5 hours before Tuesday’s New York session.
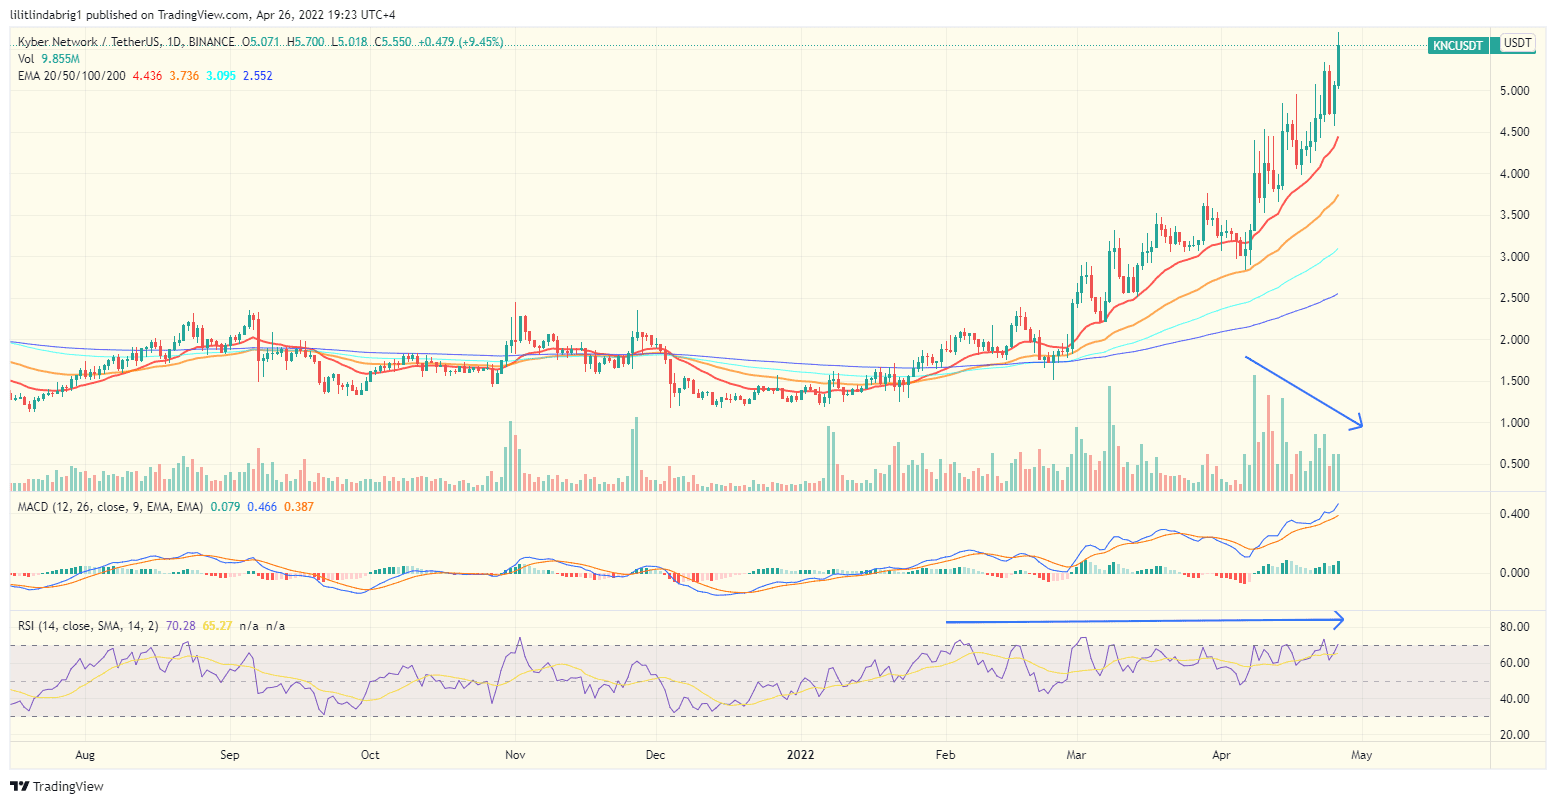
However, despite the explosive rally, technicals point to a correction. The trading volumes have been declining in the previous week, which could signal insufficient persistence from the KNC bulls. Moreover, the highs on the RSI graph came up to a flat resistance, while the price action printed higher highs.
Terra (LUNA)
Much like the rest of the crypto market, LUNA’s daily chart did not inspire much confidence despite the 28% weekly upside move. The digital asset faced the same challenges that have been listed in this review. The trading volumes lacked forcefulness, and the trend-based oscillators were neutral at best.

Zcash (ZEC)
The bearish technicals of privacy protocol ZCash (ZEC), unlike the previous entries on the list, were more noticeable on the weekly chart. The price action stood at $158 and formed a setup dubbed the Falling Triangle, which could lead to a drastic drop after the formation is exhausted.
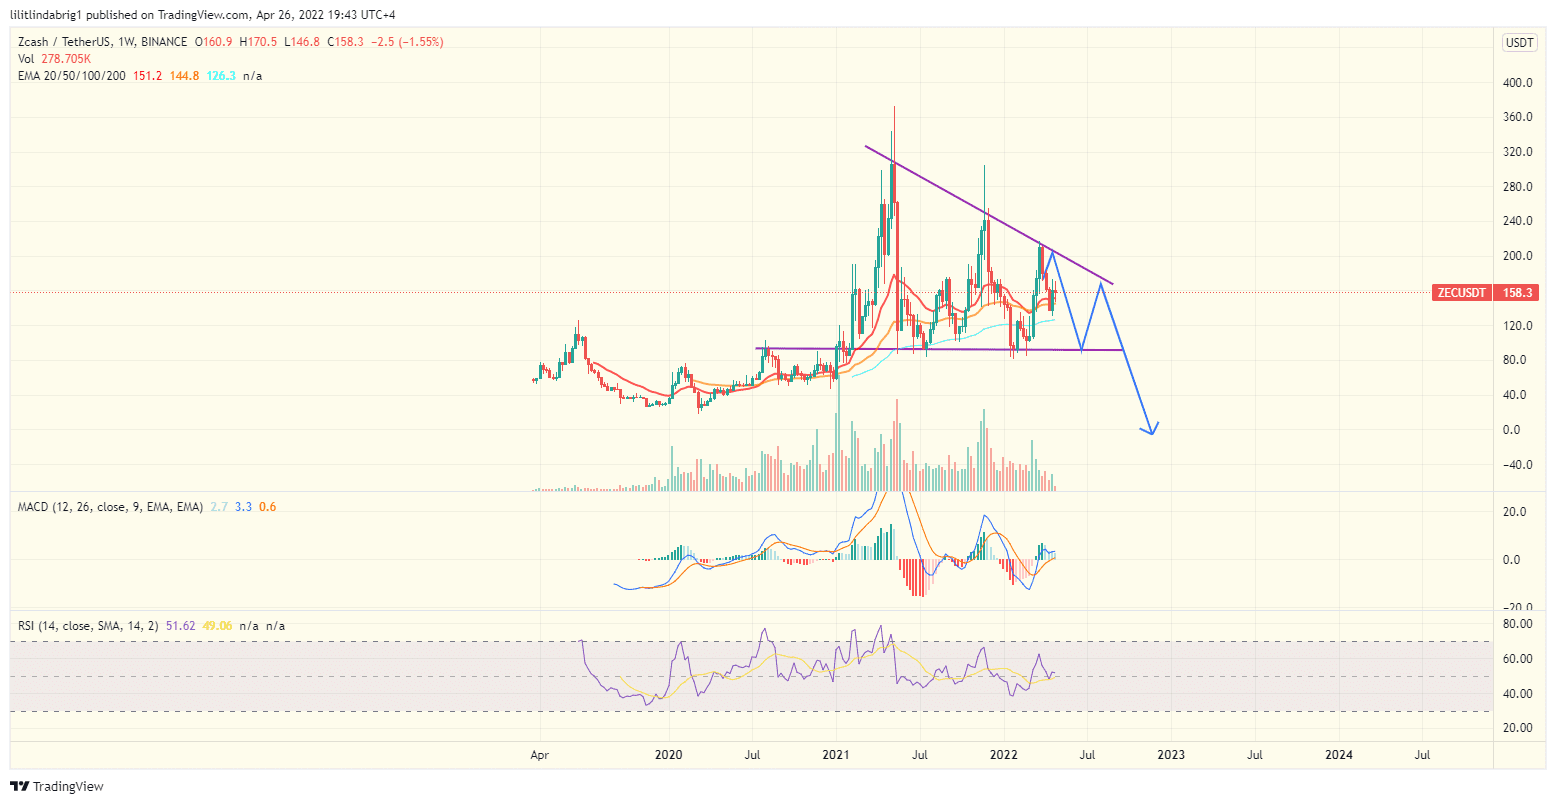
ZEC retested the setup’s resistance in late March and headed toward the support, which would constitute a further 40% price drop for the digital asset.
Algorand (ALGO)
Algorand (ALGO) consolidated sideways in the previous week and traded at $0.66 on Apr. 26. The token arrived at critical support, and as of publication, held on to it. However, like many others assets in the crypto sector, ALGO flashed bearish warnings, hinting at a further decline.


… [Trackback]
[…] Info on that Topic: coinchapter.com/cryptocurrency-prices-today-binance-bnb-solana-sol-dogecoin-doge-kyber-network-knc-terra-luna-zcash-zec-algorand-algo/ […]
… [Trackback]
[…] Find More Information here on that Topic: coinchapter.com/cryptocurrency-prices-today-binance-bnb-solana-sol-dogecoin-doge-kyber-network-knc-terra-luna-zcash-zec-algorand-algo/ […]