

Dent (DENT) and VeChain (VET) Goes All Risky on Traders; A Technical Outlook

Yerevan (CoinChapter.com) — Dent’s DENT and VeChain’s VET are among the biggest gains in the alternative cryptocurrency market, beating even its top rival Bitcoin as they continue rallying into 2021.
In retrospect, the year-to-date returns for both the tokens are humongous. The DENT/USD exchange rate surged more than 6,000 percent this year, according to Messari, a data analytics and aggregator service. The same portal shows the VET/USD exchange rate up by 857 percent.
CoinChapter analyzes both the alternative cryptocurrencies (or altcoins) for what they hold for their investors in the sessions ahead.
Dent Technical Analysis
DENT/USD appears to be trading lower in a Falling Wedge pattern.
According to data collected from TradingView.com, the pair has been forming a sequence of lower highs and lower lows ever since it formed a local top at $0.022. Falling Wedges are typically bullish reversal patterns that prompt the asset in concern to pursue an upside breakout. In turn, the bullish move comes mostly when the two descending trendlines forming the Wedge converges or approaches the said state.
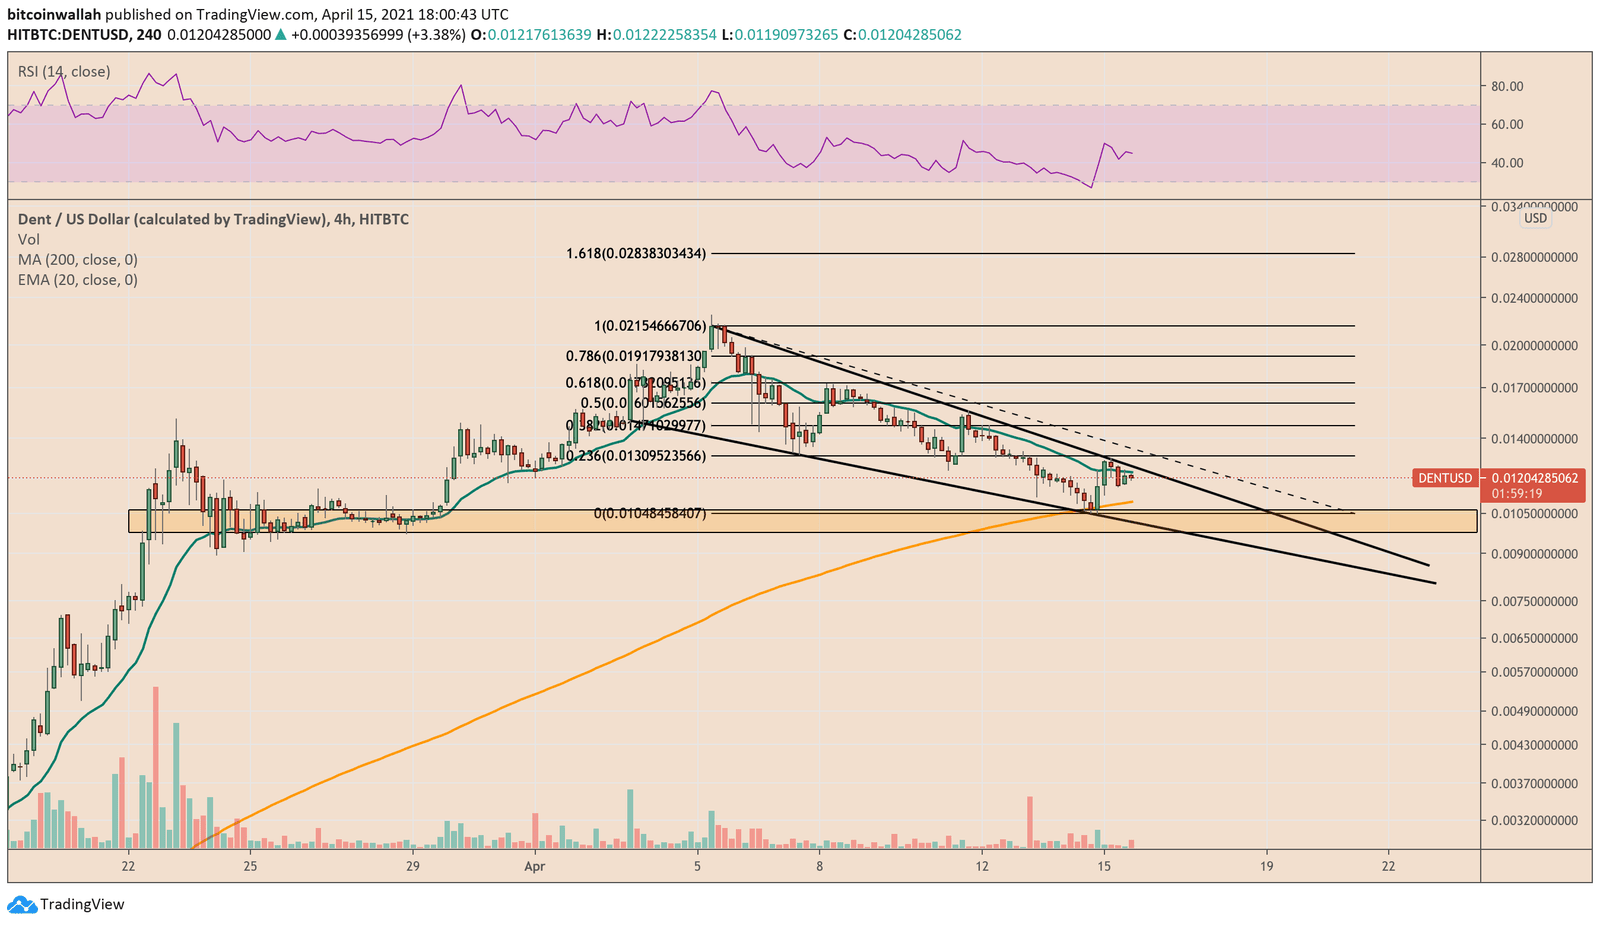
Applying a Fibonacci retracement graph on the Falling Wedge pattern reveals potential entry/exit points for traders. Without dwelling into the long-term outlook, the interim sentiment looks to be focused on the downside. DENT has just tested its local resistance level of $0.013, which raises its likelihood of testing 0.0104 as local support.
The 0.0104-level falls inside the support range that prompted DENT to rise to its 2021 top of $0.022. That, coupled with the 200-4H simple moving average (the orange wave), provides an additional price floor to the Dent token. Bulls could use the range as their cue to enter a long position towards the Wedge’s upper trendline — the resistance, with their eyes on the local support of $0.013 as the primary upside target.
But on an immediate basis, DENT appears to be in the court of bears. Its path of least resistance is to the downside, meaning traders could open a short position towards the support confluence to earn near-term profits. Conversely, a breakout above the Wedge upper trendline could push DENT towards $0.019 — the 78.6 percent Fib level.
VeChain Technical Analysis
VeChain maintains its bullish bias but faces the prospect of continuing its ongoing downside rejections towards its short-term parabolic support. Incidentally, the 20-4H exponential moving average (the green wave) and a previous price floor near $0.161 provide additional support to the VET/USD exchange rate.
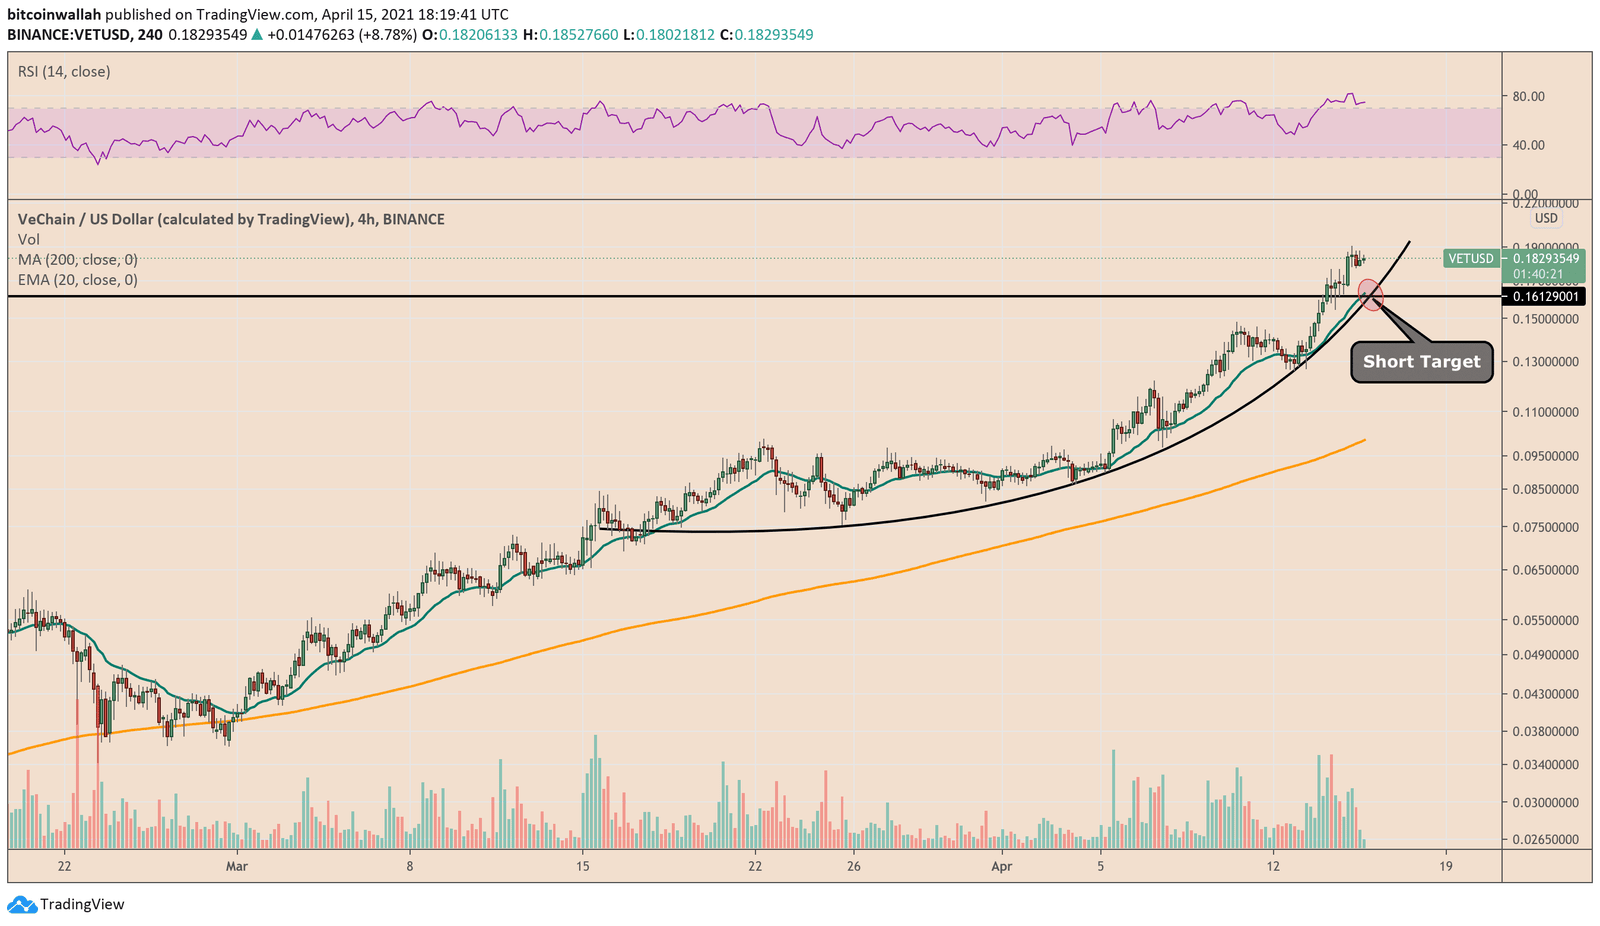
VET is trading near its all-time high. Therefore, it is difficult to assume where it heads next to the upside. Meanwhile, a correction looks more definite as a confluence of supports await near $0.161. Bears could target the said level to earn short-term profits off their short targets.
Photo by Loic Leray on Unsplash

… [Trackback]
[…] Find More on to that Topic: coinchapter.com/dent-dent-and-vechain-vet-goes-all-risky-on-traders-a-technical-outlook/ […]
… [Trackback]
[…] Read More to that Topic: coinchapter.com/dent-dent-and-vechain-vet-goes-all-risky-on-traders-a-technical-outlook/ […]
… [Trackback]
[…] Find More Information here on that Topic: coinchapter.com/dent-dent-and-vechain-vet-goes-all-risky-on-traders-a-technical-outlook/ […]
… [Trackback]
[…] Find More Information here on that Topic: coinchapter.com/dent-dent-and-vechain-vet-goes-all-risky-on-traders-a-technical-outlook/ […]
… [Trackback]
[…] Information to that Topic: coinchapter.com/dent-dent-and-vechain-vet-goes-all-risky-on-traders-a-technical-outlook/ […]
… [Trackback]
[…] Find More on that Topic: coinchapter.com/dent-dent-and-vechain-vet-goes-all-risky-on-traders-a-technical-outlook/ […]
… [Trackback]
[…] There you will find 89369 additional Information on that Topic: coinchapter.com/dent-dent-and-vechain-vet-goes-all-risky-on-traders-a-technical-outlook/ […]