

Dogecoin’s (DOGE), the meme-inspired cryptocurrency that has defied expectations, price may be on the precipice of a price correction. Technical chart analysis suggests that Dogecoin’s price could crash, with an imminent potential price decline of up to 50%. This sobering forecast for Dogecoin holders comes as key indicators flash warning signs of an overheated market.

Dogecoin (DOGE) exhibits a strong market presence, with a recent 8.13% increase to $0.185 and a market cap hitting $26.57 billion. Trading volume spiked 38.97%, reaching $3.09 billion, highlighting significant investor activity. Currently ranked 8th by market cap, Dogecoin’s price stands at $0.19, aligning closely with its fully diluted valuation of $26.631 billion.
Dogecoin Price Could Crash: Overbought Territory Beckons a Correction
The weekly Relative Strength Index (RSI) for Dogecoin indicates an overbought scenario. Traditionally, an RSI above 70 signals that an asset might be overvalued, and a price correction could follow. Dogecoin’s RSI lingering around 77.71 points to increased selling pressure in the near future. This technical analysis tool has historically served as a reliable gauge for potential downturns.
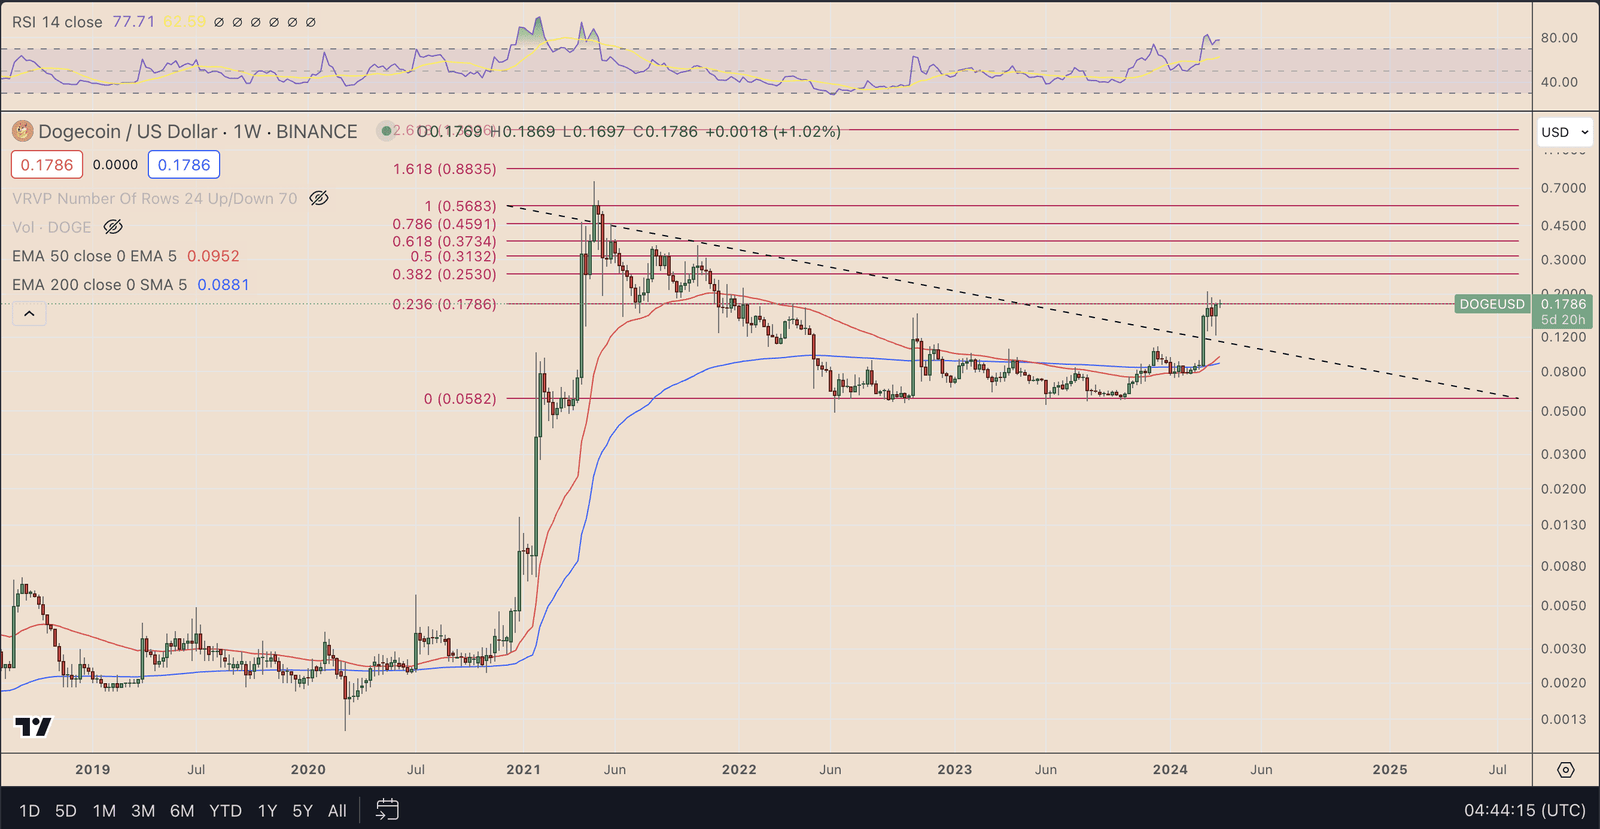
Another key factor contributing to the bearish outlook is the 0.236 Fibonacci retracement level derived from the November 2021-May 2022 trading range. This crucial resistance zone, currently situated at approximately $0.1786, has historically acted as a formidable barrier to Dogecoin’s price. Should the cryptocurrency fail to breach this level decisively, it could spark a selloff, potentially retracing towards the $0.0582 support level.
Golden Cross Decline: A Historical Harbinger
Customarily, the emergence of a Golden Cross, where the 50-day Exponential Moving Average (EMA) crosses above the 200-day EMA, can be a bullish signal. However, in Dogecoin’s case, following such a crossover, historically the price has often experienced a decline. This indicates that Dogecoin’s price could crash. This pattern raises concerns that the current position of the EMAs may not herald the uptrend many investors hope for.
In addition, with a current price of $0.17975, Dogecoin’s market capitalization stands at a hefty $25.8 billion. The trading volume over the last 24 hours was approximately $256.7 million, showcasing the coin’s liquidity and active trading community. Notably, with a circulating supply of over 141 billion DOGE, the currency’s future hinges on market sentiment and technical cues.
In summary, Dogecoin’s community remains hopeful. However, the technical indicators — overbought RSI, persistent resistance at the 0.236 Fibonacci line, and the pattern following a Golden Cross — all hint at a potential 50% price crash for Dogecoin. Investors should keep a keen eye on these indicators to navigate the volatile waters of cryptocurrency markets.

… [Trackback]
[…] Find More Information here on that Topic: coinchapter.com/dogecoin-price-could-crash-50-3-reasons-why/ […]
… [Trackback]
[…] There you can find 44996 additional Info to that Topic: coinchapter.com/dogecoin-price-could-crash-50-3-reasons-why/ […]
… [Trackback]
[…] Read More on to that Topic: coinchapter.com/dogecoin-price-could-crash-50-3-reasons-why/ […]
… [Trackback]
[…] Find More Info here to that Topic: coinchapter.com/dogecoin-price-could-crash-50-3-reasons-why/ […]