

PATNA (CoinChapter.com) — The crypto market’s Jan bull run stuttered on Jan 19, but tokens like HBAR, OCEAN, DATA, and ENJ refused to end their up-only run early. ENJ, DATA, and OCEAN’s bull run helped the crypto token prices confirm bullish patterns, while HBAR spiked over 67% from Jan 1’s low of $0.036.
The break in the crypto market’s rally likely stemmed from news of an “international cryptocurrency enforcement action” announcement by the US Department of Justice. The news prompted speculation of action against a major crypto exchange or firm, creating a FUD.
However, the action turned out to be against a little-known crypto exchange Bitzlato. The exchange is based in Hong Kong and allegedly has ties with Russia. Furthermore, the crypto market drew bearish cues from news of cryptocurrency firm Genesis getting set to file for bankruptcy.
Before the sudden halt in the crypto market’s rally, Bitcoin (BTC) price seemed poised to break its Nov 2013 record of 15 consecutive days of positive price action. The wider crypto market also responded positively, with Ethereum (ETH) price moving above $1,500.
1. HBAR Price Rally Continues, But Momentum Might Be Turning Bearish
Hedera Hashgraph’s native token HBAR price spiked more than 67% to form a daily high near $0.0604 on Jan 18. The crypto token seems set to paint its best monthly gains since Mar 2021. However, long upper wicks on the crypto token’s daily candles indicate sellers are actively booking profits.
Bears pared HBAR’s gains on Jan 18, but the Hedera crypto price jumped 12.2% on Jan 19 to reach $0.059 before correcting. Moreover, the momentum oscillator MACD might hint at bearish momentum for HBAR price.

Positive bars on the indicator’s histogram are contracting, indicating that the MACD line (difference between 12-day and 26-day EMA) is moving towards the MACD signal line (9-day EMA of MACD). When the MACD line moves below the signal line, it will form a bearish crossover.
A continued sell-off forcing the MACD to form a bearish crossover might result in HBAR price dropping to test support near $0.052. Failure of immediate support might see the Hedera Hashgraph crypto price fall to support from its 50-day EMA (purple wave) near $0.0473 before recovering.
Also Read: Joe Biden does it again- His Administration will allocate another $2.5B in military aid to Ukraine On the other hand, if HBAR continues to attract buyers to the market, the crypto token might rise to resistance near $0.06. A break and hold above immediate resistance might help HBAR price challenge resistance from its 200-day EMA (green wave) near $0.069 before downside corrections pare gains.
2. ENJ Price Confirms Bullish Pattern, But Overbought RSI Risks Persist
On Jan 13, Enjin Coin (ENJ) price confirmed a bullish pattern called the falling wedge. In detail, the technical pattern forms when the price fluctuates inside a pair of falling trendlines that would converge down the slope. The outcome of such downside patterns is typically a price breakout to the upside.
One key feature of the pattern is that volumes usually decline as the trendlines converge.
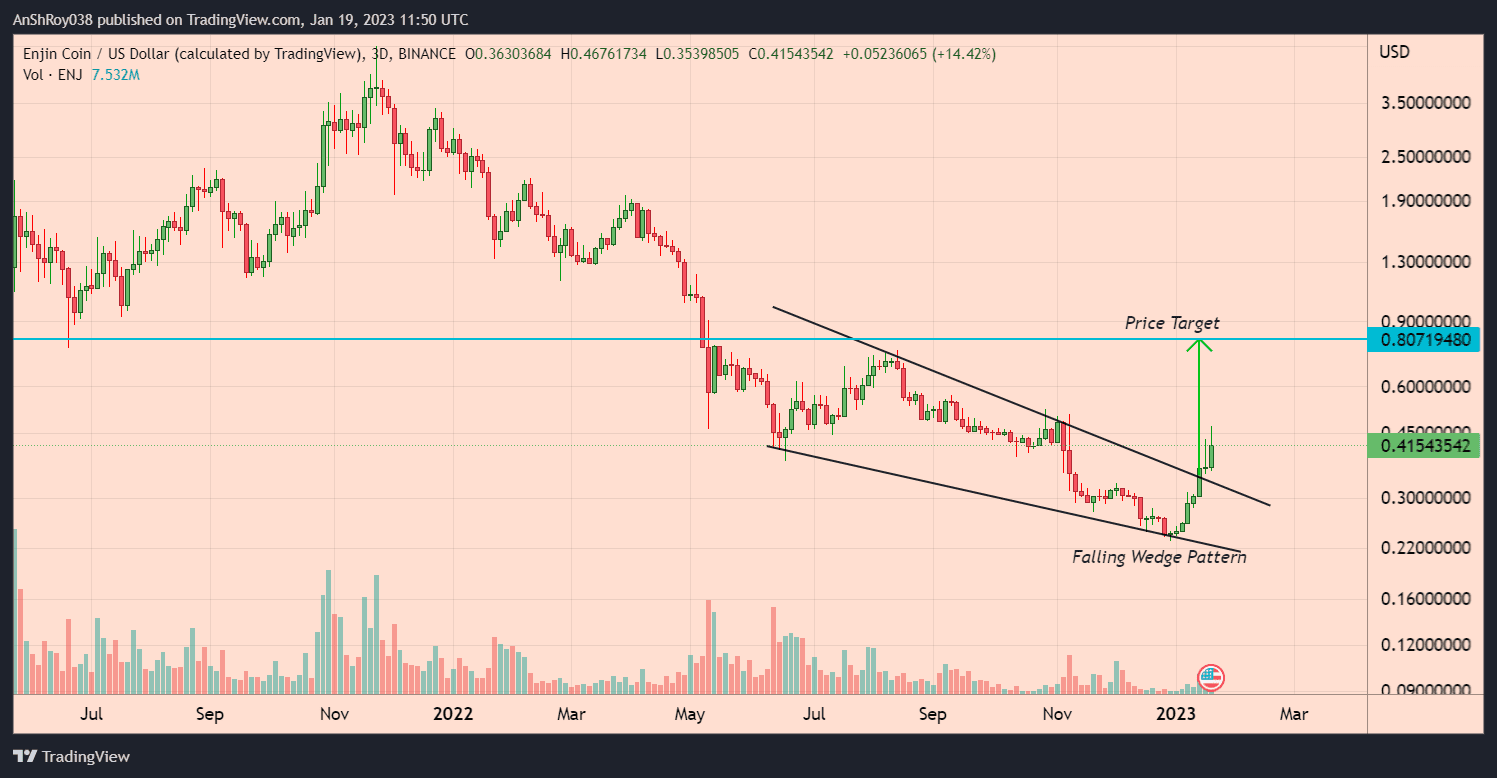
The upside target for the breakout is equal to the maximum distance between the falling wedge’s upper and lower trendlines. Per the rules of technical analysis, ENJ price might jump more than 152% from its breakout point to reach $0.807.
ENJ price spiked 32% on Jan 19 to form a daily high near $0.468 before correcting. Moreover, the spike brought the Enjin crypto token’s gains in Jan to nearly 97% from Jan 1’s low of $0.24. But, the long upper wicks on the daily candles suggest bears are aggressively defending the higher price levels.
Moreover, the recent rally pushed the Enjin crypto token’s relative strength index into the overbought region (>70) on Jan 12. Traditionally, overbought RSI levels forecast a trend reversal, prompting traders to start selling. But, bulls continue to push price upwards, despite RSI clocking at 87.31 on the daily charts.

If the overbought RSI forces more traders to start selling, ENJ price might drop to support near $0.39. Moreover, breaching below immediate support might force the Enjin crypto token to drop to support from its 100-day EMA (blue wave) near $0.348 before recovering.
Conversely, if bulls continue the upside rally, ENJ could face resistance near $0.44. A break and hold above immediate resistance might give ENJ the momentum needed to rise to resistance from its 200-day EMA (green wave) near $0.492 before downside corrections pare gains.
3. DATA Price Up 60% After Confirming Falling Wedge Pattern
Like Enjin Coin, Streamr DATAcoin’s native token DATA also formed and confirmed the falling Wedge pattern. Per the rules of technical analysis, the crypto token had a price target of $0.0585, a jump of more than 105% from the breakout level of $0.0284.
DATA broke out of the pattern on Jan 17 and gained 60% of the pattern’s price target, reaching a

Breakout from the falling wedge pattern and the general bullishness of the wider crypto market helped the Streamr crypto token post an impressive rally. DATA price rose 58.5% on Jan 18 to reach a high near $0.046.
However, bears pushed back against the uptrend, forcing bulls to pare gains. On Jan 19, DATA spiked 34.5% before losing nearly all the gains as the day progressed, highlighting the bearish pressure on the Streamr crypto.
Moreover, the rally resulted in the relative strength index for the Streamr crypto becoming overbought, with a value of 87.46 on the daily chart. Overbought RSI levels often forecast an impending trend reversal for an asset. As a result, traders consider the pattern a sell signal.

Thus, if the sell-off continues, DATA price might drop to support near $0.035. Breaching below immediate support might force the Streamr crypto to below its 200-day EMA (green wave) to test support near $0.0323.
Meanwhile, DATA’s 20-day EMA (red wave) moved above its 100-day EMA (blue wave) to form a bullish pattern called the golden cross. Market participants often consider the pattern a buy signal, which could translate into a bullish cue for DATA price action.
If buyers enter the market, DATA price might try to challenge resistance near $0.0395. Sustained buying pressure might force DATA price to rise to resistance near $0.044 before downside corrections pare gains.
4. OCEAN Breaks Out Of Ascending Triangle Pattern, But It Might Be A Fakeout
OCEAN price apparently confirmed a bullish pattern called the ascending triangle. However, OCEAN’s price action following the breakout suggests OCEAN’s rally might be a fakeout.
Also Read: WAX Price (WAXP) shows bullish potential after 25% intraday jump – what’s next?In detail, a horizontal trendline that connects swing highs and an ascending trendline connecting swing lows forms an ascending triangle pattern. Volume helps determine if a breakout is strong. As such, a breakout on the upside with low volume is very likely to fail, resulting in a pullback.
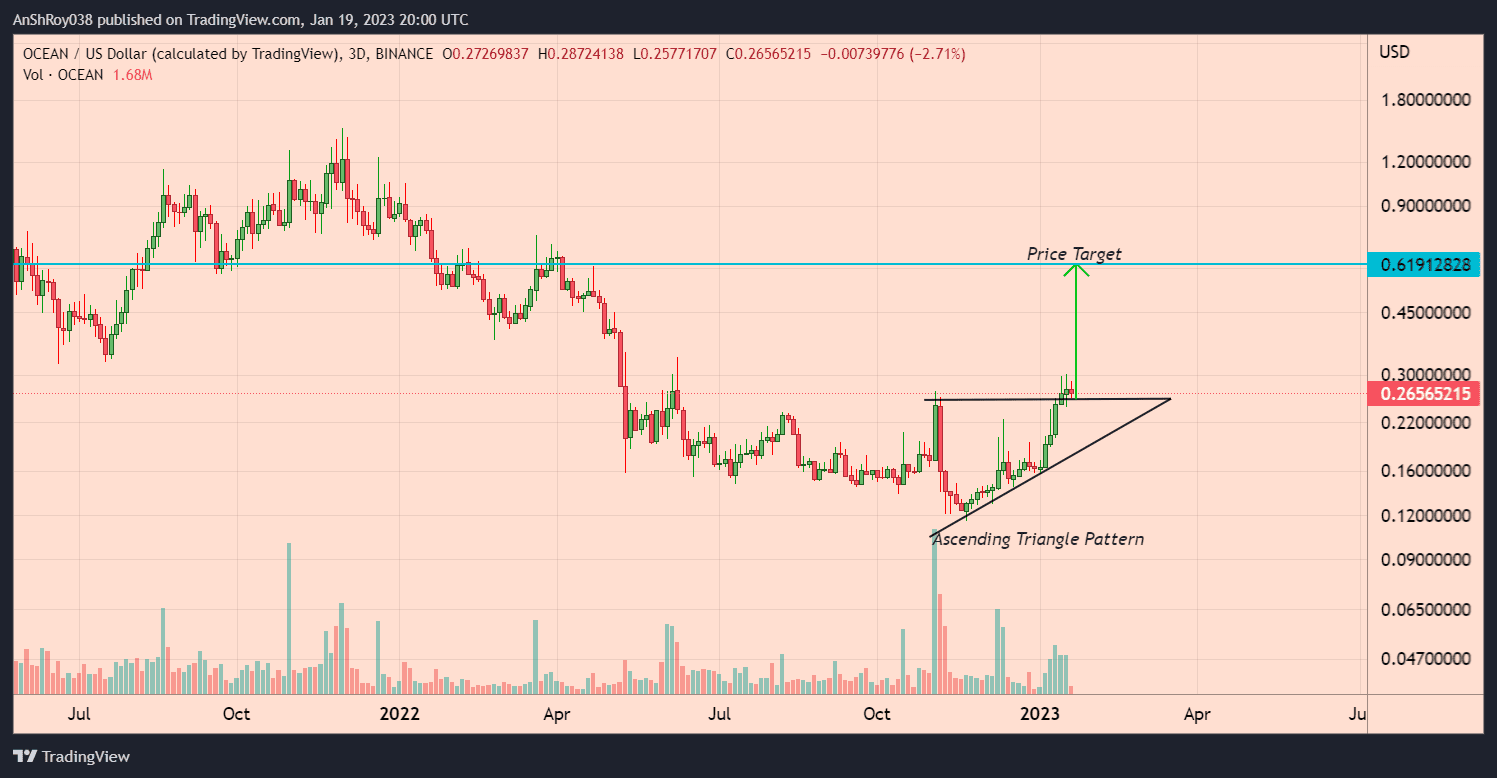
The height of its thickest section determines the price target in an ascending triangle. Thus, for OCEAN’s technical setup, the price target would be $0.619, a gain of 139.5% from the breakout level of $0.2585.
But, the Ocean Protocol crypto price started crabbing after breaking above the upper trendline of the triangle pattern. The price action suggests that the OCEAN lacked the bullish pressure needed to paint a strong breakout from the pattern. Moreover, the crypto token is likely to return inside the pattern.
OCEAN price painted its second consecutive red candle on Jan 19, dropping more than 10% to form a daily low near $0.258. If bulls manage to start an uptrend, OCEAN would need to conquer resistance near $0.274.
Breaking and consolidating above immediate resistance might help the Ocean Protocol crypto price challenge resistance near $0.305 before downside corrections pare gains.

Meanwhile, the momentum oscillator MACD is forecasting bearish signals for OCEAN’s price momentum.
Positive bars on the indicator’s histogram are contracting, indicating that the MACD line (difference between 12-day and 26-day EMA) is moving towards the MACD signal line (9-day EMA of MACD). When the MACD line moves below the signal line, it will form a bearish crossover.
If bears continue to sell, OCEAN price might drop to support near $0.254. Moreover, a market-wide selloff could force the Ocean Protocol crypto token to test support from its 20-day EMA (red wave) near $0.232 before recovering.

… [Trackback]
[…] Read More Info here to that Topic: coinchapter.com/enj-data-ocean-confirm-bullish-patterns-hbar-spikes-61-jan/ […]
… [Trackback]
[…] Find More to that Topic: coinchapter.com/enj-data-ocean-confirm-bullish-patterns-hbar-spikes-61-jan/ […]
… [Trackback]
[…] Find More to that Topic: coinchapter.com/enj-data-ocean-confirm-bullish-patterns-hbar-spikes-61-jan/ […]
… [Trackback]
[…] Read More Info here on that Topic: coinchapter.com/enj-data-ocean-confirm-bullish-patterns-hbar-spikes-61-jan/ […]
… [Trackback]
[…] Find More Information here to that Topic: coinchapter.com/enj-data-ocean-confirm-bullish-patterns-hbar-spikes-61-jan/ […]
… [Trackback]
[…] Information to that Topic: coinchapter.com/enj-data-ocean-confirm-bullish-patterns-hbar-spikes-61-jan/ […]
… [Trackback]
[…] Information to that Topic: coinchapter.com/enj-data-ocean-confirm-bullish-patterns-hbar-spikes-61-jan/ […]
… [Trackback]
[…] Find More Info here on that Topic: coinchapter.com/enj-data-ocean-confirm-bullish-patterns-hbar-spikes-61-jan/ […]
… [Trackback]
[…] Find More on that Topic: coinchapter.com/enj-data-ocean-confirm-bullish-patterns-hbar-spikes-61-jan/ […]