
Key Takeaways:
- Ethereum (ETH) will decline due to bearish technical setup, says Peter Brandt, the CEO of trading firm Global LLC.
- However, the weekly chart argues that the situation is not as dire as Mr.Brandt predicted.
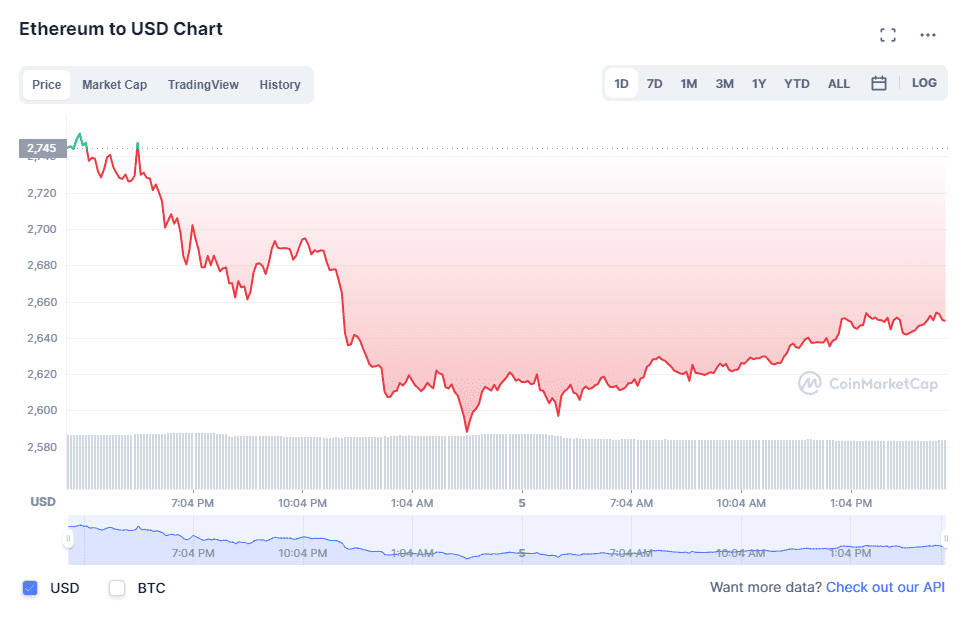
YEREVAN (CoinChapter.com) – Ether (ETH), the in-house token of the largest DeFi platform Ethereum, traded above $2,650 ahead of the London session opening hours on Mar. 5. The digital asset mimicked Bitcoin’s price action as it lost 12% in the previous three days.
Furthermore, a veteran investor and trader, Peter Brandt, forecasted a further decline for ETH, based on a bearish technical setup.
ETH daily chart
Mr. Brandt tweeted the ETH/USD daily chart featuring a Symmetrical Triangle formation. The latter entails two converging trendlines with a similar slope that enclose the price action and loser the swing as the Triangle progresses.
Moreover, the Symmetrical Triangle is a continuation pattern. Thus, once the digital asset exhausts the formation, it tends to adopt the bias that preceded the pattern.
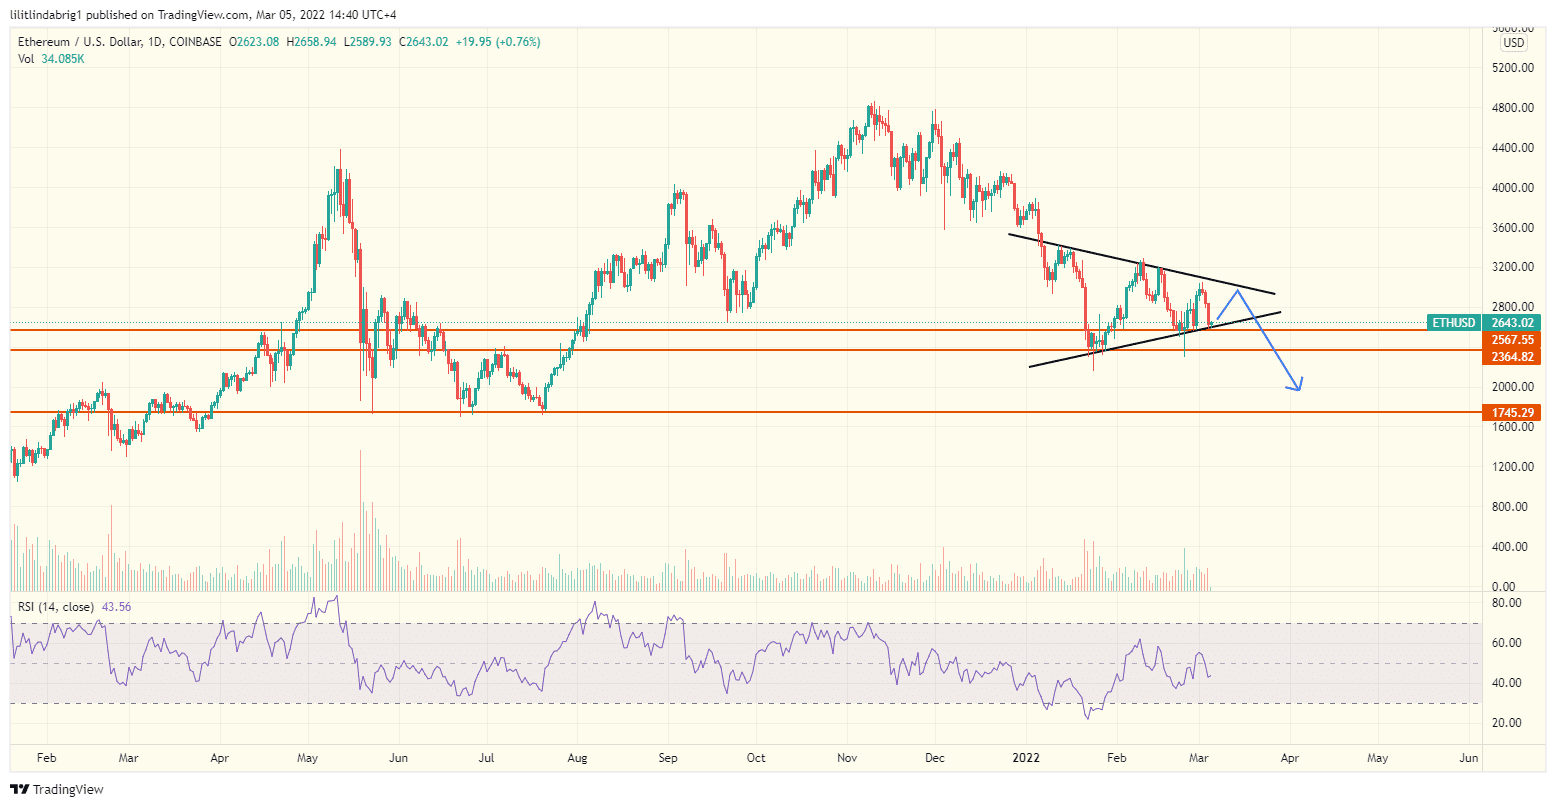
Considering Ether’s bearish incentive before the setup, Mr. Brendt asserted that it will likely continue in the upcoming sessions. Moreover, he jokingly commented that “some Gen Zer or Millennial who lives in mommy’s basement and trades crypto fractionals” will remind him of the prediction in a few years.
Also read: Bitcoin ‘fishes’ return to accumulation as BTC eyes $45K breakout.
However, Ether’s decline is not inevitable, as the digital asset found itself in a confluence of support on Mar. 5. The token’s ability to bounce from it will determine future bias.
Ethereum’s conflicting technicals
The second-largest cryptocurrency token has traded in an Ascending Channel for a year. Moreover, the weekly chart below shows that Ether dropped to the Channel’s lower trendline and consolidated sideways for the previous two weeks.
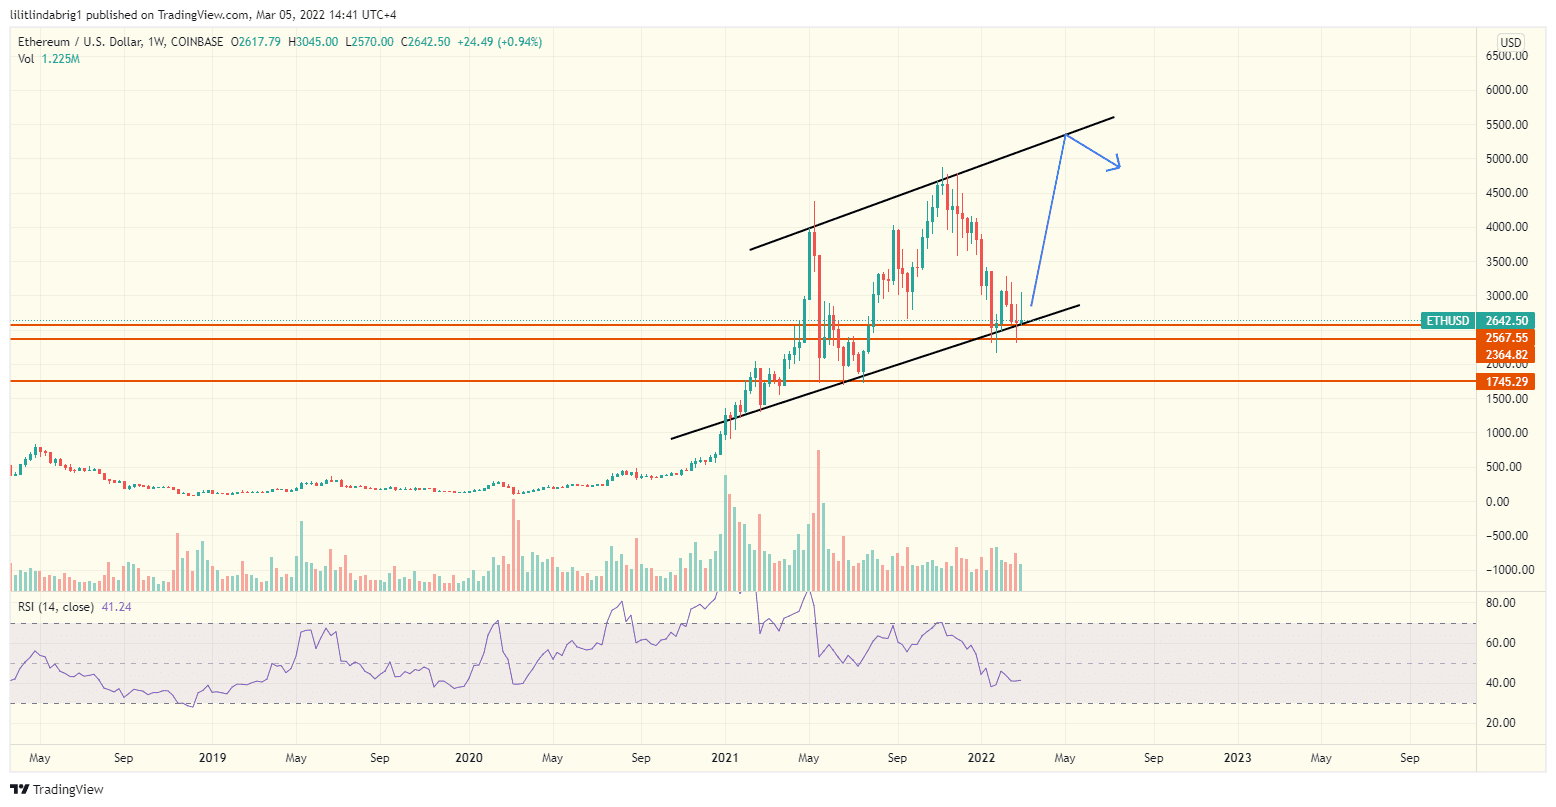
In detail, the Ascending Channel does not entail a continuation or a reversal. However, it can be handy in making short-term predictions as long as the setup remains relevant. Thus, ETH solidified its relevance by repeatedly retesting the support line.
Also read: Ethereum snubs bearish Morgan Stanley report as ETH holds strong above $2.5K.
Should the Channel stay instrumental, the digital asset could get a ticket out of Mr. Brendt’s bearish prediction and move upside in Q2 2022.
Moreover, the second relevant support stood at $2,650, just below the current value. Thus, Ether’s ability to hold the mentioned support levels will determine the price action for the next few weeks.

… [Trackback]
[…] Find More here to that Topic: coinchapter.com/ethereum-eth-dump-ahead-veteran-investor-says-yes/ […]
… [Trackback]
[…] There you can find 46657 additional Information to that Topic: coinchapter.com/ethereum-eth-dump-ahead-veteran-investor-says-yes/ […]