
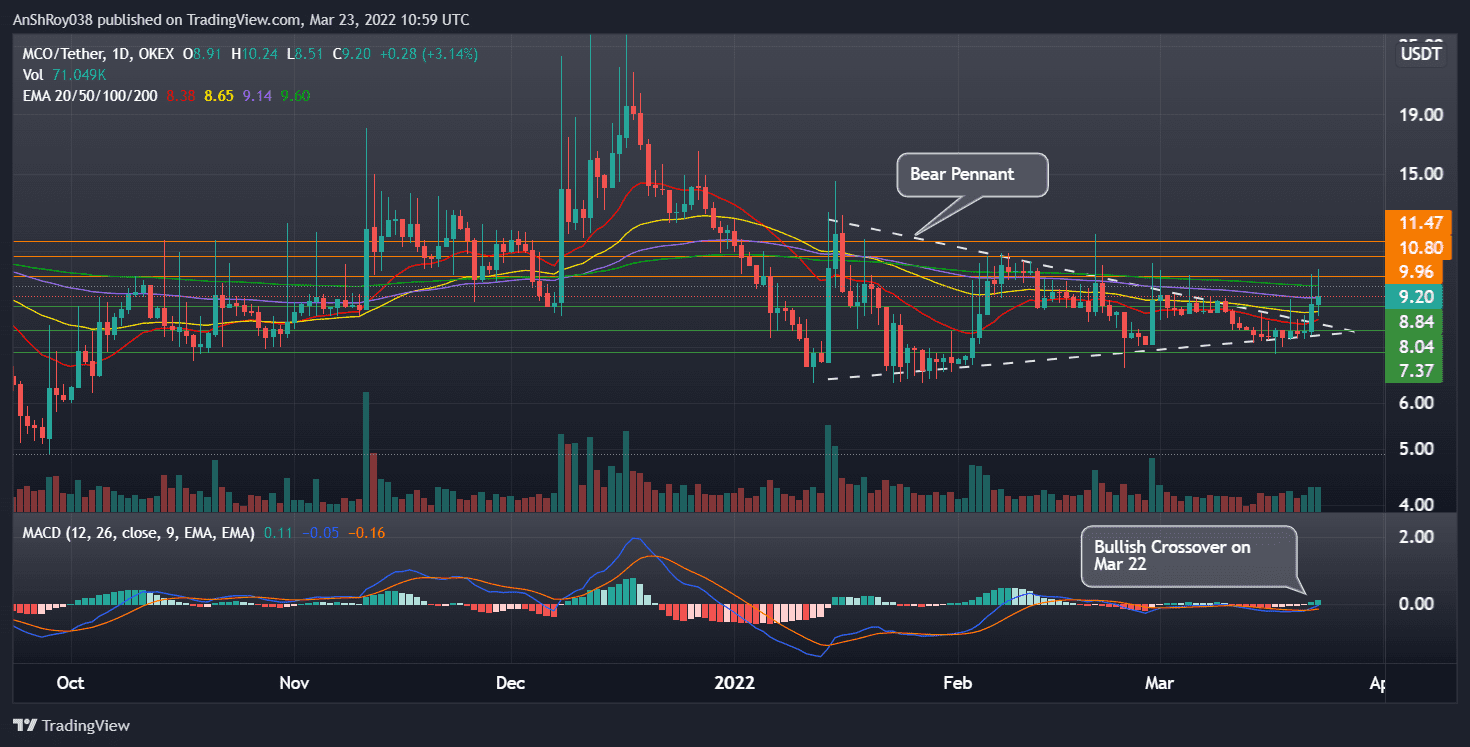
NEW DELHI (CoinChapter.com) — Crypto.com’s native token MCO invalidated a bearish technical pattern called a bear pennant, but the token may not be out of the woods yet.
In detail, a bear pennant forms when an asset starts consolidating briefly after a strong downside movement before breaking down further. The price target equals the initial drop in the asset’s price, measured from the breakdown point.
MCO prices would have dropped to $3.2, a fall of around 65% from current prices. However, the Crypto.com token’s recent rally helped MCO break above the upper trendline of the pennant, indicating the token broke above the bearish pattern.
But, the breakout still needs confirmation. Hence, MCO prices would likely return to test the pennant’s upper trendline as support.

MCO jumped more than 32% in the week starting Mar 21, but long upside wicks on the daily candles indicate strong bear activity. The Crypto.com token jumped more than 24% on Tuesday, but profit booking pared gains, and MCO ended the day up 11.4%.
If bears’ grip on MCO prices grows, the token could fall to immediate support near its 50-day exponential moving average (yellow wave) at $8.8. A sustained sell-off could bring MCO down to test pennant’s upper trendline as support near $8.
Also Read: Crypto.com partners with FIS’s Worldpay to support global expansion.A re-entry inside the pennant could push the Crypto.com token’s prices down to test support near $7.3. In addition, the relative strength index for MCO remains neutral at 61.58, but the RSI trendline is moving steadily upwards. As such, the token faces the danger of an overbought RSI.
To recap, an overbought RSI is often the precursor of an upcoming trend reversal.
MCO MACD Charts Bullish Crossover
Meanwhile, trend-based momentum indicator MACD charted a bullish crossover for MCO on Tuesday.
A bullish crossover occurs when the MACD line (difference of 12-day and 26-day EMA) moves above the MACD signal line (9-day EMA of MACD). Traders usually consider the chart pattern as a buy signal, helping boost the asset’s prices.
MCO could take bullish cues from news of Crypto.com becoming the first crypto trading platform sponsor of the 2022 FIFA World Cup in Qatar. FIFA said the exchange’s branding will appear both inside and outside the stadiums which will host the world cup matches.
Also Read: Ethereum Classic risks serious declines as ETC rallies 70% in a week.If MCO prices continue to rally upwards, the token would likely flip immediate resistance just above its 200-day EMA (green wave) at $10 before moving to challenge resistance near $11. Finally, a sustained uptrend could see MCO prices target $11.5 before corrections pare prices.
At the time of writing, MCO was trading at $9.3, up 4.15% on the day.

Blockchain technology news
Bitcoin halving news
… [Trackback]
[…] Information to that Topic: coinchapter.com/crypto-mco-avoids-bearish-technical-setup-but-downside-risks-remain/ […]
… [Trackback]
[…] There you will find 55144 additional Info on that Topic: coinchapter.com/crypto-mco-avoids-bearish-technical-setup-but-downside-risks-remain/ […]
… [Trackback]
[…] Find More to that Topic: coinchapter.com/crypto-mco-avoids-bearish-technical-setup-but-downside-risks-remain/ […]